By Ross Stein and David Jacobson, Temblor
Revised: April 14, 2017
It certainly has sprung a leak
In September, Congress will vote whether the National Flood Insurance Program should be reauthorized. The vote will come during a year in which premiums will rise on average 6%, with potential increases of 25% coming. While this program provides insurance for 5 million households, it is currently $24 billion in debt. The rise in premiums is an attempt to make the program solvent.
While a $24 billion debt is significant, it should be pointed out that the vast majority of losses com from two events, Hurricane Katrina in 2005, and Hurricane Sandy in 2012. In most years, the program saw profits. So, what can be done to ensure the National Flood Insurance Program remains viable?
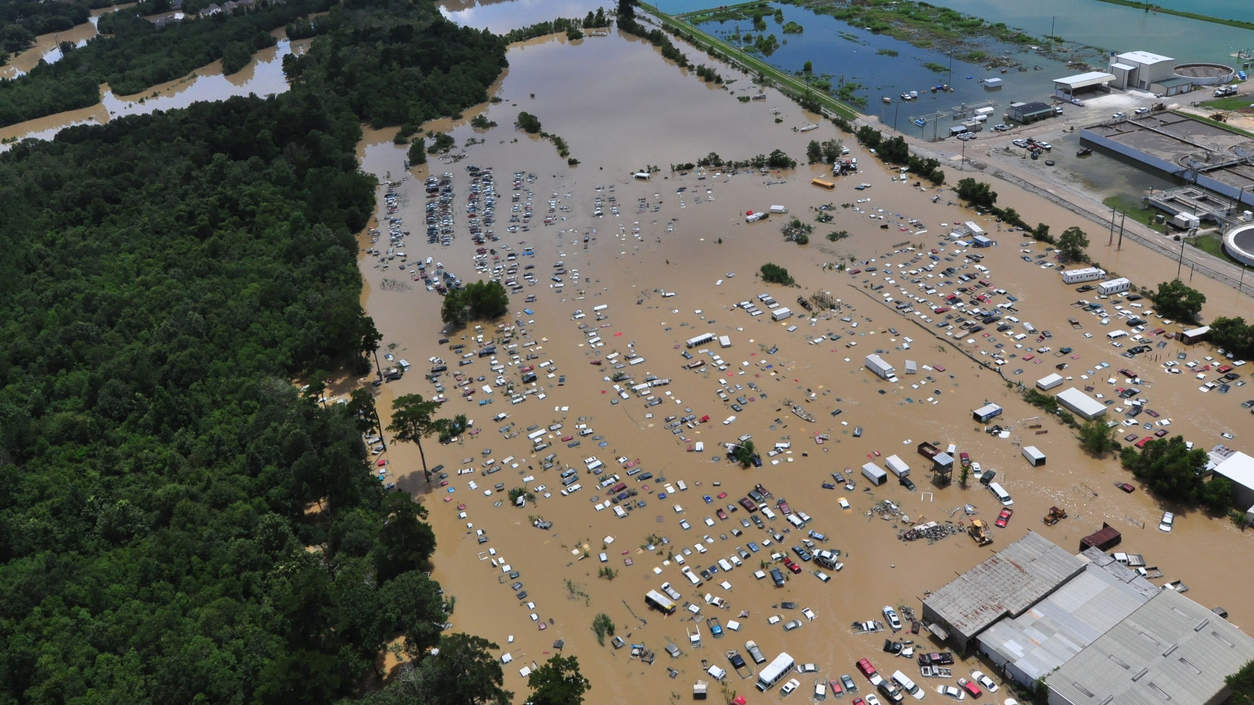
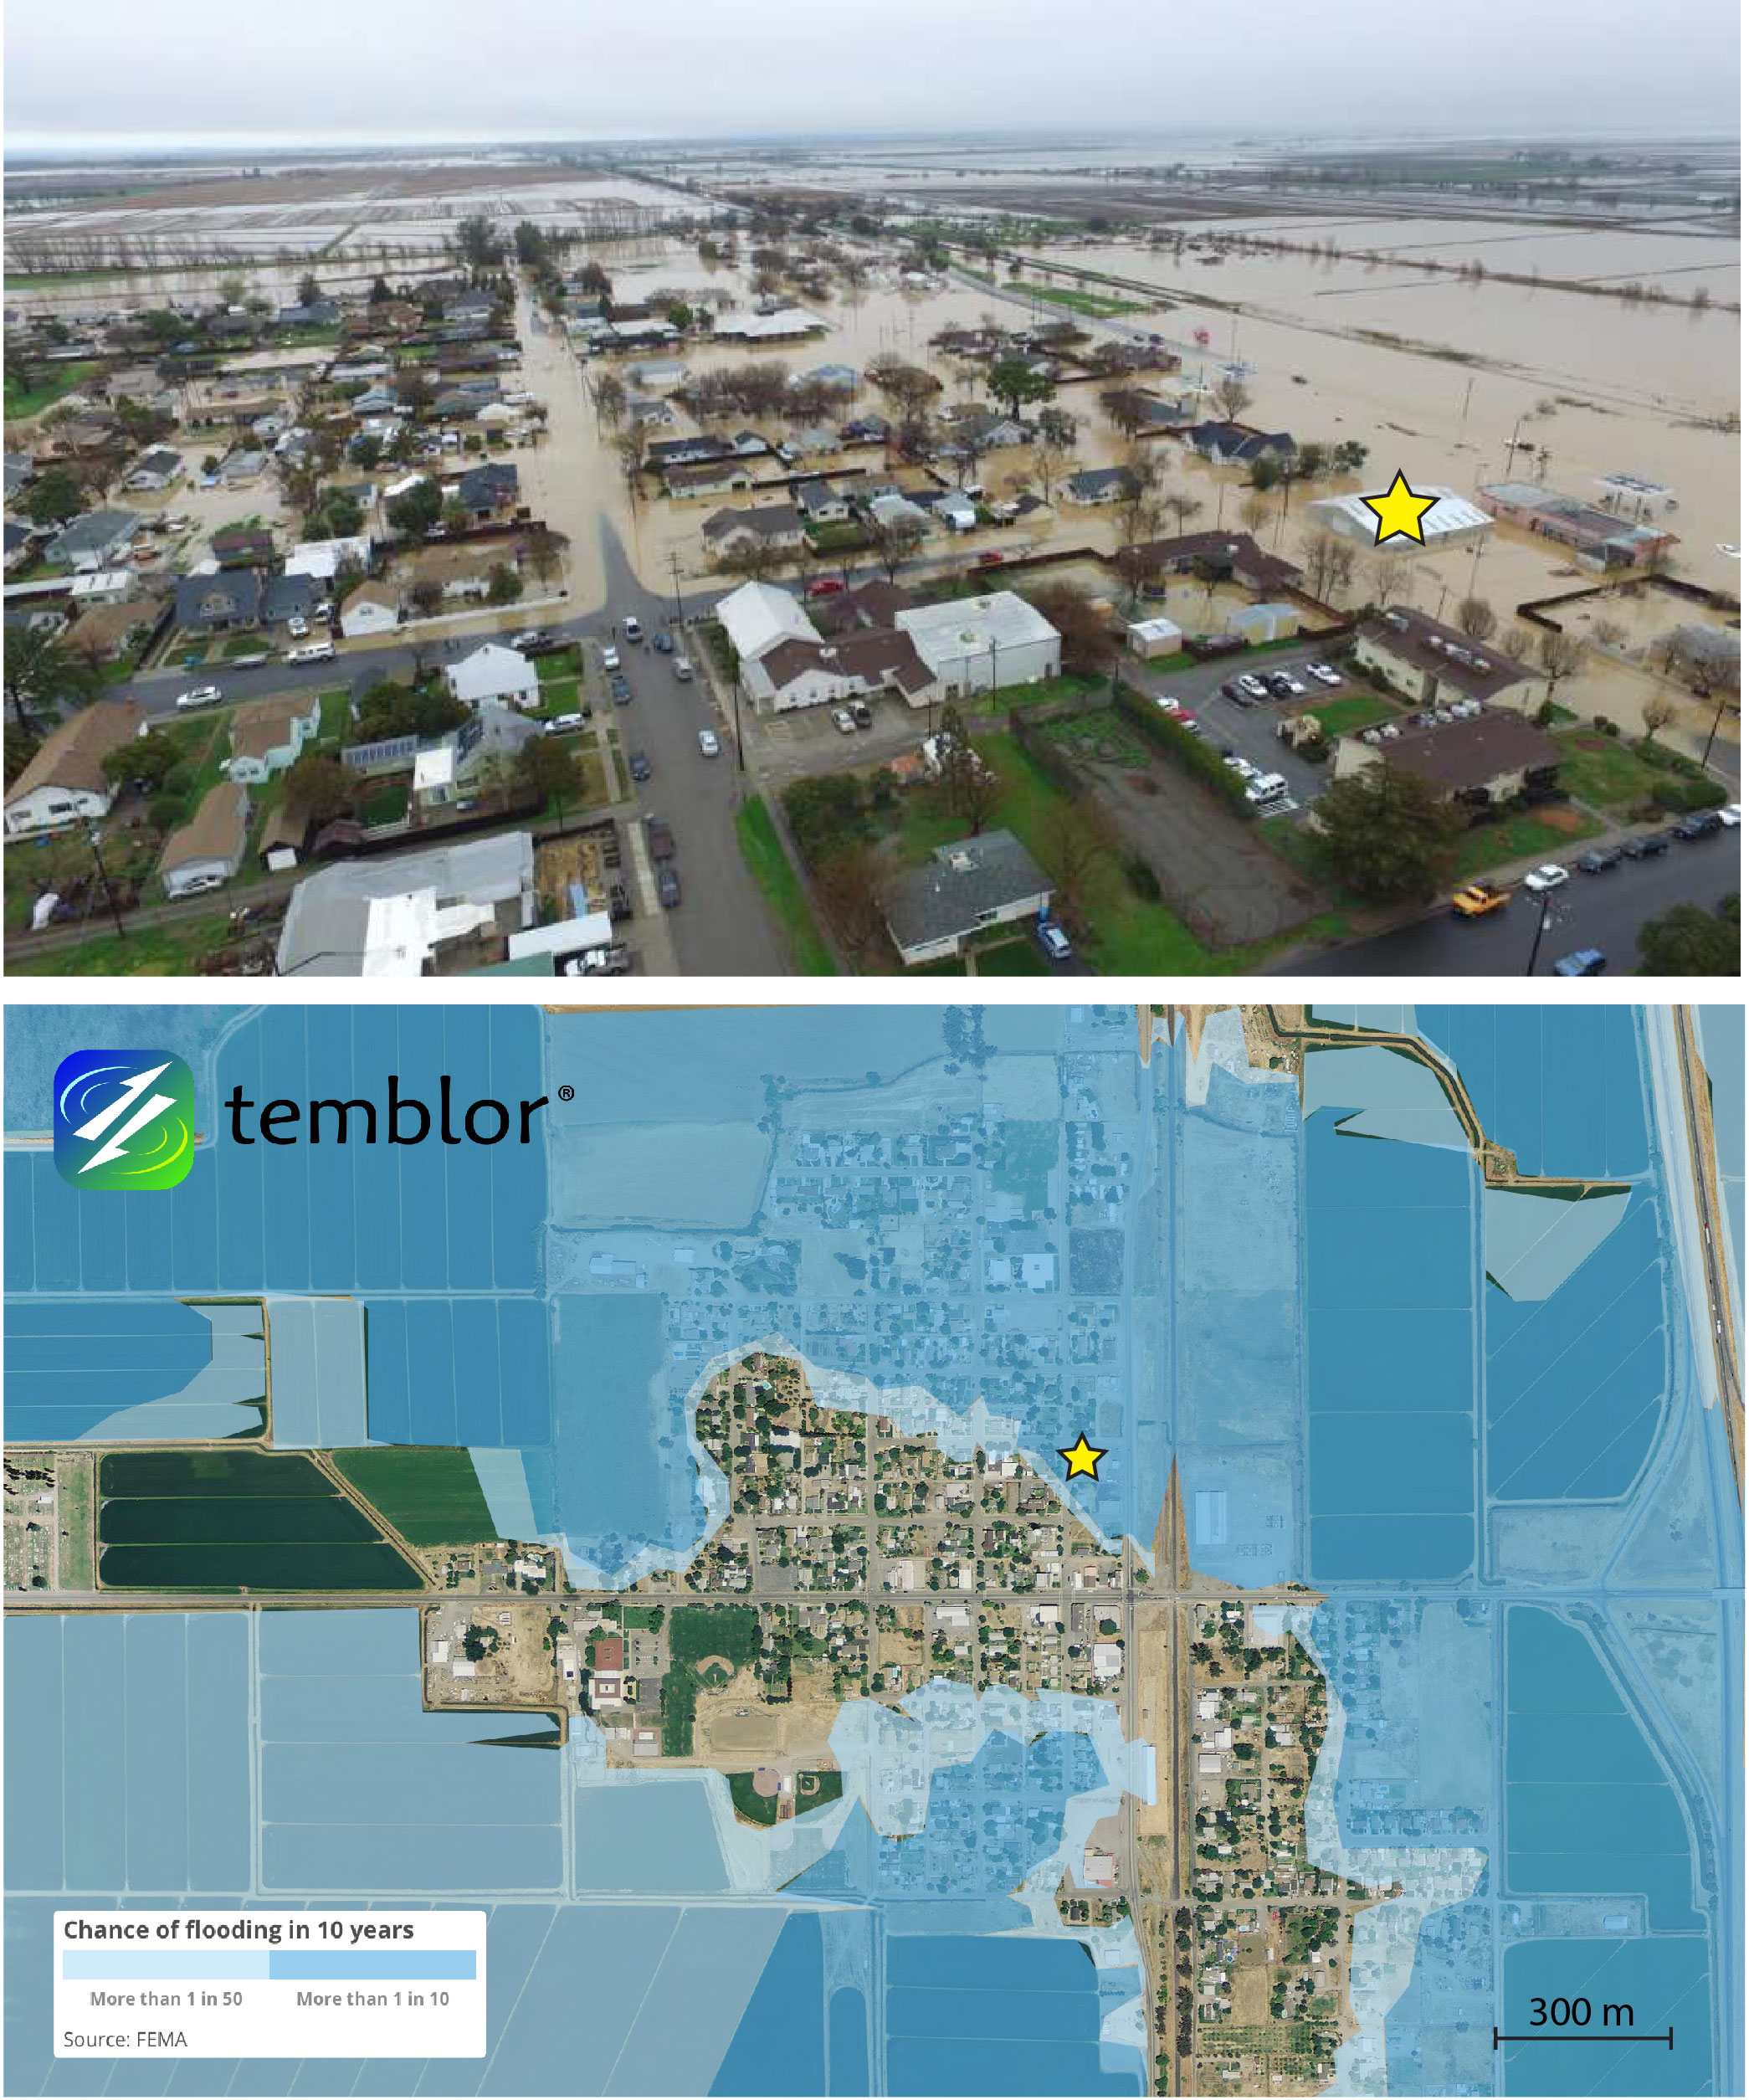
Mortgage lenders require that if you live in a zone with a 1% chance per year of flooding (1 chance in 10 in a decade) as mapped by FEMA you are required to carry insurance. If this does not apply to you, purchasing flood insurance is voluntary. Fortunately, these 1% per year flood zones have done a remarkably good job forecasting flood events both in California this year, and Louisiana last year (see images below). So, from our analysis, this aspect of the program is invaluable.
But there are inundations, such as the 2016 Baton Rouge, Louisiana flood, in which a number of areas outside the 1% per year zones were nevertheless flooded. In Louisiana, about 38% of the flood policies are held outside the mandatory zones, and these soak up about 12% of the claims. This is about what one would expect or perhaps several percent higher, indicating that the flood zone maps still need more work.


What should be done?
In order to accurately price flood insurance premium, a home’s risk of flooding must be calculated. In 2012, the National Flood Insurance Program attempted to do this by passing the Biggert-Waters Act, which required that if you live near a body of water that frequently floods, you have to pay more. But public outcry prompted Congress to pass the Flood Insurance Affordability Act in 2014, which extended the timeframe of raising premiums.
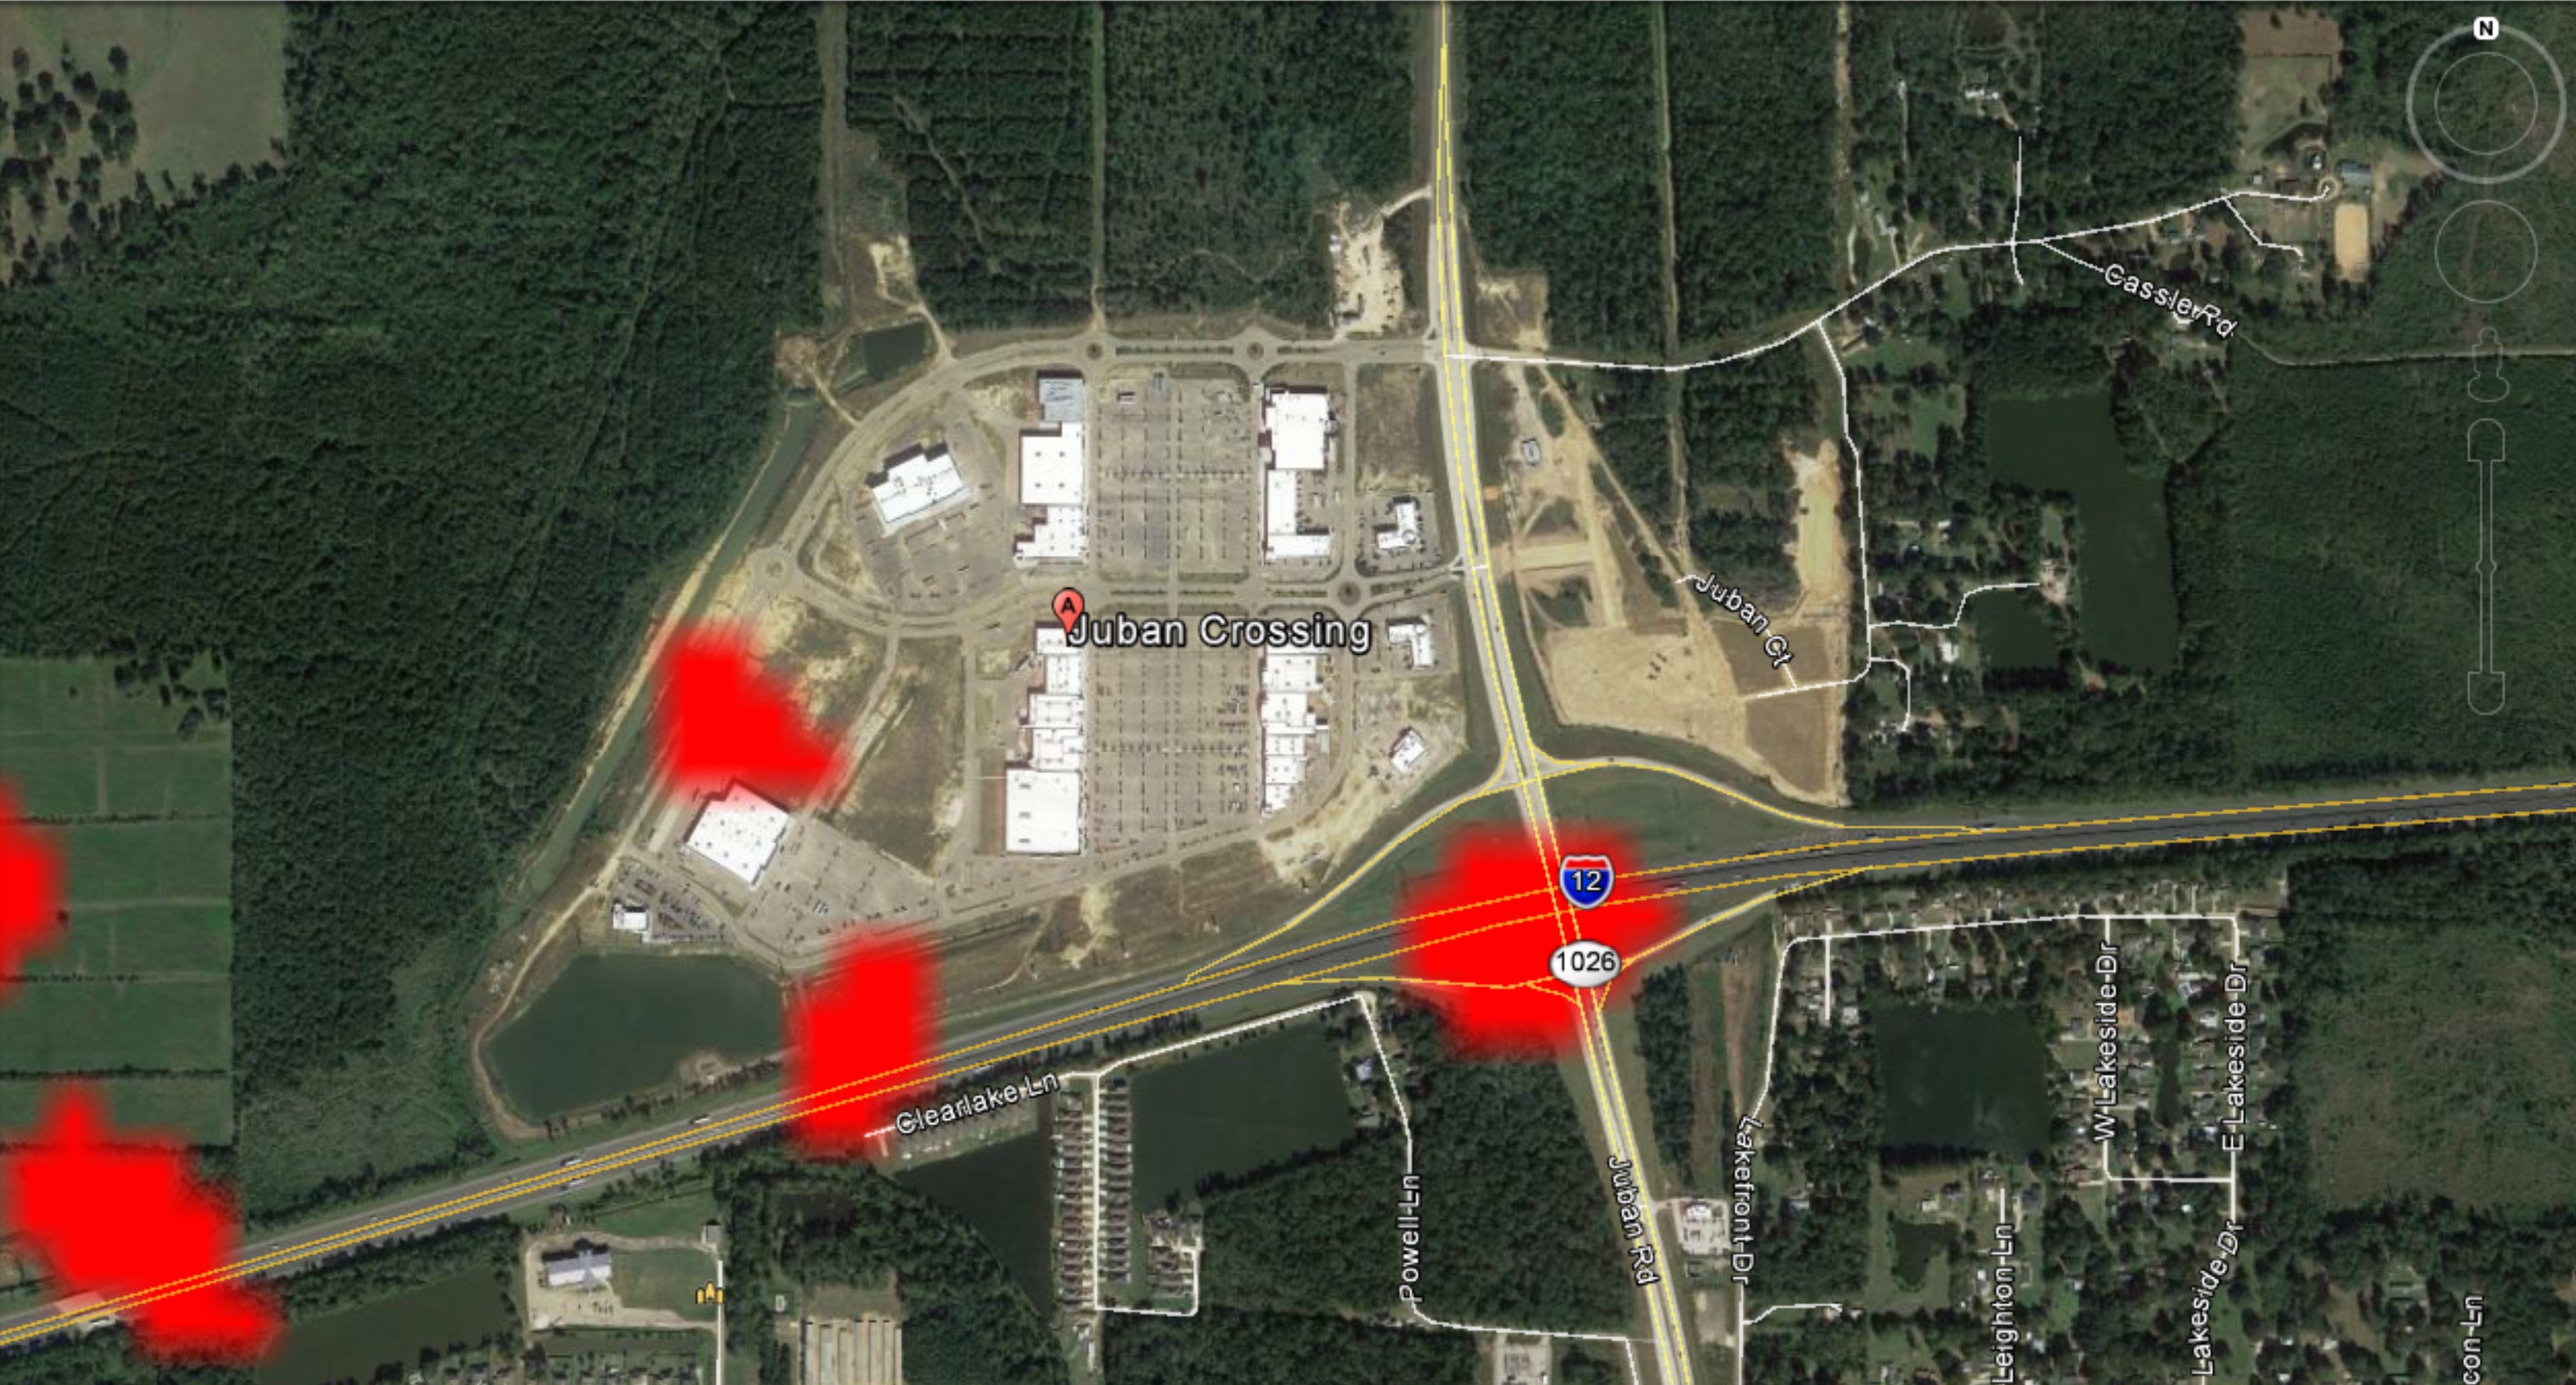
While this was a step in the right direction, it’s inaccurate and inadequate. To truly determine risk and properly price premiums would involve examining detailed footprints of past flood events. Even the NASA Jet Propulsion Laboratory’s ARIA project, using the best available satellite radar technology, currently misses the mark on this (see images below).

We believe that Congress should reauthorize the National Flood Insurance Program, as it provides protection to five million Americans. One of the program’s principle virtues is that the flood maps on which it is based are in the public domain, and so available to all (and to anyone with the Temblor app). But to remain viable, premiums must be based on risk, unfettered by politics. This means that if you live in an area that floods frequently, you should pay more. This ensures that no one subsidizes anyone else’s premium. If FEMA does not under-charge for its premiums, not only will it be solvent in the long run, but private insurers will jump in to participate as well. The combination of public and private providers makes for a financially stronger system, and also creates a competitive market. But in order to ensure that people in high-risk areas—such as river flood plains and barrier beaches—are not jolted by a sudden price jumps, the premiums should gradually rise over five to ten years.
To accomplish these changes, more mapping must be undertaken, as the current FEMA maps are quite incomplete, and as one can see from the Louisiana maps, some are also inaccurate. Premiums are based not on these maps alone, but also on thousands of scenarios of potential floods of all sizes and frequencies. For these scenarios to be realistic, we must capture accurate footprints of all actual flooding events. Even for the most recent floods, these footprints are still uncertain, calling for new technology, perhaps bolstered by crowd-sourcing.

References
FEMA
NASA Advanced Rapid Imaging and Analysis (ARIA) Center for Natural Hazards – Link,
CBS News
NPR
California Water Blog – Link
- Beware quiet segments of the Philippine Fault - May 16, 2025
-
ډیری عوامل افغاني ټولنې د زلزلې پر وړاندې زیانمنوي
- August 11, 2022 - What’s happening this week in Humboldt County, California: The squeeze - February 6, 2019