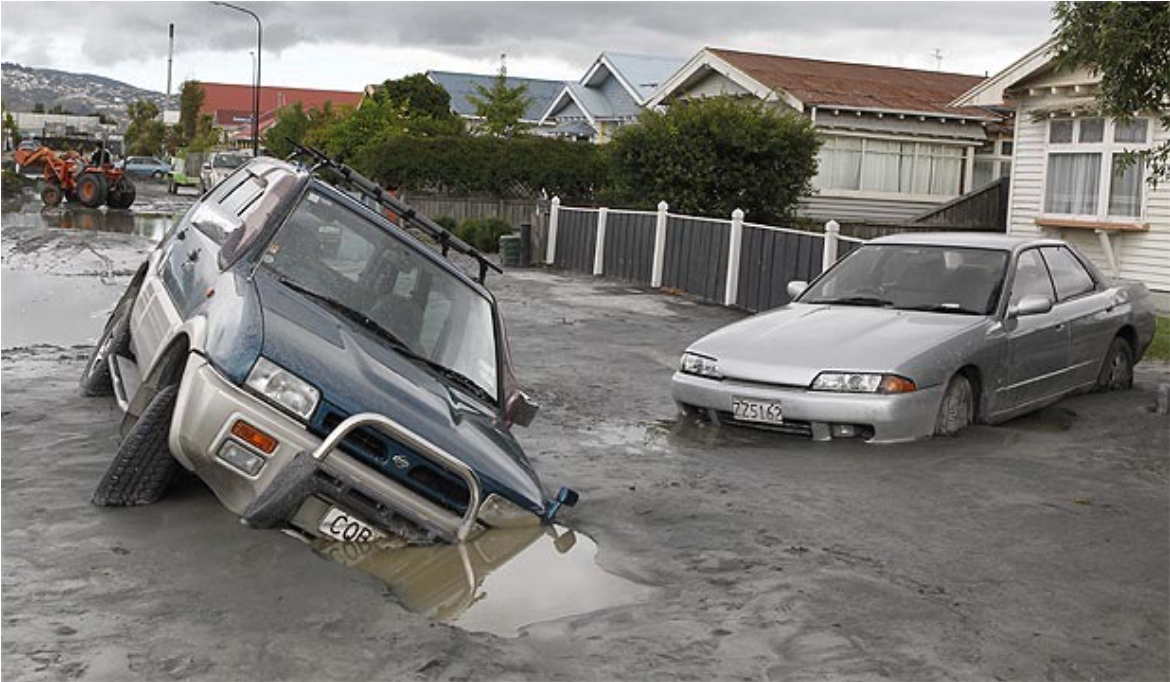
During intense earthquake shaking, water-saturated sediments can turn into a slurry (liquefaction), causing buildings, cars and other heavy objects lying on top of what were formerly stiff, dry sediments or sand, to sink or tilt. This is something I experienced firsthand while pursing my M.Sc. degree in Geology at the University of Canterbury in 2013-2015.
Christchurch and Tohoku transformed our understanding of liquefaction
In the 2011 earthquakes in Christchurch, New Zealand, and Tohoku, Japan, liquefaction was extremely widespread, in some cases, devastating entire neighborhoods. However, an outgrowth of these events is a much better understanding about where liquefaction can happen, when it can happen, and what it can do. In fact, Christchurch residents became some of the most quake-savvy people in the world.
At Temblor, we want to people to better prepare themselves for what could come to pass. Perhaps one reason why earthquakes are not often discussed is fear. The idea of a magnitude-9 Cascadia earthquake off the coast of Oregon and Washington, or a magnitude-8 along the San Andreas Fault scares us all. So, in several blog posts, I will attempt to shed light on what liquefaction is, using my former home of Christchurch, New Zealand as a case study of what it is like to live with and be surrounded by liquefaction.
At 4:35 a.m. on September 4, 2010, Christchurch was rattled by a magnitude-7.1 earthquake. Over the next 4 years, over 10,000 aftershocks of varying size shook the city, most notably a magnitude-6.3 quake on February 22, 2011 which left 185 people dead, and large sections of the city in ruin. The February earthquake was so devastating in part because the epicenter was shallow (5 km or 3 mi) and located a few miles outside the city, meaning urban levels of shaking were some of the highest ever recorded, and the liquefaction was among the most profound and widespread ever experienced. However, Christchurch did not liquefy in every earthquake, and large sections of the city were left nearly unharmed by the earthquakes, making driving through the city an eerie experience. Nevertheless, liquefaction did occur on at least 8 occasions throughout the city. Additionally, in the magnitude-5.7 February 14, 2016 Valentine’s Day Earthquake, Christchurch one again experienced liquefaction. This not only highlighted how long earthquake sequences can last, but brought more damage to the still recovering city.

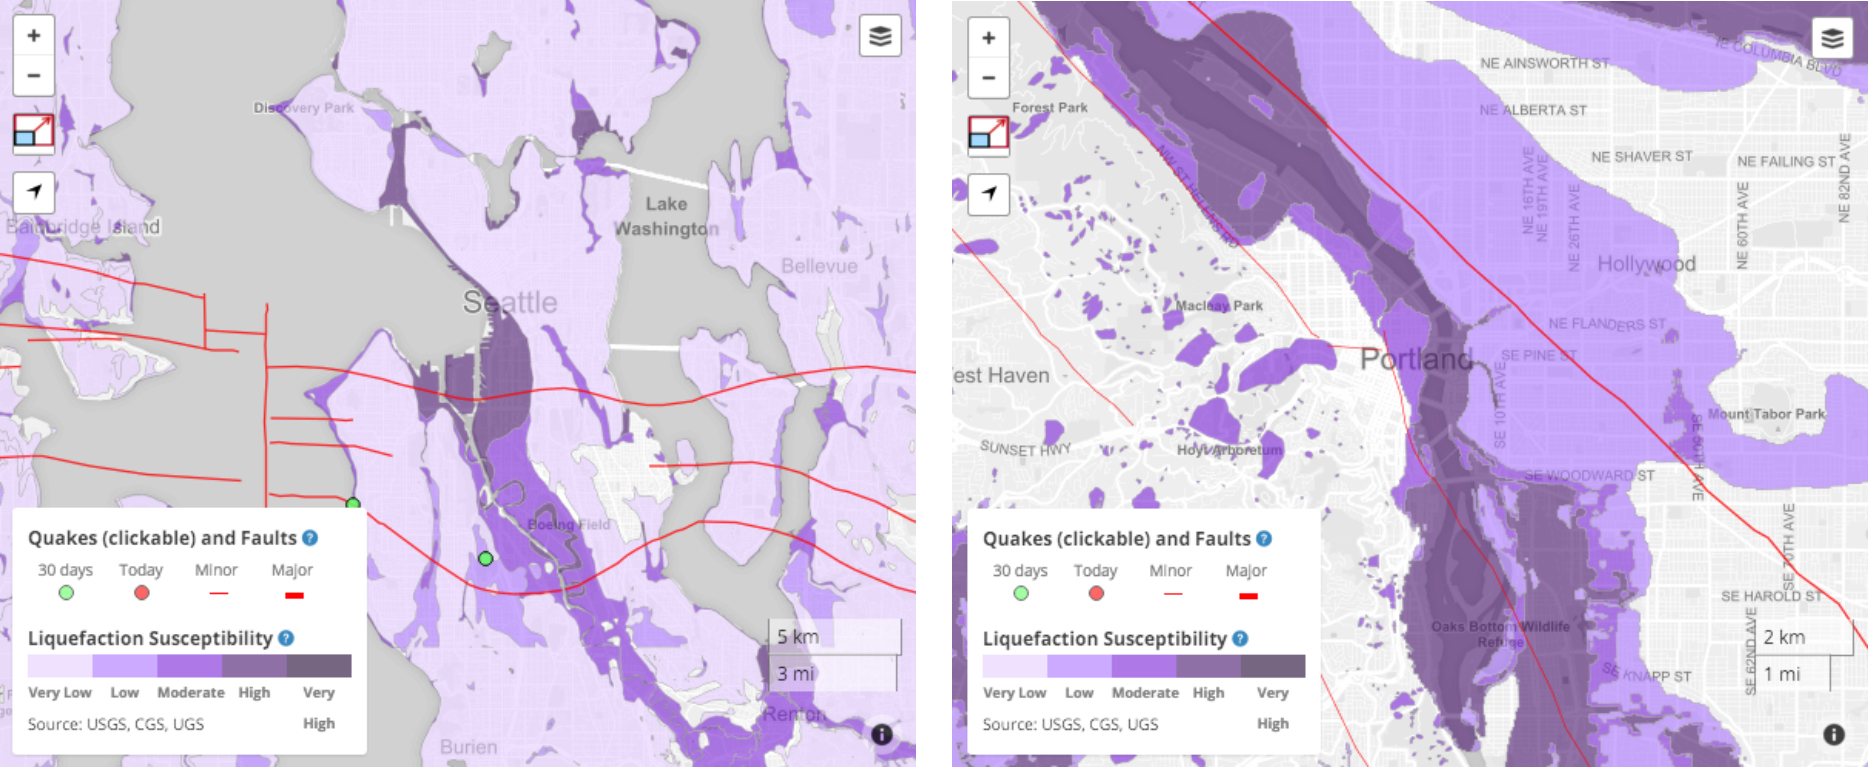
Temblor seeks to make it easy to learn where the liquefaction potential is high


In the next blog post, I will delve into some of the science behind liquefaction, including the research I was involved in during my 3 years in Christchurch. If anyone has questions or comments regarding these blogs or would like to be directed towards liquefaction data and/or research, post in the comments below and I will get back to you as soon as possible.
David Jacobson, Researcher, Temblor, Inc.
Data from GNS Science, University of Canterbury, and Witter et al., USGS Open-File Report 2006-1037, Maps of Quaternary Deposits and Liquefaction Susceptibility in the Central San Francisco Bay Region, California (2006).
- Beware quiet segments of the Philippine Fault - May 16, 2025
-
ډیری عوامل افغاني ټولنې د زلزلې پر وړاندې زیانمنوي
- August 11, 2022 - What’s happening this week in Humboldt County, California: The squeeze - February 6, 2019