
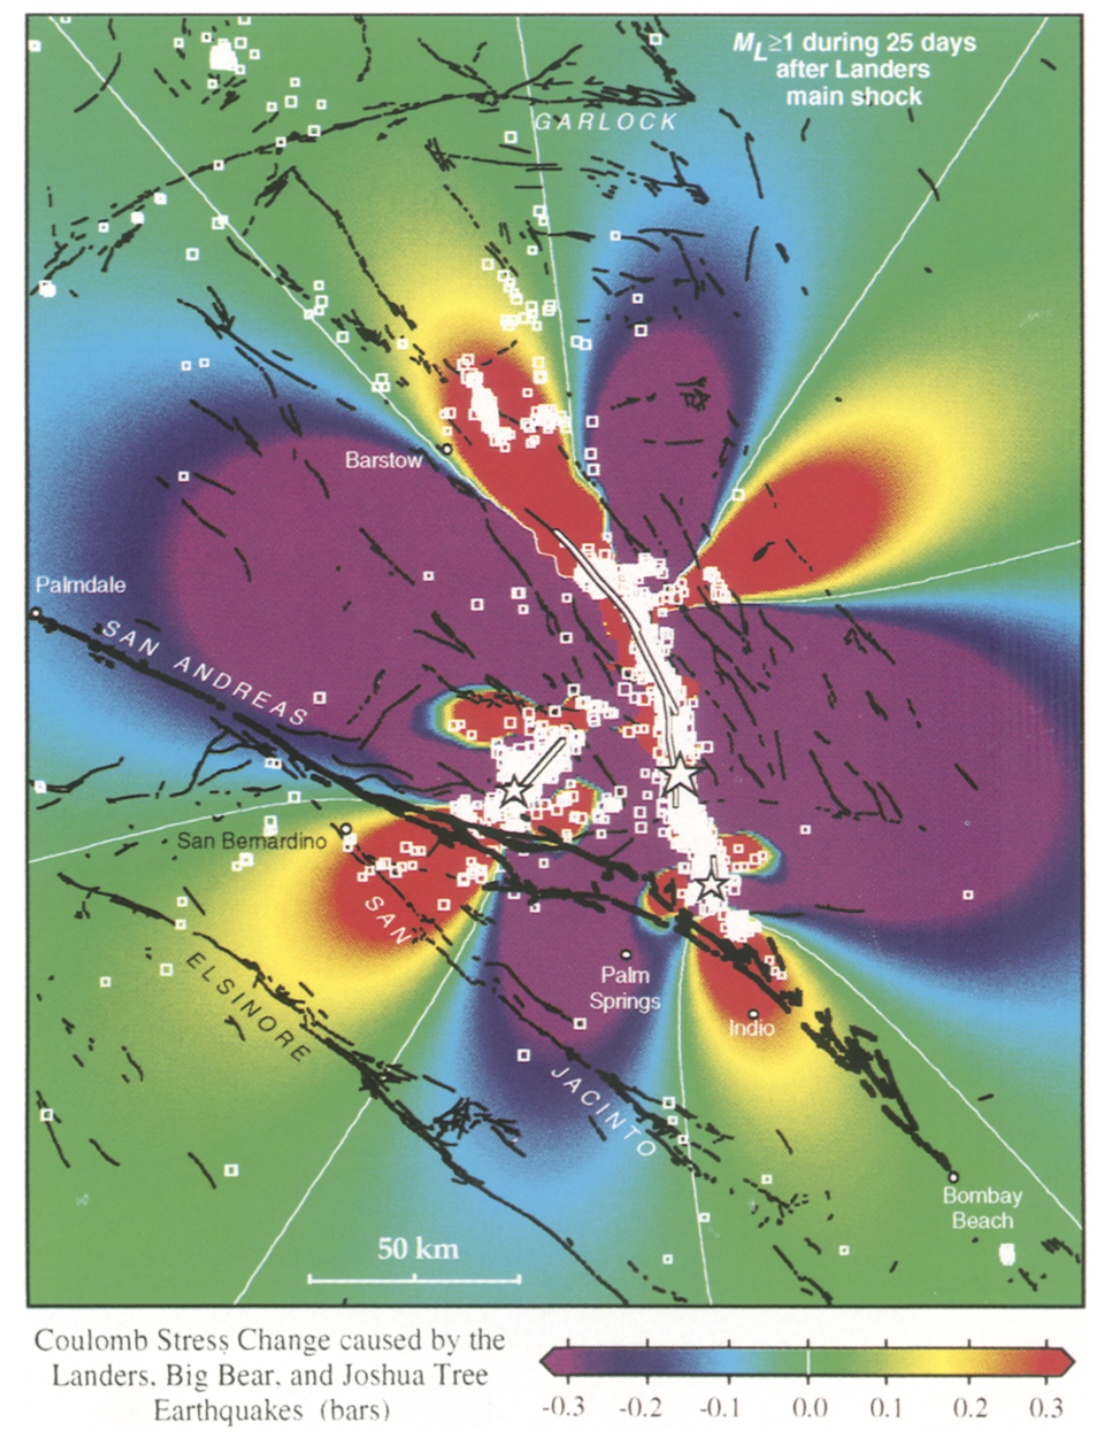
Figure 8. This startling figure shows that aftershocks preferentially occurred where the Coulomb stress was calculated to have risen (red zones) and are scarce where the Coulomb stress dropped (purple zones). Credit: King et al. (1994)

Alka Tripathy-Lang is a freelance science writer based in Chandler, Arizona, and holds a Ph.D. in geoscience.
Latest posts by Alka Tripathy-Lang, Ph.D. (see all)
- Living through the Loma Prieta earthquake - October 21, 2021
- The Great Quake Debate: an interview with seismologist and author Susan Hough - August 27, 2020
- Salton Sea Swarm quiets down - August 12, 2020