
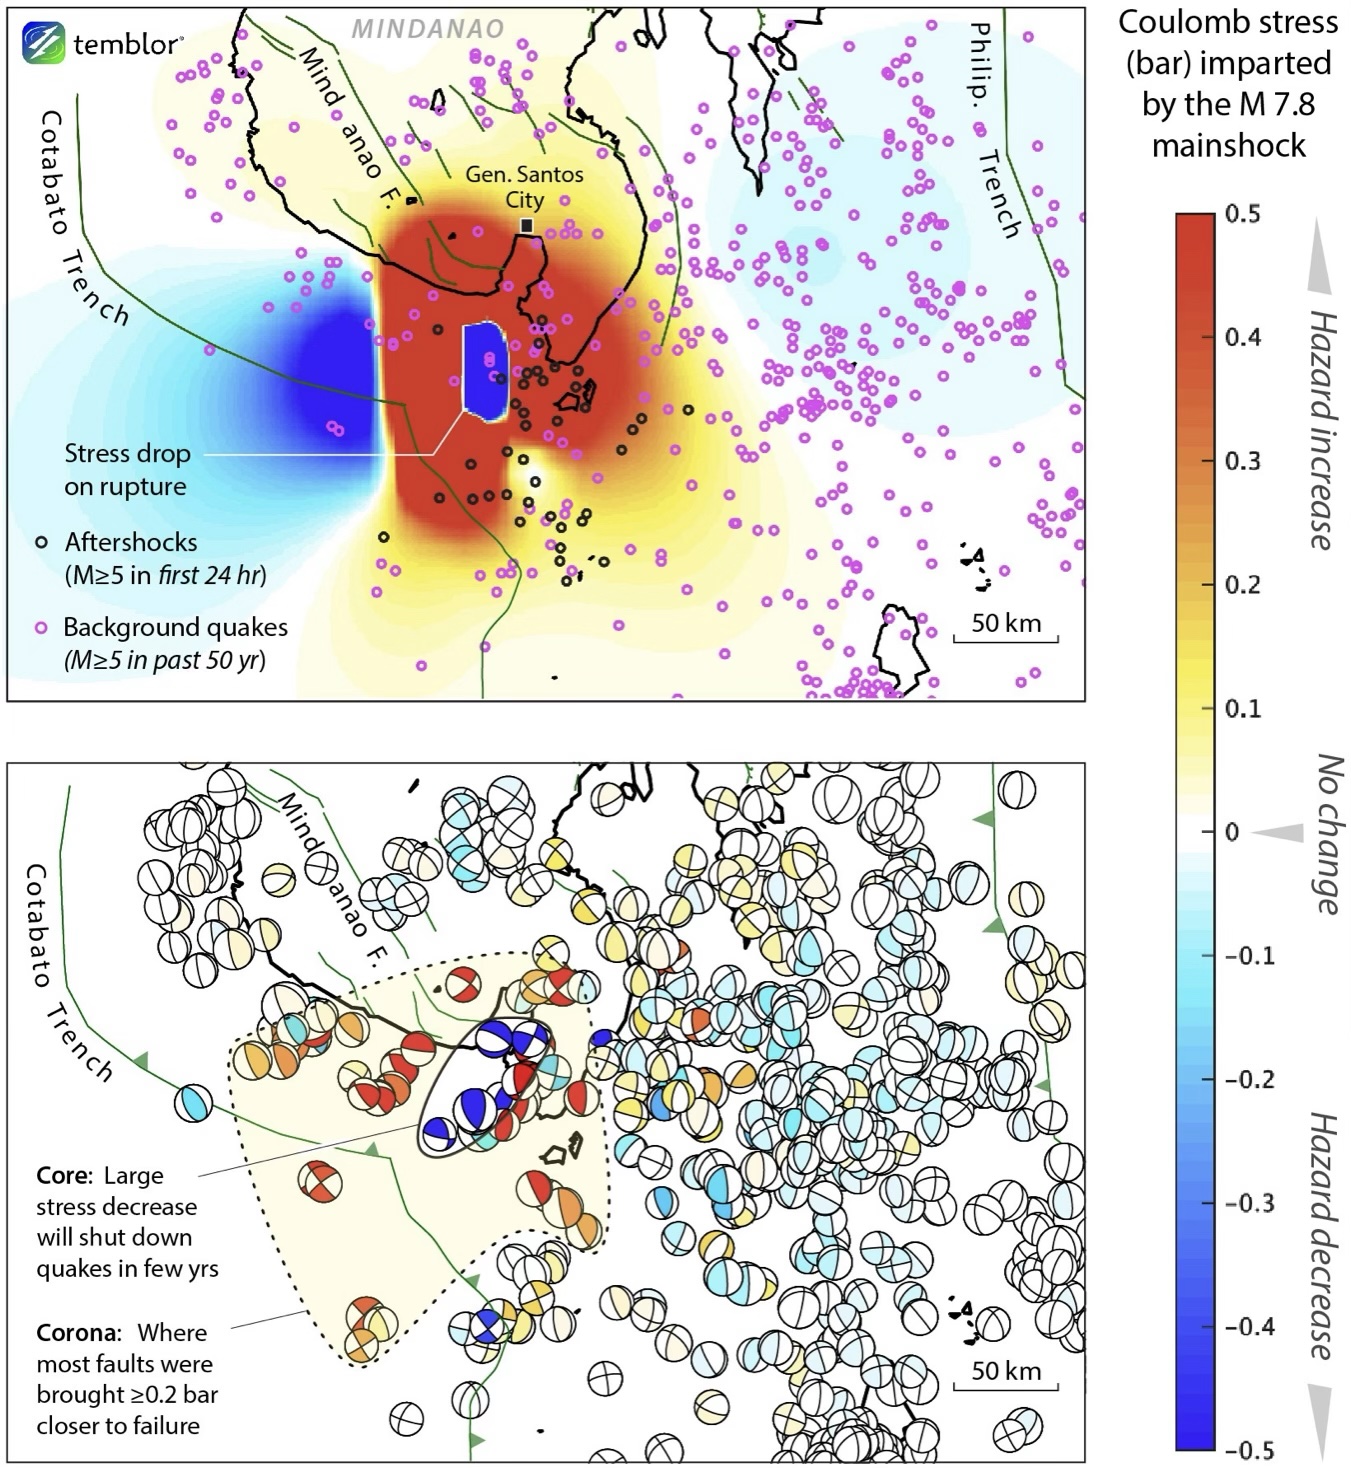
Figure 3. Two views of the stress imparted by the magnitude 7.8 mainshock to surrounding faults. In the top panel, the stress is resolved on planes parallel to (with the same strike, dip, and rake as) the mainshock rupture, based on its USGS finite fault model. There is a large (red) area on which the stress has increased. In the lower panel, the stress is resolved on the nodal planes of past earthquakes, a more realistic but less continuous visualization. The large areas of stress increase are different in the two panels. Both panels assume the fault friction coefficient is 0.4. We used the Global CMT catalog in both panels. The moment tensors (beachballs) are colored by the nodal plane most brought to failure, so the image is ‘red-biased.’ Calculation via Coulomb 4.0 (Yoshizawa et al., 2026) using the USGS finite fault model v1. Credit: Stein and Toda, 2026, CC BY-NC-ND 4.0

- Living through the Loma Prieta earthquake - October 21, 2021
- The Great Quake Debate: an interview with seismologist and author Susan Hough - August 27, 2020
- Salton Sea Swarm quiets down - August 12, 2020