By David Jacobson, Temblor
Last week, in a report published in Geophysical Research Letters, scientists from Lawrence Livermore and Lawrence Berkeley laboratories modeled ground shaking from a M=7.0 Hayward Fault earthquake in greater detail than ever before. Additionally, this is the highest resolution earthquake simulation ever done for Northern California. In Southern California, the Southern California Earthquake Center (SCEC) developed CyberShake, a physics-based seismic hazard model for all of Southern California. Principal investigator Artie Rodgers, seismologist at Lawrence Livermore Laboratory, told Temblor that while they are not working on CyberShake or with SCEC, they are working to “compute the most realistic, fully deterministic 3D ground motions for use in hazard, risk and building/structural response analysis.”

A ticking time bomb
For residents of the San Francisco East Bay, the greatest seismic hazard is the Hayward Fault. As this nearly 80 mile-long fault snakes its way from just east of San Jose to San Pablo Bay, where it transitions to the Rodgers Creek Fault, it cuts through the cities of Hayward, Fremont, Oakland and Berkeley. While the Hayward Fault may not have the notoriety of the San Andreas, it is part of the same larger fault system, and according to the USGS, has a greater chance of rupturing in a large earthquake by 2043. The USGS says there is a 33% chance the Hayward ruptures in a M=6.7+ earthquake by 2043, while the San Andreas has a 22% chance. This difference is mainly due to the fact that a large earthquake last occurred on the Hayward Fault in 1868, and because the interval between the last five major quakes is 140 years (This year is the 150th anniversary of the 1868 quake). Therefore, all residents of the East Bay must be aware of the hazard that lies below their feet.
The most detailed earthquake simulation in Northern California
In order to produce this simulation, the Lawrence Livermore scientists incorporated 3D geology and topography, and ran the simulation on a supercomputer for 18 hours. By taking into account the structures beneath the earth’s surface, greater representation of how seismic waves propagate could be achieved. By comparing their results to models based on actual recorded earthquakes, the team of scientists found that they were, on average, consistent. Dr. Rodgers told Temblor that “the good agreement with median ground motion prediction equations gives us confidence that the source, wave propagation and solver result in motions that are consistent with empirical data. This is important for acceptance by earthquake engineers.” Such acceptance is vital, and this simulation takes a great step forward in showing that computational models can generate realistic results. Kenneth Hudnut, Science Advisor for Risk Reduction and Research Geophysicist at the USGS told us in a phone conversation that, “what Artie has done is masterful work and pushed simulations for a Hayward Fault M 7.0 rupture to greater realism than ever before. People are getting better at these simulations and the engineers are recognizing this.”

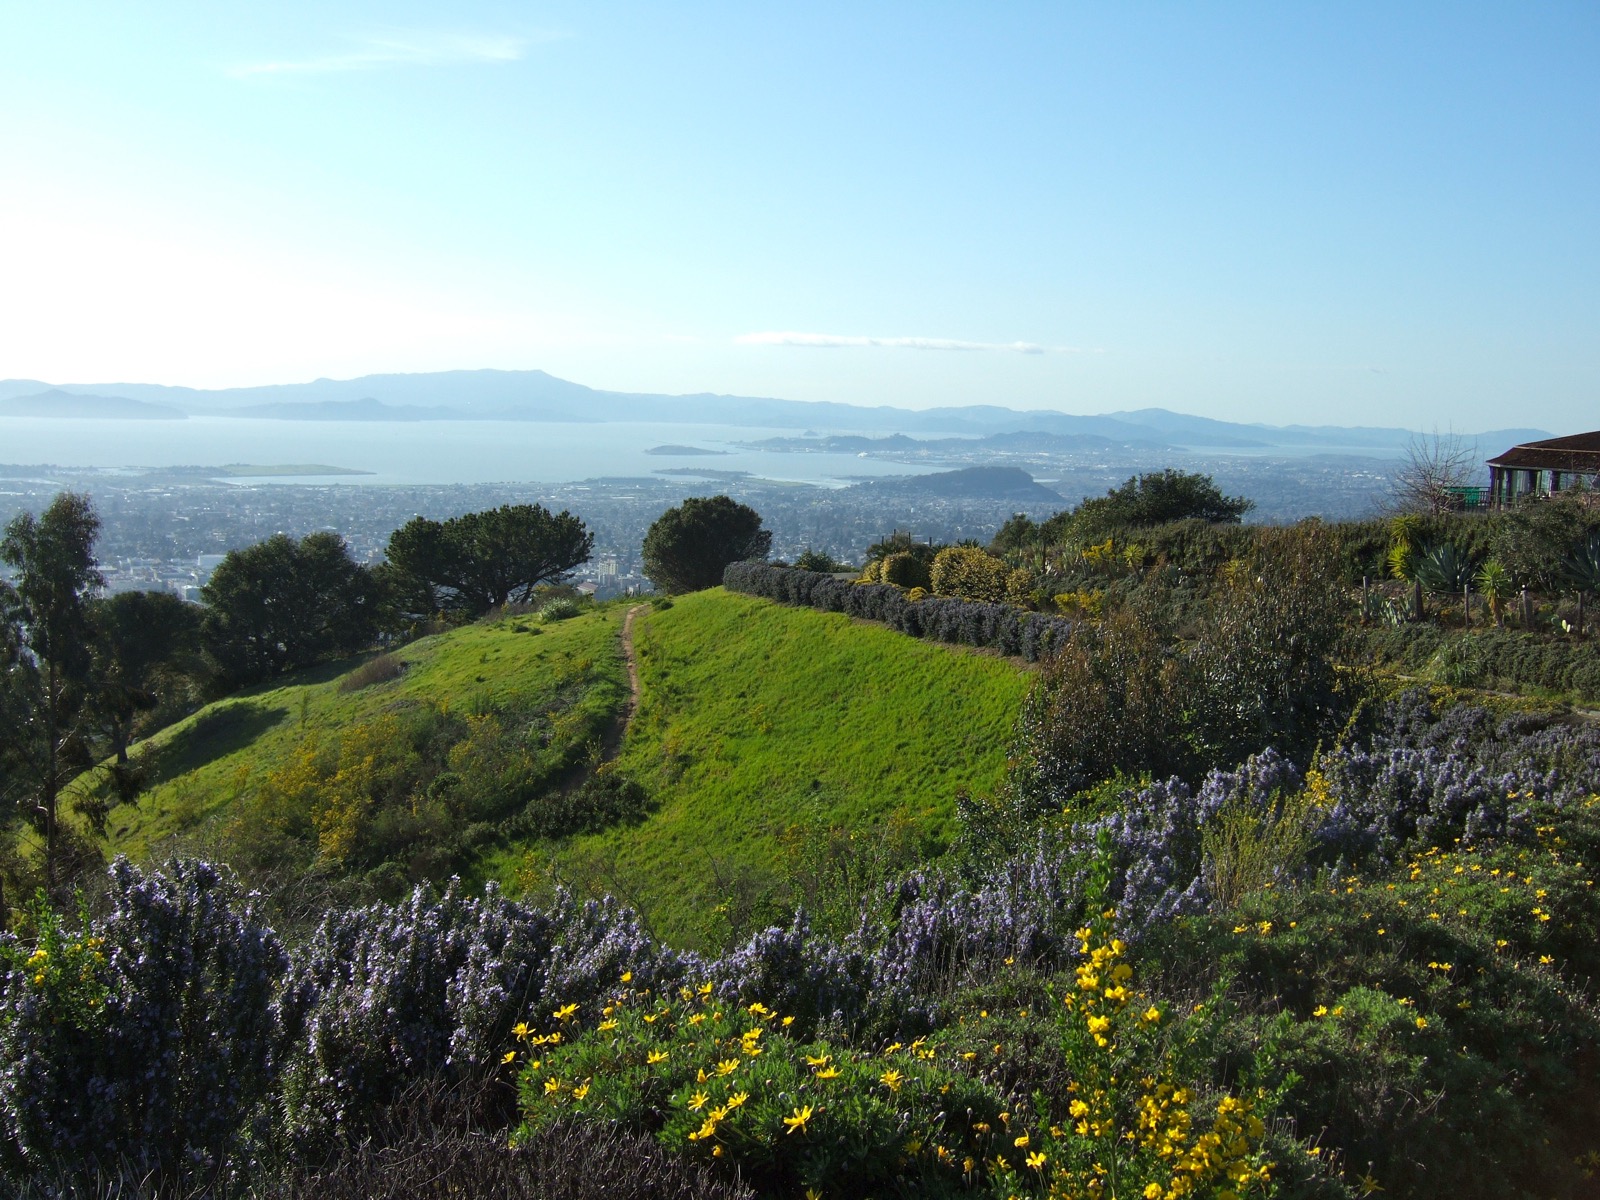
Greatest risk in the East Bay Hills
One of the major findings from this simulation is that east of the Hayward Fault, in the East Bay Hills, significantly higher ground motions were recorded, primarily due to the geology of the hills, which are comprised of weak sedimentary rocks. This should be of concern to residents of the area, as a major earthquake would cause significant damage to structures and lifelines, as well as major economic and social disruption. Furthermore, strong shaking within the steep topography of the East Bay Hills means landslides pose a threat to both people and property.
The video above, from the Lawrence Livermore Laboratory shows the simulated earthquake rupture along the Hayward Fault
Further study and preparation
Moving forward, the scientists will work to see how different type of rupture scenarios can generate different types of shaking. “We only ran one rupture realization with one hypocenter, so variations in slip distribution and hypocenter (controlling directivity) remain for further study. In fact, I am working on this now” Dr. Rodgers told us. Additionally, Dr. Hudnut added that, “everyone is excited about the prospect of using supercomputers to provide greater realism. What we lack are groundmotion recordings from large historic earthquakes. Instead, we have to piece together fragments of precious data from recent earthquakes, and use that in checking these simulations against reality.” All of this means that the simulations will only get better, including incorporating amplification and liquefaction effects. Regardless, for residents of the East Bay, especially those within the East Bay Hills, this study highlights how your location is critical to determining your hazard, as well as the need to understand how at risk you are. Only by doing this can you protect yourself from earthquakes that will happen one day.
References
Rodgers, A. J., Pitarka, A., Petersson, N. A., Sjögreen, B., & McCallen, D. B. (2018). Broadband (0–4 Hz) ground motions for a magnitude 7.0 Hayward fault earthquake with Three-Dimensional structure and topography. Geophysical Research Letters, 45. https://doi.org/10.1002/2017GL076505
Lawrence Livermore Laboratory
USGS
- Beware quiet segments of the Philippine Fault - May 16, 2025
-
ډیری عوامل افغاني ټولنې د زلزلې پر وړاندې زیانمنوي
- August 11, 2022 - What’s happening this week in Humboldt County, California: The squeeze - February 6, 2019