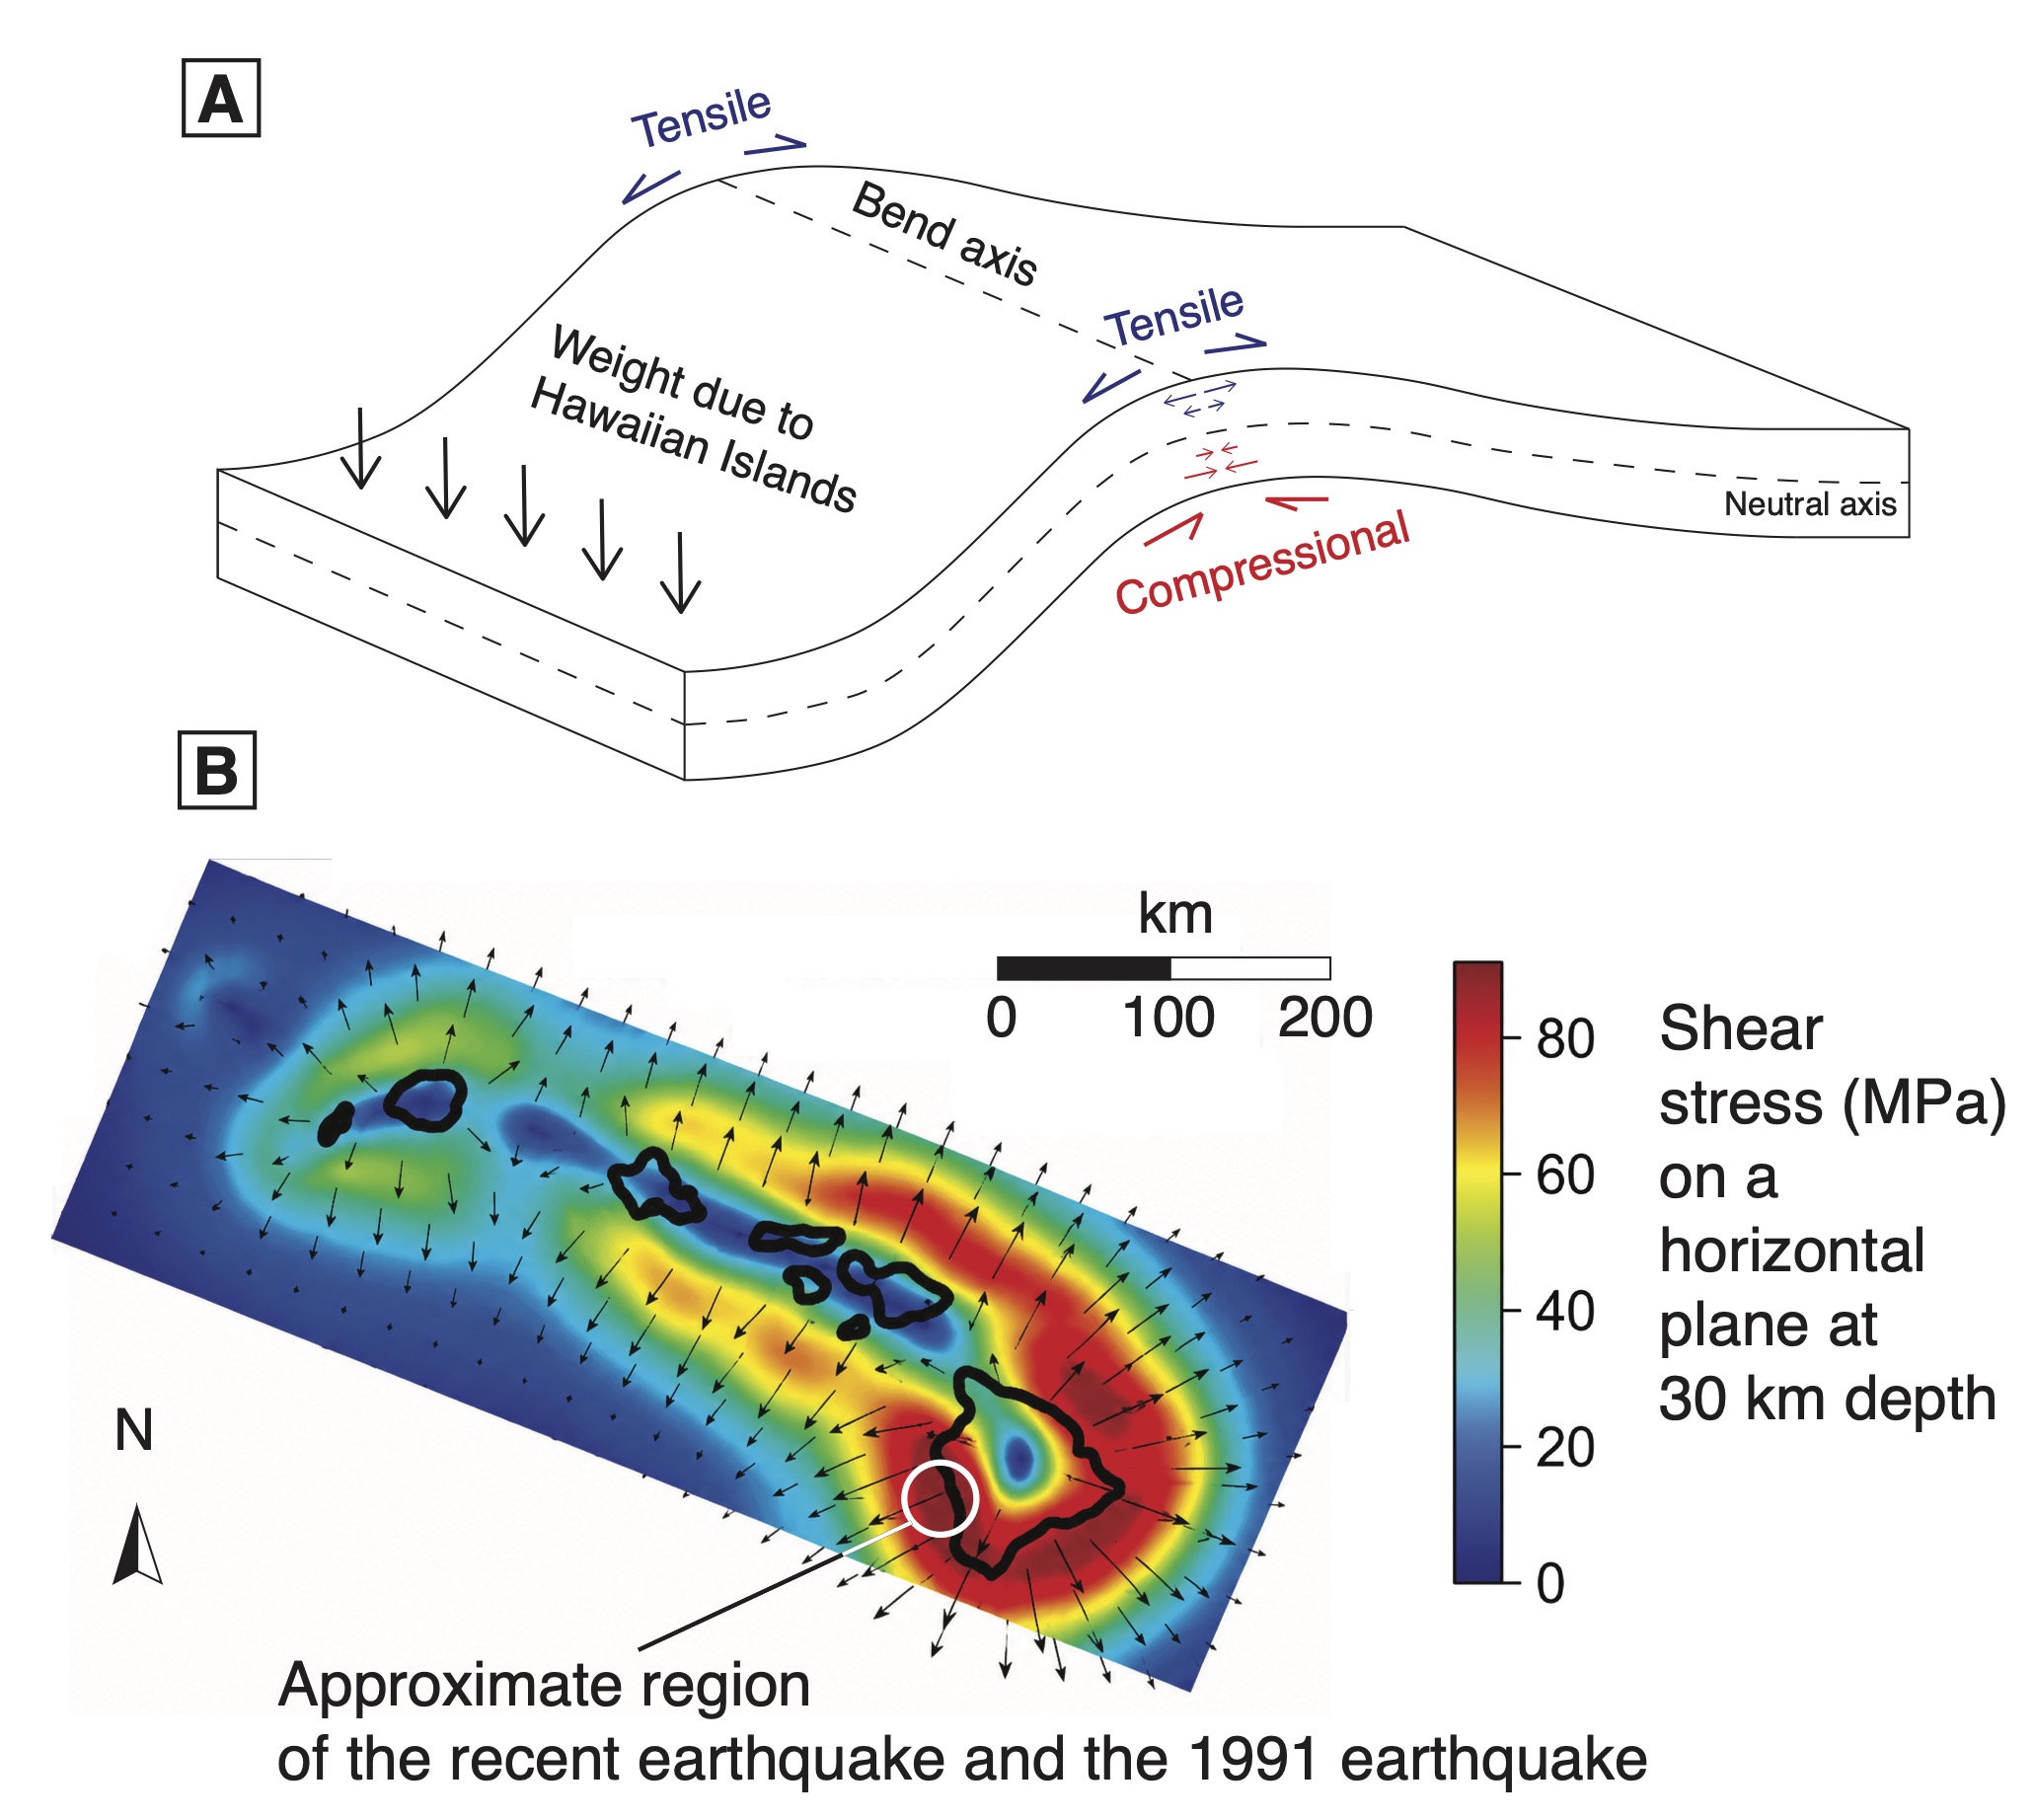
Figure 2. Schematic for flexure of elastic plate under loading (A) and modeled shear stress on a horizontal plane around the Hawaiian Islands (B). The plane is at a depth of 30 kilometers. Arrows show directions of shear tractions exerted by the upper block. The white circle denotes the general region of the recent magnitude 6.0 and 1991 magnitude 5.5 earthquakes. Figure B is modified and upscaled from Pritchard et al., 2006. Credit: Wang, 2026, CC BY-NC-ND 4.0
Latest posts by Rachel Crowell (see all)