DOST-PHIVOLCS scientists explore recent earthquake swarms off the shores of Mindanao, a southern Philippine island, and consider similarities to the devastating 1976 Moro Gulf earthquake.
By Deo Carlo E. Llamas, Robelyn Mangahas-Flores, Jonard Jhon S. Acid, John Patrick S. Naing, Department of Science and Technology, Philippine Institute of Volcanology and Seismology (DOST-PHIVOLCS)
Citation: Llamas, D.C.E., Mangahas-Flores, R., Acid, J.J.S., Naing, J.P.S., 2026, Are earthquake swarms along the Cotabato Trench echoes of a 1976 magnitude 8.1 quake?, Temblor, http://doi.org/10.32858/temblor.375
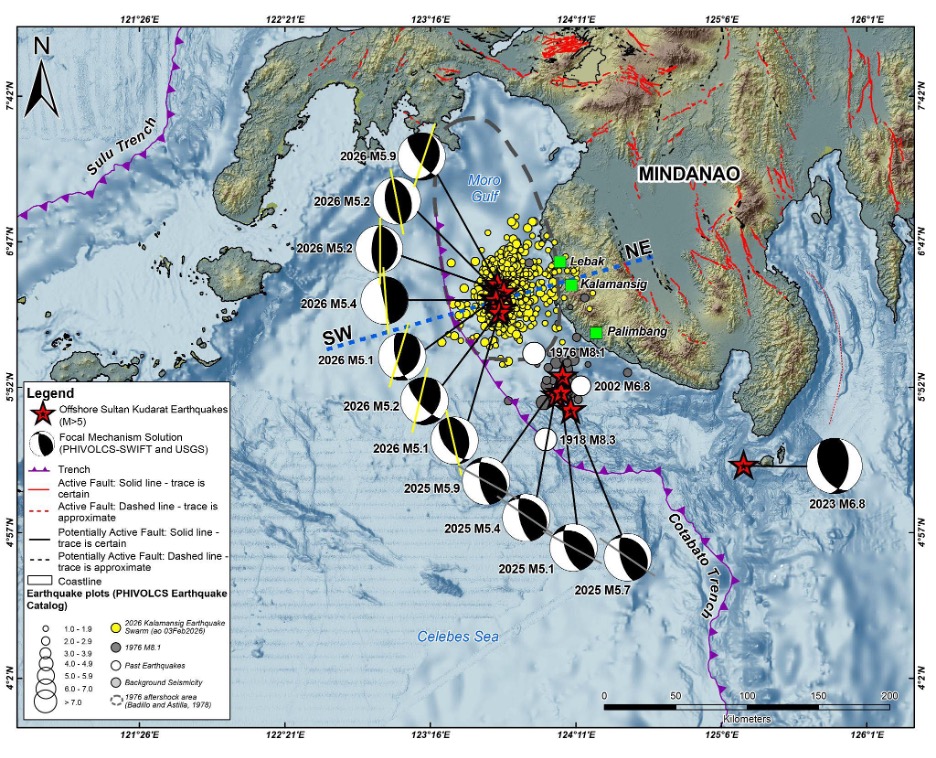
Since early January 20, 2026, a sequence of moderate earthquakes (ranging from magnitude 4.5 to 5.9) has been illuminating the Cotabato Trench. This trench lies west of the southern Philippine island of Mindanao, in the Celebes Sea (Figure 1). Scientists at DOST-PHIVOLCS are paying close attention because these earthquakes are occurring within the rupture zone of one of the country’s most destructive seismic events — the 1976 Moro Gulf earthquake.
But the seismic history of this trench stretches back even further.
In 1918, a magnitude 8.3 earthquake struck the region, widely interpreted to have ruptured a segment of the Cotabato Trench. Nearly six decades later, the 1976 magnitude 8.1 event ruptured northward of the 1918 earthquake, toward the Moro Gulf, and east of the trench’s trace. The Moro Gulf earthquake generated a devastating tsunami that claimed thousands of lives.
The recurrence of great earthquakes along this margin in 1918 and 1976 demonstrates that the Cotabato Trench is capable of producing multiple magnitude 8 and greater events. The spatial overlap between the 1976 rupture area and today’s earthquake swarm — named the Kalamansig earthquake swarm — raises the inevitable question: Is the trench waking up again?
When earthquakes come in clusters
First, we clarify what an earthquake swarm is, why such swarms happen, and where they often occur. In a typical mainshock–aftershock sequence, the largest earthquake is followed by numerous aftershocks that decay over time. Earthquake swarms do not exhibit a clear decaying trend in seismic activity (e.g., Miller, 2013; Mesimeri et al., 2023). Instead, an earthquake swarm is characterized by hundreds to thousands of small to moderate earthquakes occurring over a relatively short period (can be days to weeks) with the absence of a discernible mainshock.
Earthquake swarms are most commonly observed in volcanic regions where the movement of volatile hydrothermal fluids and ascending magma beneath the surface generates clustered seismic activity (e.g., Uhira et al., 2005; Li et al., 2021; Mesimeri et al., 2023; Florez et al., 2025). However, growing evidence shows that earthquake swarms are not confined to volcanic environments and can occur across a wide range of tectonic settings. These include subduction zones, where two tectonic plates converge and one slides downward beneath the other (e.g., Holtkamp & Brudzinski, 2011, 2014; Marsan & Socquet, 2023), rift systems in which two tectonic plates diverge from each other (e.g., Ruch et al., 2021), transform boundaries, where two tectonic plates slide past each other, (e.g., Roland et al., 2009), and intraplate or localized fault systems (e.g., Pierce Onos, 2020; Flores-Mangahas et al., 2023; Wang et al., 2024; Sevilla et al., 2025). In these non-volcanic contexts, earthquake swarms are commonly attributed to processes like fluid migration within fault zones (e.g., Hainzl, 2004; Nakajima, 2023; Yoshida et al., 2023), aseismic slip (e.g., Llenos et al., 2009; Lengliné et al., 2012; Fasola et al., 2019), stress transfer (e.g., Im & Avouac, 2023), and, in some cases, anthropogenic influences (e.g., Orlecka-Sikora et al., 2023).
Two swarms
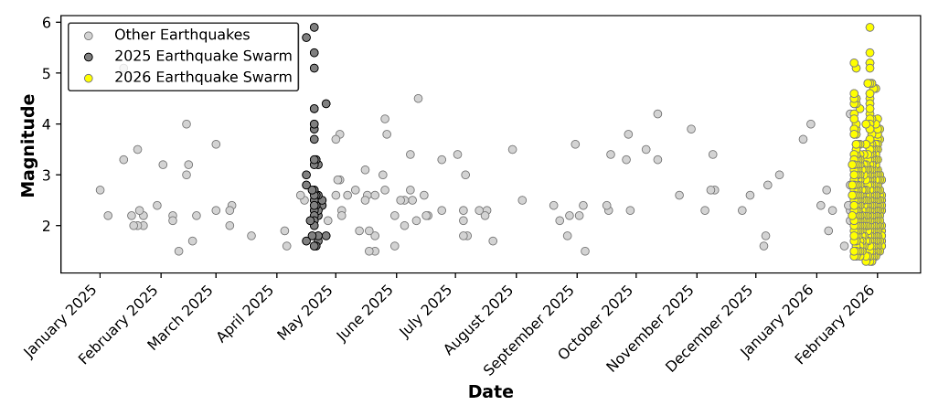
This is not the first time in recent years that the Cotabato Trench has shown heightened activity. In April 2025, an earthquake swarm occurred offshore, west of Palimbang, Sultan Kudarat, located south of the 2026 Kalamansig earthquake swarm (Figure 2). The 2025 Palimbang earthquake swarm began with a magnitude 5.7 earthquake on April 16, 2025. Four days later, on April 20, 2025, three moderate earthquakes with magnitudes 5.9, 5.4, and 5.1 occurred north of the magnitude 5.7 epicenter, marking the peak of seismic activity. The swarm persisted for nearly eight days before starting to dissipate on April 24, 2025 (Figure 3).
Eighteen months later, a similar set of events occurred north of the 2025 Palimbang earthquake swarm, west of Kalamansig, Sultan Kudarat, in January 2026 (Figure 1 and 2). The 2026 Kalamansig earthquake swarm began with smaller earthquakes ranging from magnitude 2.1 to 4.2 between January 16 to 19. On January 20, 2026, seismic activity increased sharply with the occurrence of a magnitude 4.2 and a magnitude 5.2 earthquakes, followed by a magnitude 5.1 earthquake the next day.
The swarm entered its peak on January 28, 2026, when six moderate earthquakes with magnitudes of 5.4, 5.1, 5.2, 5.9, 5.2, and 5.2 occurred in that order (Figure 2). These moderate earthquakes were followed by numerous small earthquakes. As of February 8, 2026, more than 3,500 earthquakes had been recorded, with magnitudes ranging from 1.3 to 5.9. Interestingly, Hubbard and Bradley (2026) hypothesized that the 2026 Kalamansig earthquake swarm occurred in two pulses: the first beginning on January 19, 2026 and the second on January 28, 2026.
Both the 2025 and 2026 offshore earthquake swarms that occurred in the vicinity of the Cotabato Trench were felt along the western coast of Mindanao. Both earthquake swarms resulted in maximum reported and instrumentally recorded ground shaking reaching Intensity V (Strong) on the PHIVOLCS Earthquake Intensity Scale (PEIS).
The focal mechanism solutions indicate that both swarms are characterized by reverse faulting — a type of movement expected in a subduction zone where one tectonic plate is pushing beneath another. This movement may be taking place either along the main subduction interface itself or on smaller reverse faults that branch upward into the overlying plate.
When focal mechanism solutions are examined more closely, a key difference emerges. The 2025 earthquakes show east-dipping fault planes trending mostly northwest–southeast, whereas the 2026 earthquakes are characterized by east-dipping planes trending more north–south. This change in orientation suggests that the two swarms are not simply repeating activity on the same structure. Instead, they likely represent the activation of different segments of the trench or distinct splay faults branching from the megathrust into the overriding plate. Segmentation is a common feature of subduction zones and plays a major role in controlling where and how large earthquakes occur.
How much strain has built up?
Geodetic measurements provide further context. Plate convergence along the Cotabato Trench has been estimated at about 2.5 centimeters per year (Ohkura et al., 2015). If we assume full coupling (i.e., the plates are fully locked, or stuck), this rate translates into an annual slip deficit of 25 millimeters. Over a century, that would amount to approximately 2.5 meters of accumulated strain. The 1976 magnitude 8.1 earthquake is estimated to have released about 3 meters of slip on the megathrust (Beck and Ruff, 1985). Under a simple strain-accumulation model, this implies a recurrence interval of roughly 120 years for a full-segment rupture — longer than the 58-year gap between the 1918 and 1976 great earthquakes.
This discrepancy can be explained in two ways. One possibility is that convergence or coupling is locally higher than the regional average, allowing strain to accumulate more rapidly in certain patches. Another, and perhaps more compelling explanation, is that the two great earthquakes ruptured different segments of the trench. The 1918 magnitude 8.3 earthquake likely ruptured a southern segment of the trench, whereas the 1976 magnitude 8.1 earthquake ruptured a more northerly segment toward the Moro Gulf. Historical and seismological analyses support the second explanation, reinforcing the idea that the Cotabato Trench behaves as a multi-segment system, rather than a single, uniform fault.
Shallow earthquakes
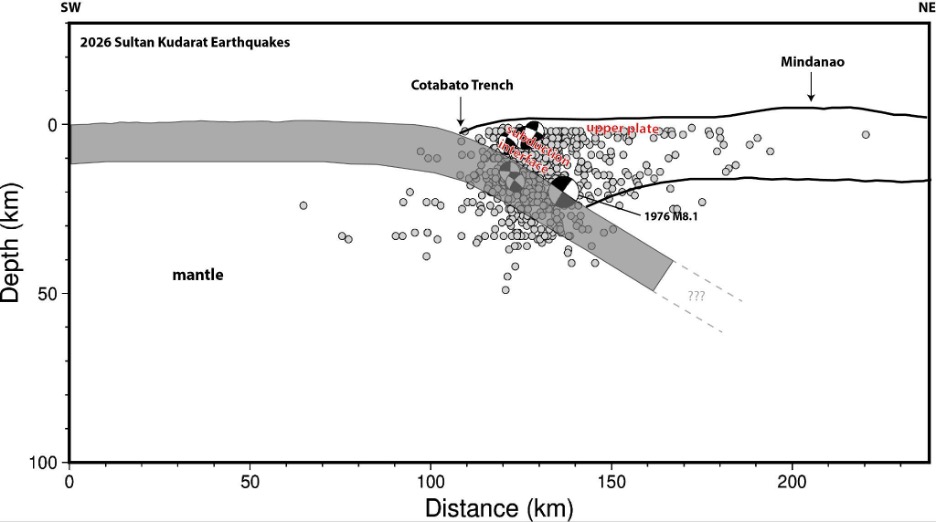
One striking feature of the ongoing 2026 swarm is its shallow depth. Rather than occurring directly on the megathrust, most of these earthquakes likely involve upper-plate crustal fault splays above the subduction interface (Figure 3). Such splays can be reactivated by stress transfer from deeper structures or, in some cases, can themselves influence stress conditions on the megathrust below.
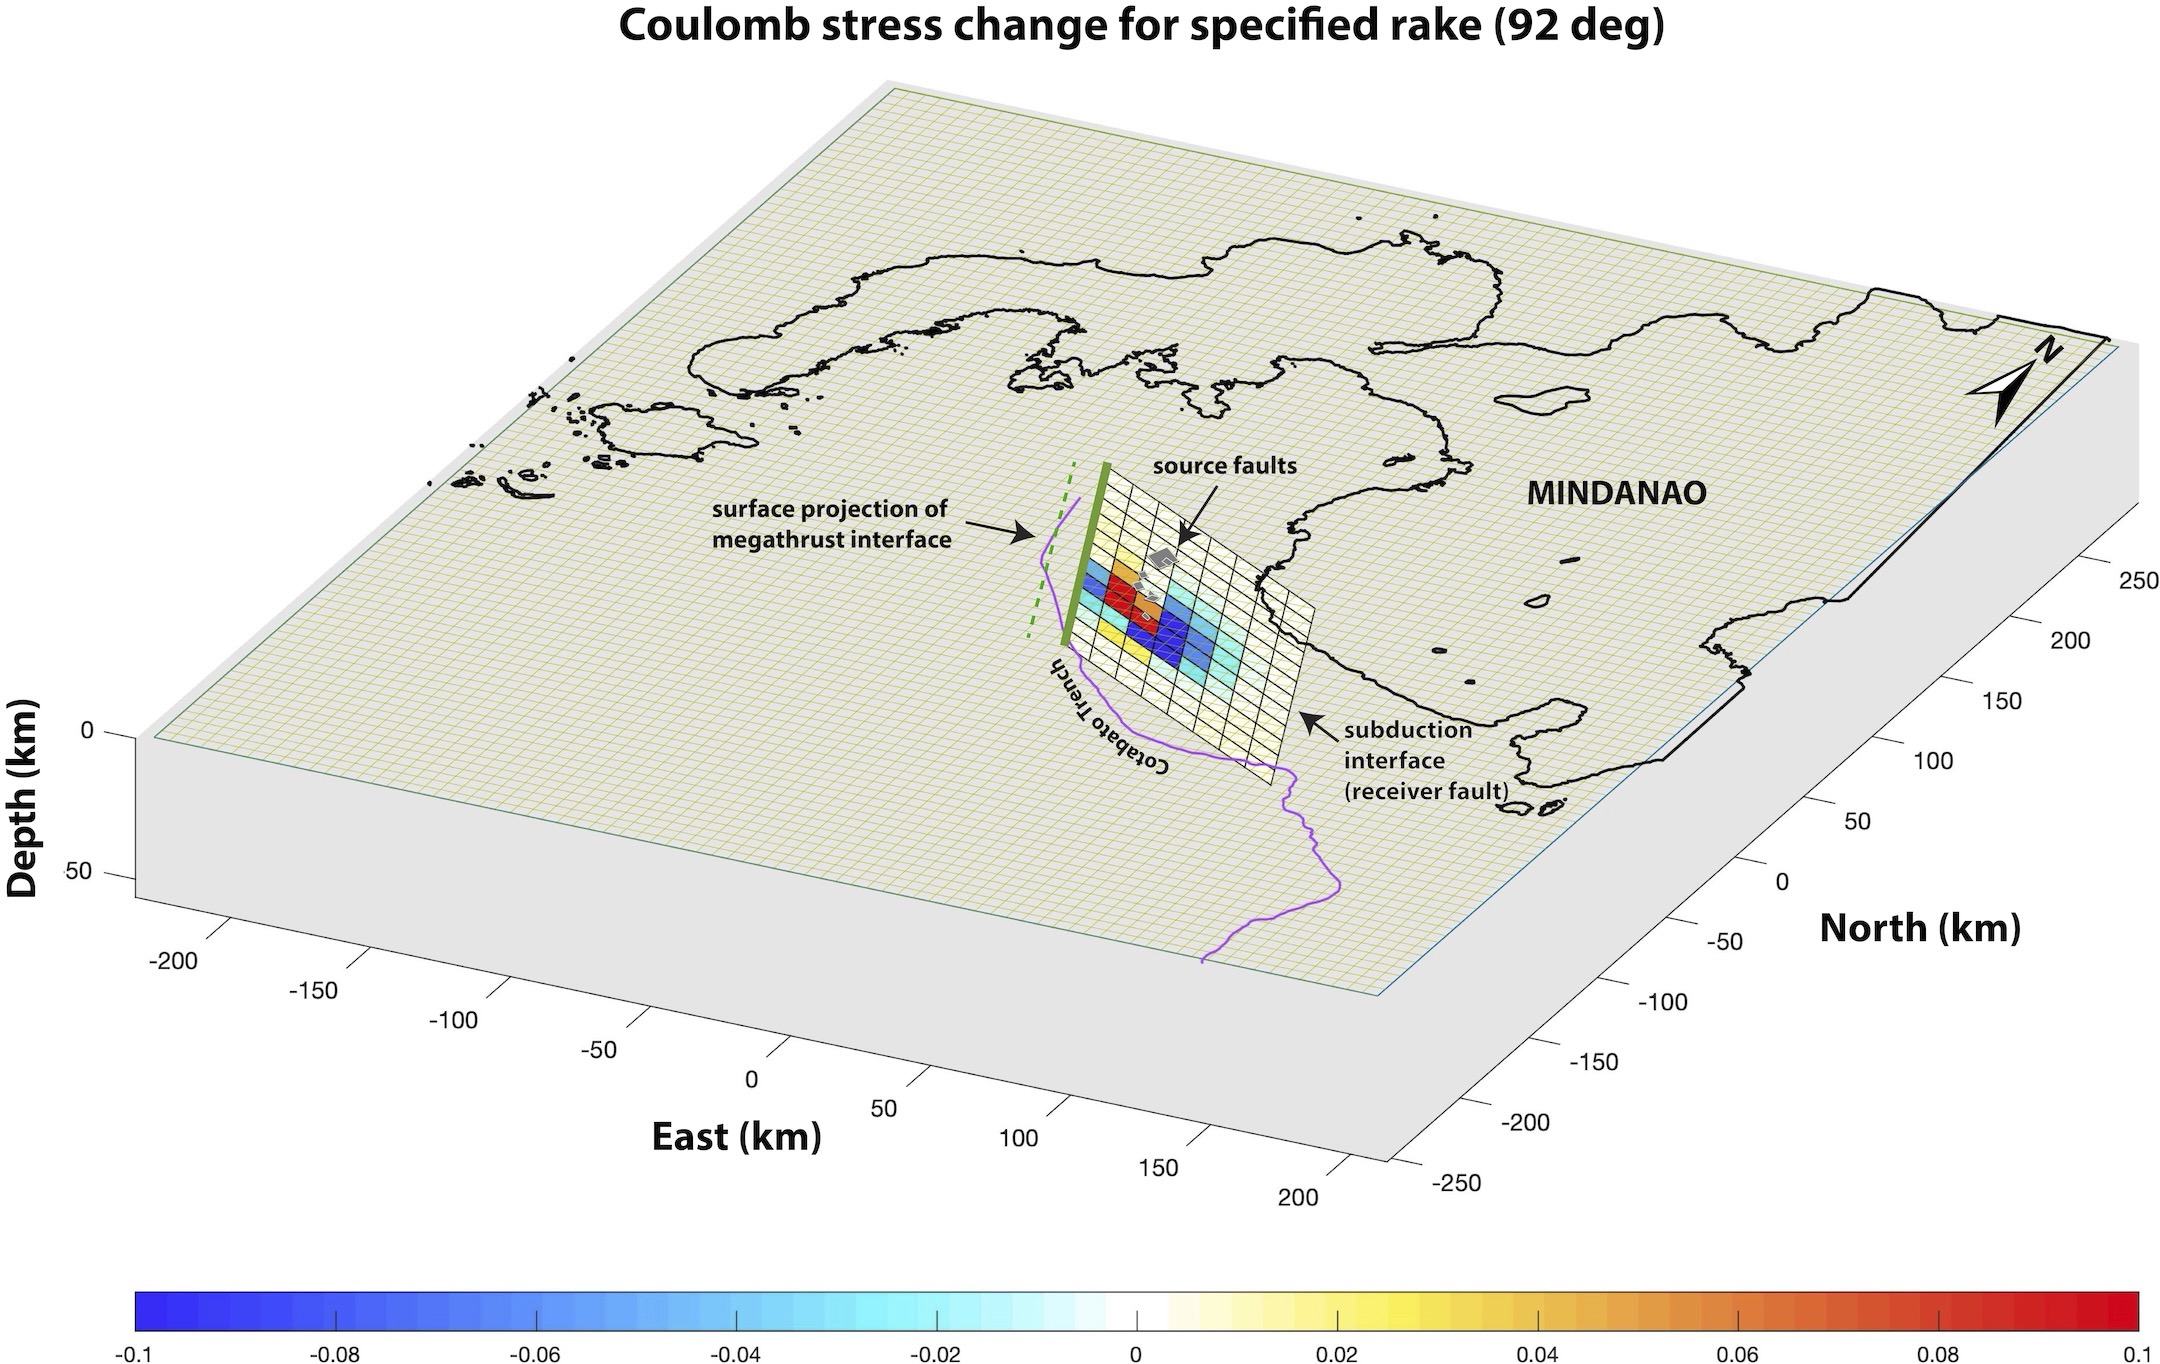
To explore this interaction, we conducted Coulomb stress modeling, using the 1976 magnitude 8.1 earthquake parameters to constrain the geometry of the subduction interface. The results show that the current swarm occurs above the modeled megathrust, and the stress changes from this shallow faulting increase Coulomb stress on the subduction interface by about 0.3 to 0.4 bars (Figure 4).
In tectonic terms, this is not negligible. This stress change is not sufficient to trigger a great earthquake on its own, but if parts of the megathrust are already close to failure, even modest stress increases can advance the timing of rupture. In other words, shallow crustal earthquakes can subtly load the deeper megathrust.
Tsunami hazard potential
The 1976 magnitude 8.1 earthquake produced tsunamis with maximum wave heights of 9 meters in the municipality of Lebak in Sultan Kudarat Province, as reported by residents (Badillo and Astilla, 1978). Sea level was observed to have receded after the earthquake, followed by the arrival of three to four waves (Bautista et al., 2012). Deaths due to the tsunami were reported to be around 3,000 to 8,000 (Stratta et al, 1977; Acharya, 1978; Badillo and Astilla, 1978).
The August 15, 1918 earthquake also produced tsunamis with wave heights of 8 meters affecting the provinces of Sultan Kudarat and Sarangani. Combined, these past tsunamis highlight the likelihood of tsunamigenic earthquakes along the Cotabato Trench.
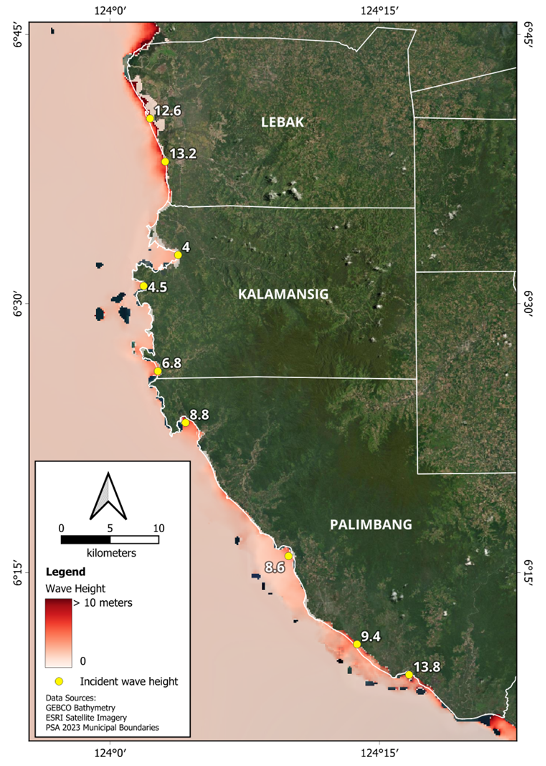
To explore the prospect of future tsunamis, we used tsunamigenic earthquake models. In these models, we simulate six megathrust rupture scenarios using simplified fault geometry for a magnitude 8.4 earthquake based on bathymetry, seismicity (PHIVOLCS, 2025), and slab geometry (Hayes et al., 2018). In each scenario, we modified the parameters for slip, dip, and rake.
Based on the maximum wave height produced by the worst-case rupture scenario (Figure 5), movement along the Cotabato Trench has the potential of generating tsunamis with wave heights exceeding 9 meters for the municipalities of Lebak, Kalamansig, and Palimbang. Minimum arrival times are estimated at 3 to 5 minutes at the coast of Kalamansig.
What we’ve learned
It is important to emphasize that earthquake swarms do not automatically signal an imminent great earthquake. However, the location, depth, and stress interactions of the current Cotabato Trench swarm highlight several key points:
● The trench is actively deforming, even decades after a major rupture.
● Different segments can activate independently, producing distinct earthquake sequences.
● Shallow crustal faulting can subtly load the megathrust, potentially influencing long-term seismic behavior.
The Cotabato Trench may not be repeating 1976, but it is clearly reminding us that it remains a dynamic and potentially hazardous plate boundary.
For a region with a tragic history of earthquake-generated tsunamis, these observations underscore the need for continuous monitoring, updated seismic and tsunami hazard assessments, and community preparedness along the southern Philippine coast.
Predicting the exact time, location, and magnitude of a major earthquake remains beyond the capability of current science. Because earthquakes cannot be predicted with precision, preparedness and early warning are our strongest tools for reducing disaster risk. In response, DOST-PHIVOLCS continuously monitors earthquakes and tsunamis through a network of seismic stations around the country, along with sea-level and tsunami detection instruments. This real-time monitoring allows authorities to rapidly assess hazards and issue timely advisories to at-risk communities.
Through collaboration with the Japan International Cooperation Agency (JICA), DOST-PHIVOLCS has strengthened tsunami early warning capacity by installing a tsunami monitoring station in Kalamansig, Sultan Kudarat. This facility enhances our ability to detect abnormal sea-level changes and provide faster warnings to tsunami-prone communities along the western coast of Mindanao.
However, technology alone is not enough. Community awareness saves lives.
The public is strongly encouraged to remember the natural warning signs of a local tsunami:
SHAKE – A strong earthquake.
DROP – A sudden and unusual sea-level drop after the earthquake.
ROAR – A loud, unusual roaring sound from the sea.
If you experience any of these signs, do not wait for an official warning. Move immediately to higher ground or inland. In near-source tsunamis, waves can arrive within minutes.
Preparedness, early action, and informed communities are our best defense against earthquake and tsunami hazards.
References
Acharya, H.K. (1978). Mindanao Earthquake of August 16, 1976: Preliminary Seismological Assessment. Bulletin of the Seismological Society of America. 68, 1459–1468.
Badillo, V.L., Astilla, Z.C. (1978). Moro Gulf Tsunami of 17 August 1976. Manila Observatory, Quezon City, Philippines.
Bautista, M.L.P., Bautista, B.C., Salcedo, J.C., Narag, I.C. (2012). Philippine Tsunamis and Seiches (1589 to 2012): A Catalogue of Tsunami Events in the Philippines. Philippine Institute of Volcanology and Seismology, Quezon City, Philippines.
Bonita, J., Narag, I., & Philippine Institute of Volcanology and Seismology. (2025). DOST-PHIVOLCS Centroid Moment Tensor Catalog [Data set]. DOST-PHIVOLCS. https://doi.org/10.5281/zenodo.15370288
Fasola, S. L., Brudzinski, M. R., Holtkamp, S. G., Graham, S. E., & Cabral-Cano, E. (2019). Earthquake swarms and slow slip on a sliver fault in the Mexican subduction zone. Proceedings of the National Academy of Sciences, 116(15), 7198-7206.
Florez, M. A., Li, B. Q., Shelly, D. R., Angulo, M. V., & Sanabria-Gómez, J. D. (2025). Long-term dynamics of earthquake swarms in the Yellowstone caldera. Science Advances, 11(29), eadv6484.
Gutenberg, B., & Richter, C. F. (1944). Frequency of earthquakes in California. Bulletin of the Seismological Society of America, 34(4), 185–188.
Hayes, G. P., Moore, G. L., Portner, D. E., Hearne, M., Flamme, H., Furtney, M., & Smoczyk, G. M. (2018). Slab2, a comprehensive subduction zone geometry model. Science, 362(6410), 58-61.
Holtkamp, S. G., & Brudzinski, M. R. (2011). Earthquake swarms in circum-Pacific subduction zones. Earth and Planetary Science Letters, 305(1-2), 215-225.
Holtkamp, S., & Brudzinski, M. R. (2014). Megathrust earthquake swarms indicate frictional changes which delimit large earthquake ruptures. Earth and Planetary Science Letters, 390, 234-243.
Im, K., & Avouac, J. P. (2023). Cascading foreshocks, aftershocks and earthquake swarms in a discrete fault network. Geophysical Journal International, 235(1), 831-852.
Lengliné, O., Elkhoury, J. E., Daniel, G., Schmittbuhl, J., Toussaint, R., Ampuero, J. P., & Bouchon, M. (2012). Interplay of seismic and aseismic deformations during earthquake swarms: An experimental approach. Earth and Planetary Science Letters, 331, 215-223.
Li, B. Q., Smith, J. D., & Ross, Z. E. (2021). Basal nucleation and the prevalence of ascending swarms in Long Valley caldera. Science Advances, 7(35), eabi8368.
Llenos, A. L., McGuire, J. J., & Ogata, Y. (2009). Modeling seismic swarms triggered by aseismic transients. Earth and Planetary Science Letters, 281(1-2), 59-69.
Hainzl, S. (2004). Seismicity patterns of earthquake swarms due to fluid intrusion and stress triggering. Geophysical Journal International, 159(3), 1090-1096.
Marsan, D., Reverso, T., & Socquet, A. (2023). Earthquake swarms along the Chilean subduction zone, 2003–2020. Geophysical Journal International, 235(3), 2758-2777.
Mesimeri, M., Passarelli, L., Cesca, S., Maccaferri, F., & Lanza, F. (2023). Earthquake swarms and complex seismic sequences in tectonic and volcanic areas. Frontiers in Earth Science, 11, 1295920.
Miller, S. A. (2013). The role of fluids in tectonic and earthquake processes. Advances in geophysics, 54, 1-46.
Nakajima, J., & Hasegawa, A. (2023). Prevalence of repeating earthquakes in the continental crust and subducting slabs: triggering of earthquakes by aseismic slip. Journal of Geophysical Research: Solid Earth, 128(2), e2022JB024667.
Ohkura, T., Tabei, T., Kimata, F., Bacolcol, T. C., Nakamura, Y., Luis, A. C., Jr., Pelicano, A., Jorgio, R., Tabigue, M., Abrahan, M., Jorgio, E., & Gunawan, E. (2015). Plate convergence and block motions in Mindanao Island, Philippine as derived from campaign GPS observations. Journal of Disaster Research, 10(1), 59–66. https://doi.org/10.20965/jdr.2015.p0059
Orlecka-Sikora, B., Rudziński, Ł., Staszek, M., Lizurek, G., & Mizerski, K. (2023). Seismic swarms as intermittent quasi-static ruptures driven by pore pressure variations due to the water reservoir impoundment. Tectonophysics, 863, 230005.
Pierce Onos, J. 2020, Imaging from 22,000 small earthquakes reveals fault zone intricacies, Temblor, http://doi.org/10.32858/temblor.099
Roland, E., & McGuire, J. J. (2009). Earthquake swarms on transform faults. Geophysical Journal International, 178(3), 1677-1690.
Ruch, J., Keir, D., Passarelli, L., Di Giacomo, D., Ogubazghi, G., & Jónsson, S. (2021). Revealing 60 years of earthquake swarms in the southern Red Sea, Afar and the Gulf of Aden. Frontiers in Earth Science, 9, 664673.
Scholz, C. H. (1968). The frequency-magnitude relation of microfracturing in rock and its relation to earthquakes. Bulletin of the seismological society of America, 58(1), 399-415.
Scholz, C. H. (2015). On the stress dependence of the earthquake b value. Geophysical Research Letters, 42(5), 1399–1402. https://doi.org/10.1002/2014GL062863
Stratta, J.L., Canon, T.J., Duke, C.M., Selna, L.G., Haas, J.E., Leeds, D.J. (1977). Reconnaissance Report Mindanao, Philippines Earthquake August 17, 1976.
Uhira, K., Baba, T., Mori, H. et al. Earthquake swarms preceding the 2000 eruption of Miyakejima volcano, Japan. Bull Volcanol 67, 219–230 (2005). https://doi.org/10.1007/s00445-004-0405-3
Wiemer, S., & McNutt, S. R. (1997). Variations in the frequency–magnitude distribution with depth in two volcanic areas. Geophysical Research Letters, 24(2), 189–192. https://doi.org/10.1029/96GL03779
Wiemer, S., & Wyss, M. (2002). Mapping spatial variability of the frequency-magnitude distribution of earthquakes. In Advances in geophysics (Vol. 45, pp. 259-V). Elsevier.
Yellowstone Volcano Observatory & Shelly, D. (2019, November 11). *What is an earthquake swarm?* U.S. Geological Survey. [https://www.usgs.gov/news/what-earthquake-swarm](https://www.usgs.gov/news/what-earthquake-swarm) ([USGS][1])
Copyright
Text © 2026 Temblor. CC BY-NC-ND 4.0
We publish our work — articles and maps made by Temblor — under a Creative Commons Attribution-NonCommercial-NoDerivatives 4.0 International (CC BY-NC-ND 4.0) license.
For more information, please see our Republishing Guidelines or reach out to news@temblor.net with any questions.
- Venezuela’s doublet leaned toward Caracas - June 30, 2026
- Is Southern California’s Cajon Pass an ‘earthquake gate’ ready to open? - June 29, 2026
- Philippines magnitude 7.8 shock may have loaded the central Cotabato subduction zone - June 11, 2026