
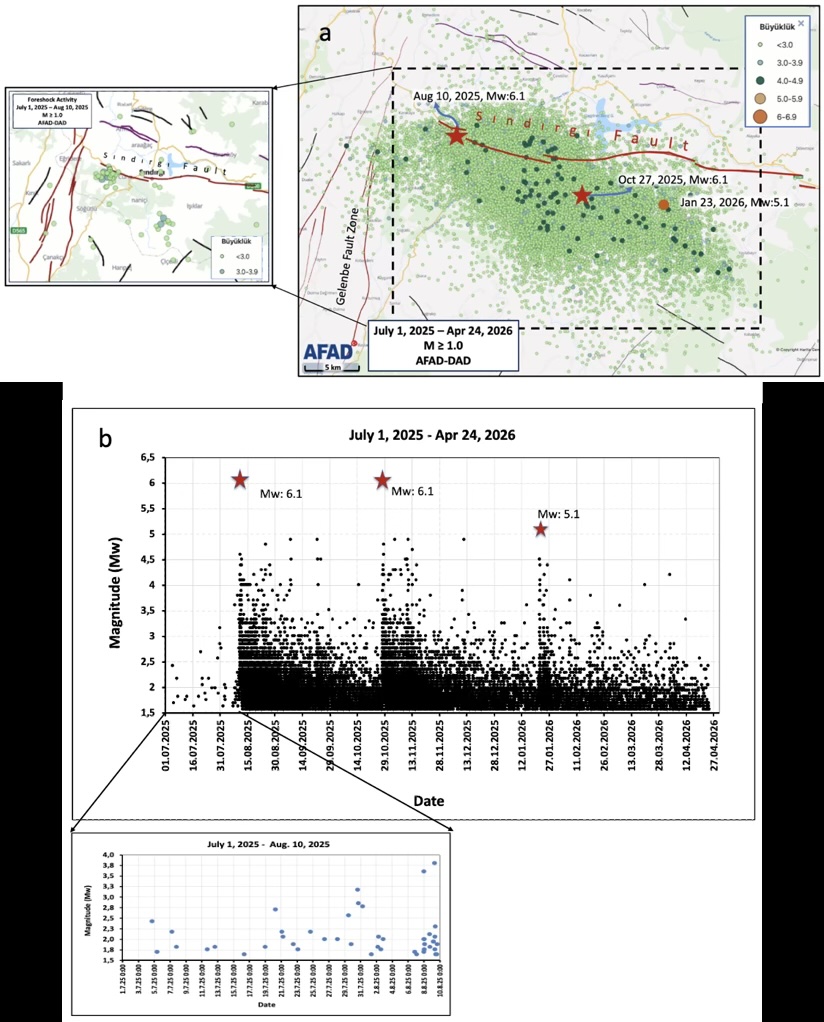
Figure 2. (a) This map shows the location of epicenters for seismic activity around the Sındırgı Fault between July 1, 2025, and April 24, 2026. The inset shows the spatial distribution of foreshock activity. b) This plot shows the magnitude of shocks over time. The inset shows the temporal variation of foreshock activity. Earthquake data were obtained from AFAD-DAD (2025b). Credit: Eyidoğan, 2026, CC BY-NC-ND 4.0

Figure 2. (a) This map shows the location of epicenters for seismic activity around the Sındırgı Fault between July 1, 2025, and April 24, 2026. The inset shows the spatial distribution of foreshock activity. b) This plot shows the magnitude of shocks over time. The inset shows the temporal variation of foreshock activity. Earthquake data were obtained from AFAD-DAD (2025b). Credit: Eyidoğan, 2026, CC BY-NC-ND 4.0

Figure 2. (a) This map shows the location of epicenters for seismic activity around the Sındırgı Fault between July 1, 2025, and April 24, 2026. The inset shows the spatial distribution of foreshock activity. b) This plot shows the magnitude of shocks over time. The inset shows the temporal variation of foreshock activity. Earthquake data were obtained from AFAD-DAD (2025b). Credit: Eyidoğan, 2026, CC BY-NC-ND 4.0

Latest posts by Rachel Crowell (see all)