
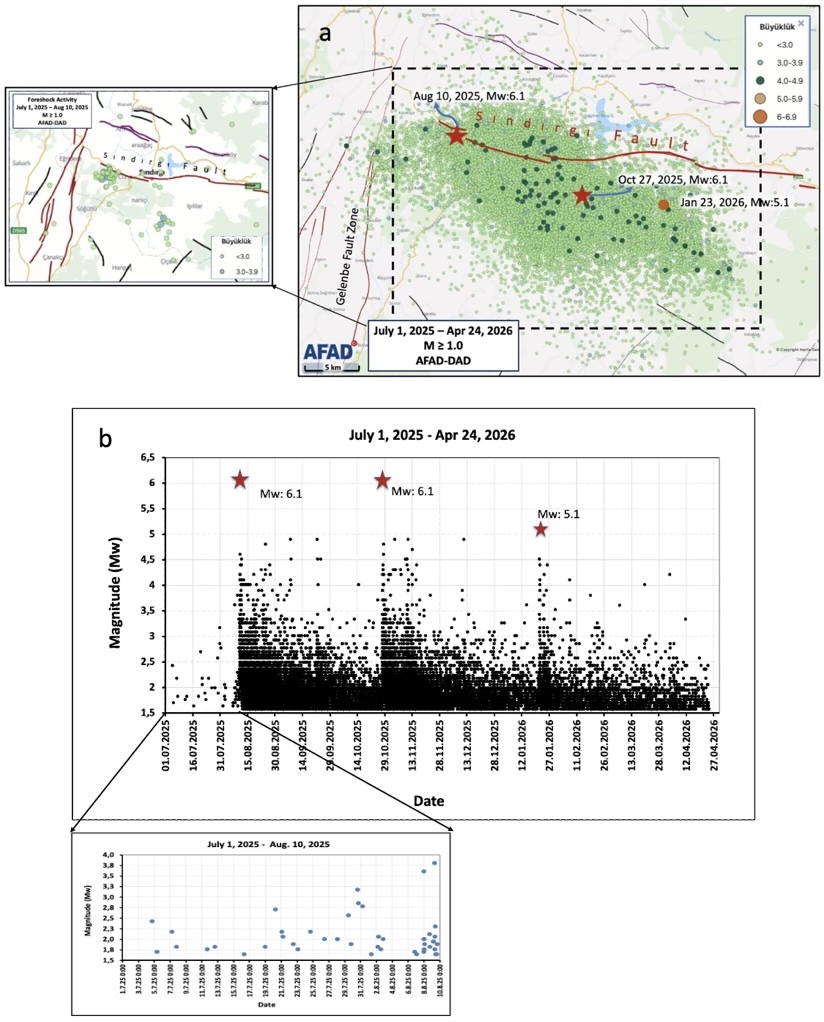
Figure 2. (a) This map shows the location of epicenters for seismic activity around the Sındırgı Fault between July 1, 2025, and April 24, 2026. The inset shows the spatial distribution of foreshock activity. b) This plot shows the magnitude of shocks over time. The inset shows the temporal variation of foreshock activity. Earthquake data were obtained from AFAD-DAD (2025b). Credit: Eyidoğan, 2026, CC BY-NC-ND 4.0

Alka Tripathy-Lang is a freelance science writer based in Chandler, Arizona, and holds a Ph.D. in geoscience.
Latest posts by Alka Tripathy-Lang, Ph.D. (see all)
- Living through the Loma Prieta earthquake - October 21, 2021
- The Great Quake Debate: an interview with seismologist and author Susan Hough - August 27, 2020
- Salton Sea Swarm quiets down - August 12, 2020