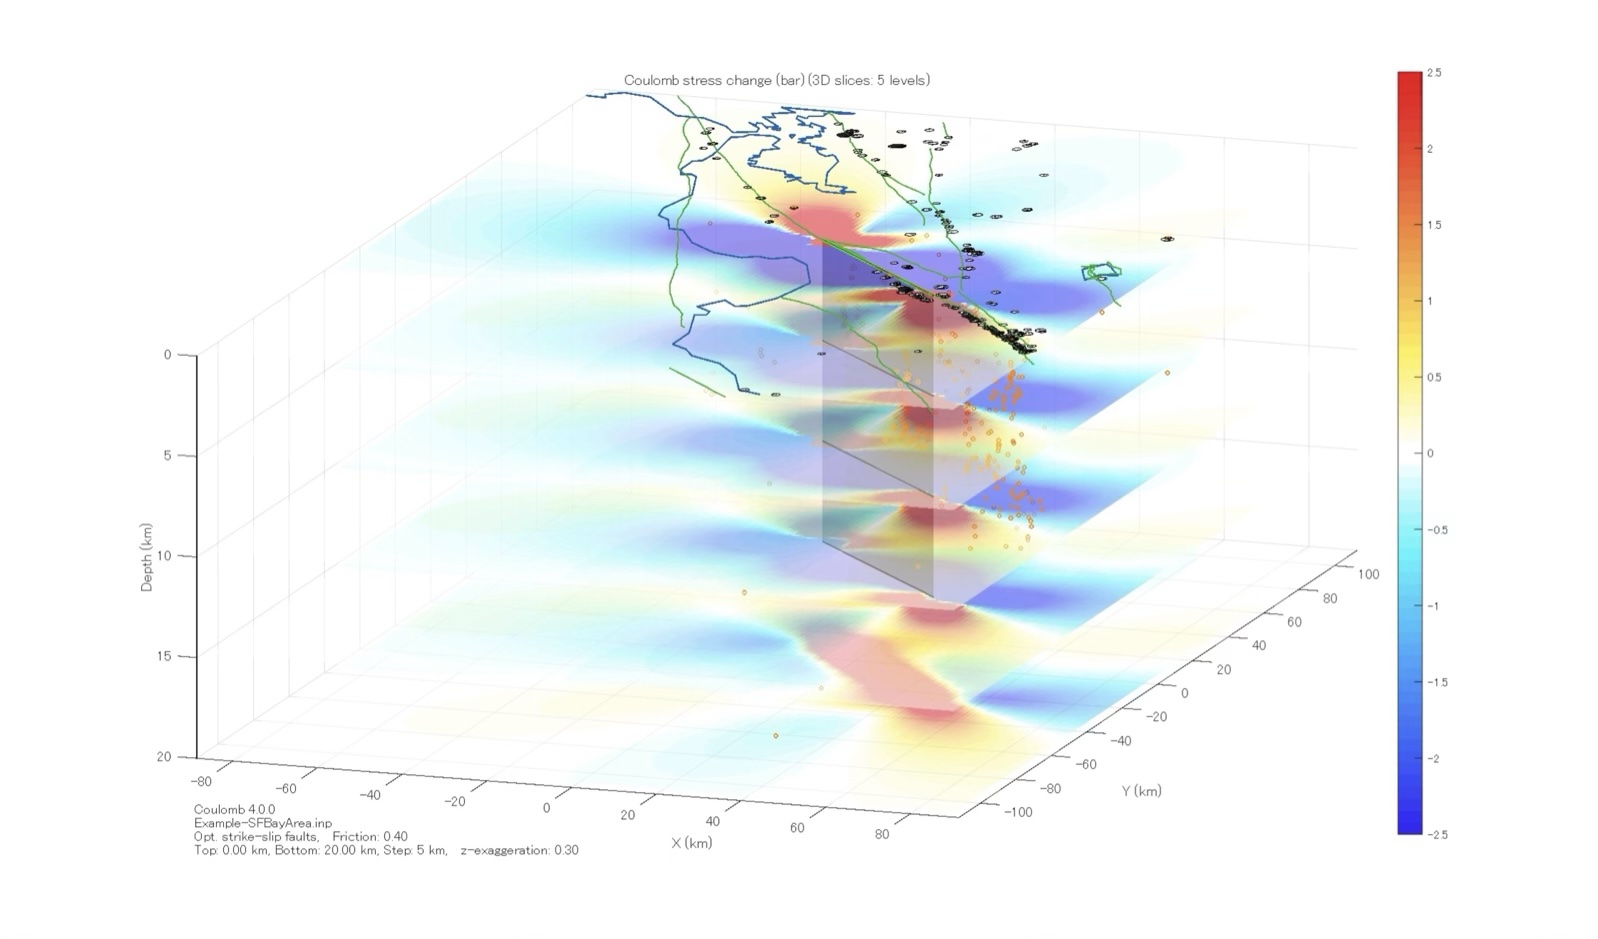
Figure 8. This image shows how stress changes with depth down to 20 kilometers. Earthquakes are plotted in black on the top surface, and earthquake depth bands are repeated in orange at each depth slice. Credit: Temblor, CC BY-NC-ND 4.0
Alka Tripathy-Lang is a freelance science writer based in Chandler, Arizona, and holds a Ph.D. in geoscience.
Latest posts by Alka Tripathy-Lang, Ph.D. (see all)
- Living through the Loma Prieta earthquake - October 21, 2021
- The Great Quake Debate: an interview with seismologist and author Susan Hough - August 27, 2020
- Salton Sea Swarm quiets down - August 12, 2020