By Ross Stein, Ph.D. and David Jacobson, M.Sc., Temblor
Click here to protect yourself from natural disasters

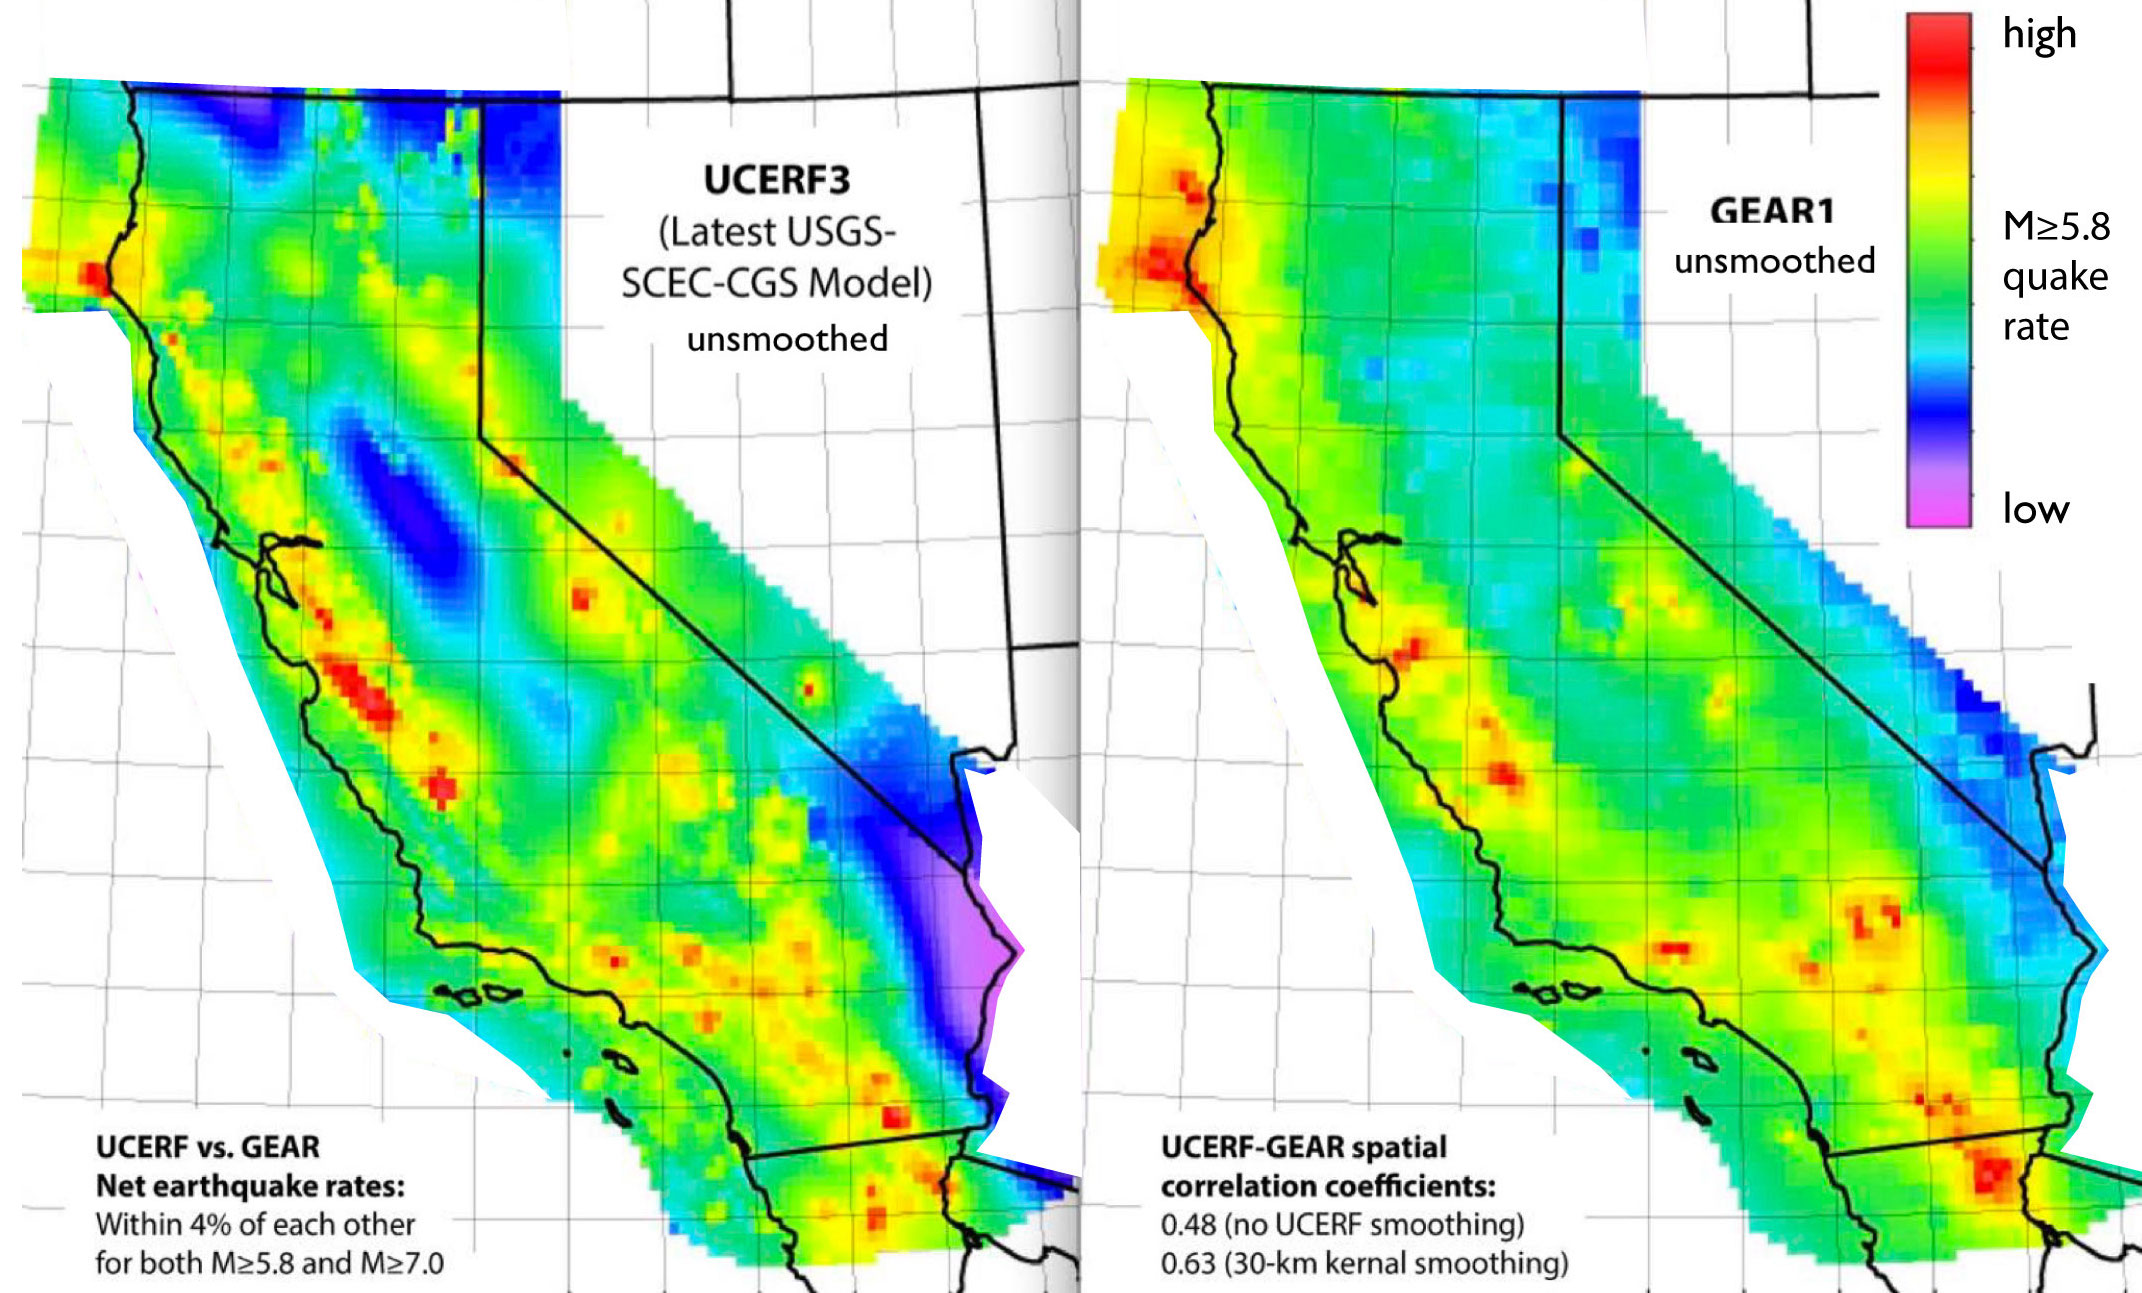
A newly-accepted study by the journal, Seismological Research Letters, analyzes the Global Earthquake Activity Rate (GEAR) forecast that is shown in Temblor. The test they conducted provides support for the model’s validity for worldwide annual earthquake forecasting. When published in 2015, GEAR was compared to the latest California model, the Uniform California Earthquake Rupture Forecast version 3 (UCERF3), and also to the independent ISC-GEM earthquake catalog for M≥6.8 quakes during the period 1918-1976. Against both of these, GEAR performed very well. For example, the underlying quake rates in UCERF3 agreed within 4% of GEAR for M≥5.8 and M≥7.0 shocks (see comparison below).
How does GEAR work?
What makes GEAR unique is first, that it is globally uniform by data and design, and second, that it blends the past 40 years of M≥5.7 quakes (Global CMT catalog) with the strain accumulation measured by GPS (GEM Strain Rate Model). So, the forces that drive quakes (strain) and the forces that release the strain (quakes) are both represented everywhere.
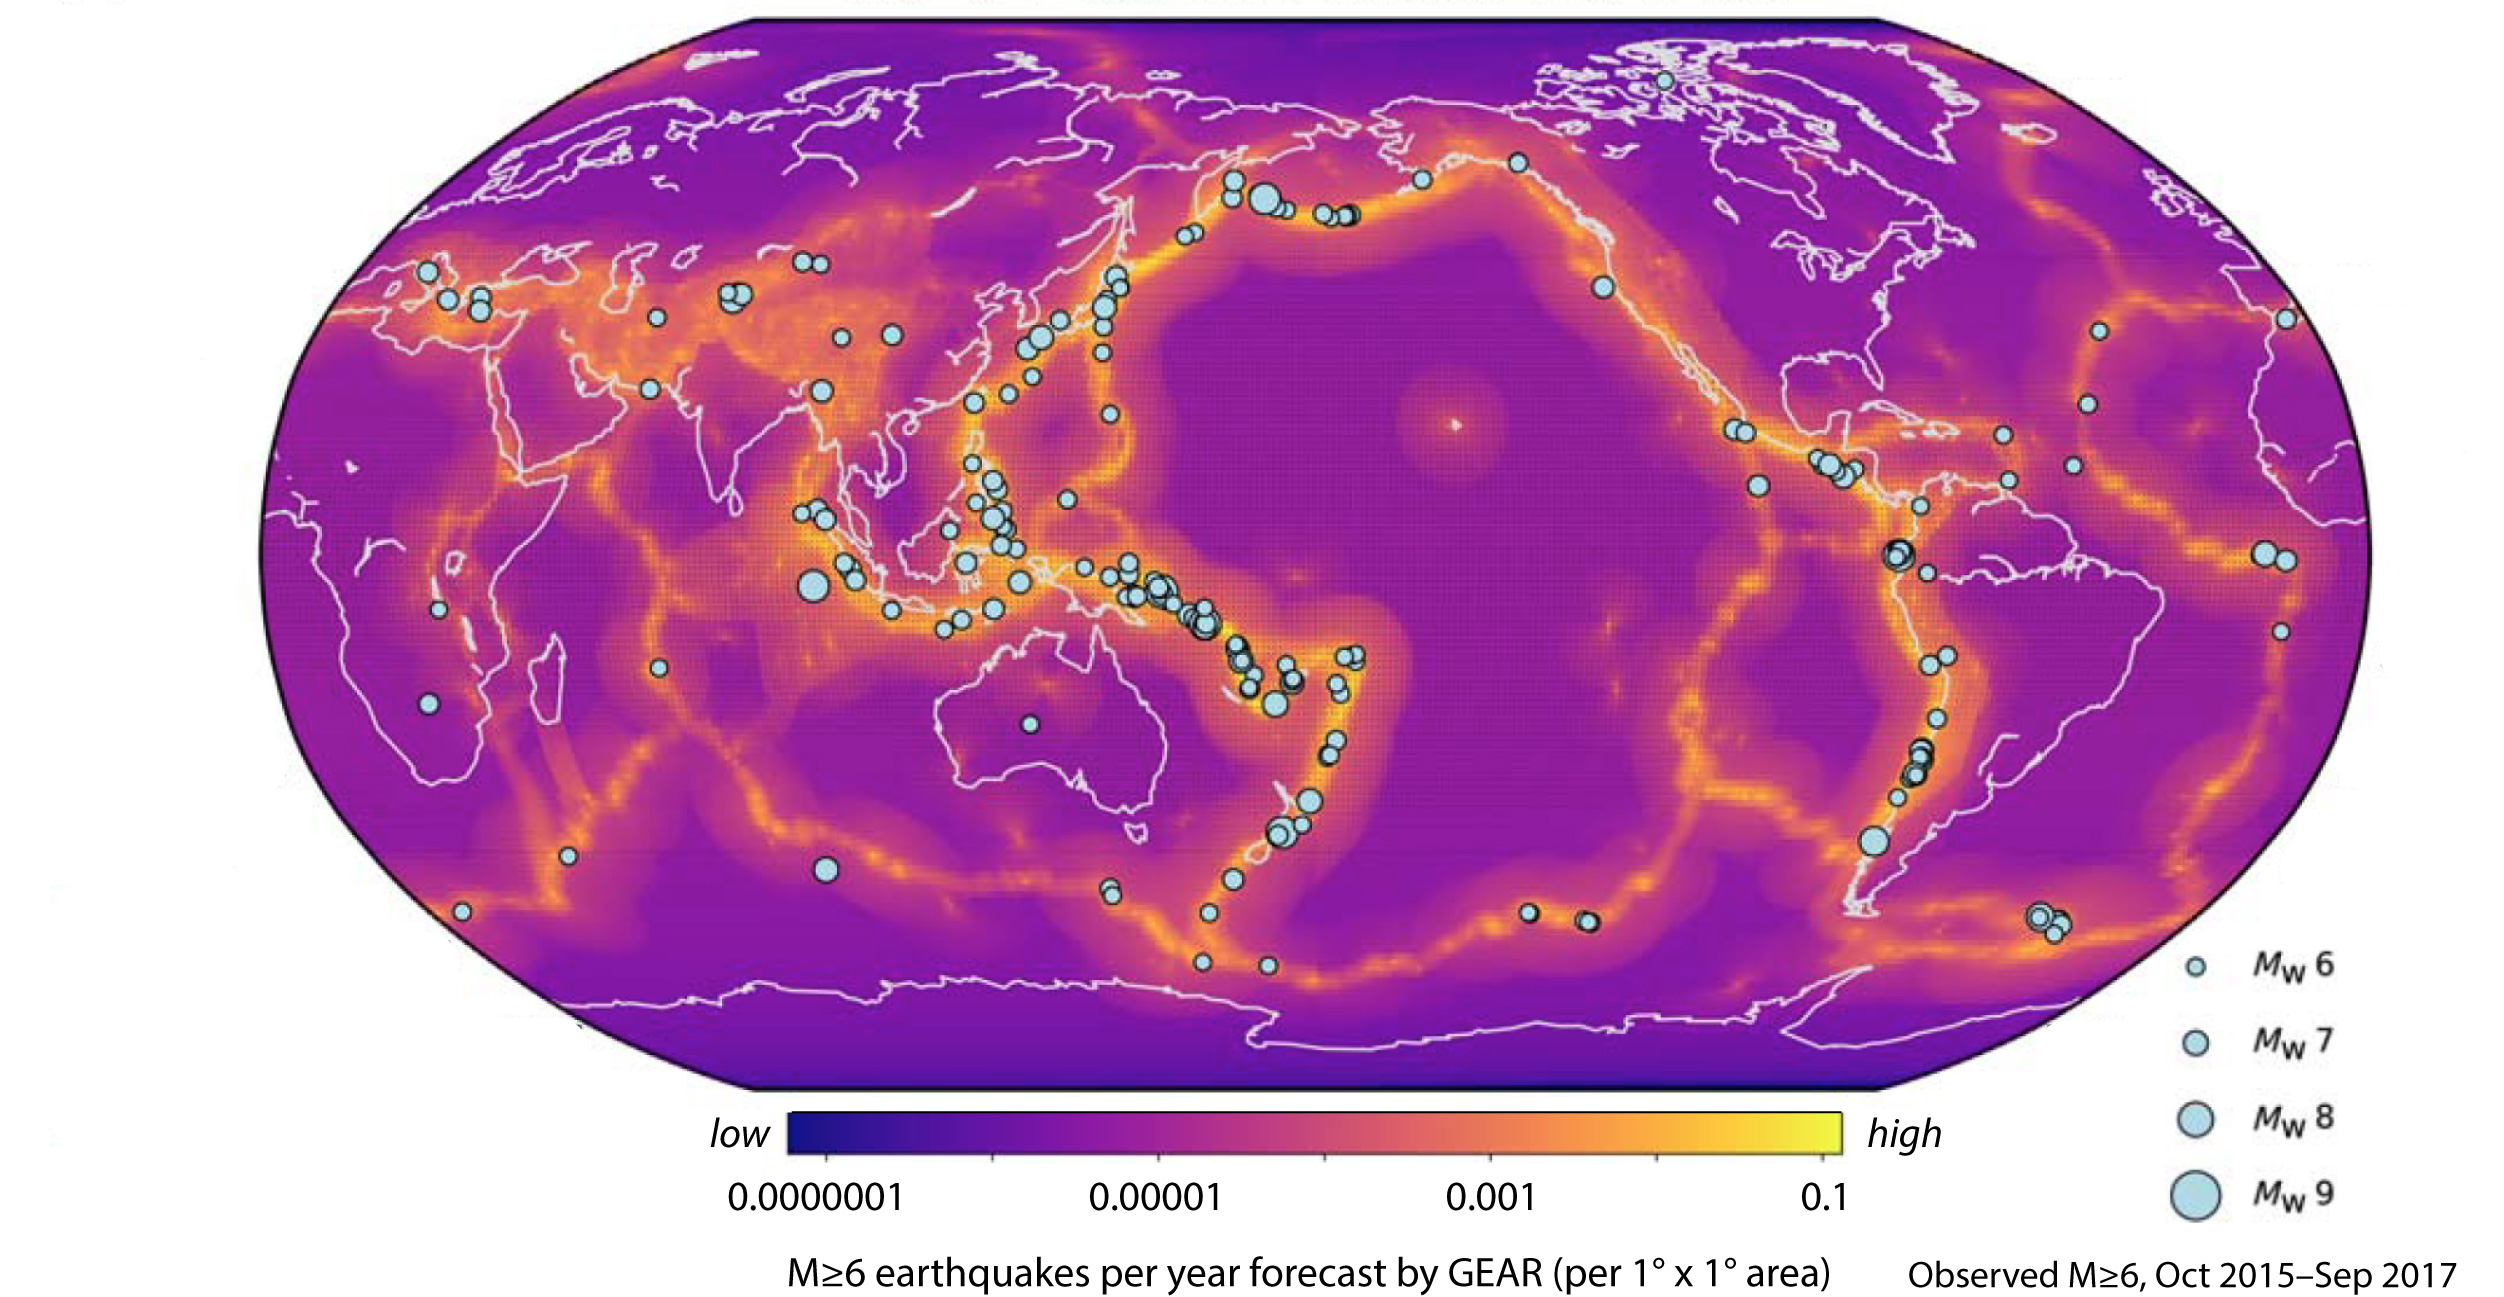
In the new study, an independent group of researchers conducted a “blind test” of GEAR, meaning they tested the model against future earthquakes. All global M=6+ earthquakes that occurred during two years after the published model was submitted to a testing authority, the Collaboratory for the Study of Earthquake Predictability (CSEP), were considered. There were 209 of these events. The map below shows these earthquakes compared to the GEAR model. Earthquakes tend to fall in the areas where the forecast rate of earthquakes is highest. A smaller number are expected to lie into the areas with a lower forecast rate, which is also consistent with the model.
For this two-year period, GEAR outperformed its tested competitors. Lead author, Dr. Anne Strader from GFZ Potsdam, and her colleagues wrote, “The total number of earthquakes, their spatial distribution, and their magnitude distribution, forecast by GEAR1 were all consistent with observed seismicity during the prospective 2-year testing period. In addition, she wrote, “GEAR1 outperformed its component strain and smoothed seismicity models. These results, along with additional retrospective testing, support the inclusion of both geodetic strain rates and earthquake catalog data to better constrain spatial seismicity patterns.”
Something lost, something gained
GEAR does not include active faults or historical earthquakes, traditional constituents of hazard models, because neither are globally uniform nor complete. The newly published test suggests that to some extent, strain and recent quakes capture these missing elements, resulting in a model where the quake rates in disparate locations (such as Tokyo vs. Los Angeles vs. Istanbul) can be rigorously inter-compared.
While the test supports GEAR’s validity, the authors suggest that a longer testing period, most likely eight years, will be needed to be definitive. Nonetheless, this is a step forward in understanding how best we can forecast earthquakes, which will give us a greater capability to prepare ourselves for earthquakes that will undoubtedly occur.
You can explore the GEAR model in Temblor. As an example, here is the GEAR model in Colombia, Venezuela, and northern Ecuador, three seismically active countries in South America.

References
Anne Strader, Maximilian Werner, José Bayona, Philip Maechling, Fabio Silva, Maria Liukis, and Danijel Schorlemmer, Prospective Evaluation of Global Earthquake Forecast Models: 2 Yrs of Observations Provide Preliminary Support for Merging Smoothed Seismicity with Geodetic Strain Rates, Seismological Research Letters, doi: 10.1785/0220180051
Bird, P., D. D. Jackson, Y. Y. Kagan, C. Kreemer, and R. S. Stein (2015). GEAR1: A global earthquake activity rate model constructed from geodetic strain rates and smoothed seismicity, Bull. Seismol. Soc. Am. 105, no. 5, 2538–2554.
Field, E. H., G. P. Biasi, P. Bird, T. E. Dawson, K. R. Felzer, D. D. Jackson, K. M. Johnson, T. H. Jordan, C. Madden, A. J. Michael, et al. (2015). Long-term time-dependent probabilities for the third
Uniform California Earthquake Rupture Forecast (UCERF3), Bull. Seismol. Soc. Am. 105, no. 2A, 511–543.
Collaboratory for the Study of Earthquake Predictability (CSEP) – Link
- Beware quiet segments of the Philippine Fault - May 16, 2025
-
ډیری عوامل افغاني ټولنې د زلزلې پر وړاندې زیانمنوي
- August 11, 2022 - What’s happening this week in Humboldt County, California: The squeeze - February 6, 2019