By David Jacobson, Temblor

For a region which has been starved of water the last five years, the rain in California over the last few months has been too much. While much of the state is no longer in a drought, reservoirs are overtopping their spillways, towns are flooding, and roads are eroding, disrupting services. Additionally, cities in California, including San Francisco, have already hit their water year (October 1 – September 30) averages. On average, San Francisco receives 23.7 inches of rain in a water year. In less than 5 months, the city has received 25.6 inches. So, how likely was this flooding? Is this a rare event or something Californians could come to expect? We thought we’d take a closer look to find out.
By using pictures of the flooding and locating them on FEMA’s flood maps, which are available on Temblor, we can determine if the flooding had greater than 1 in 10 chance or greater than 1 in 50 in any 10 year period. These translate to a 1% chance per year and 0.2% chance per year respectively.
One of the harder hit areas was Maxwell, CA, in Colusa County, 95 km northwest of Sacramento. The pictures below show both the extent of flooding, as well as the FEMA flood maps for the town. The star in each image is a location identifier.
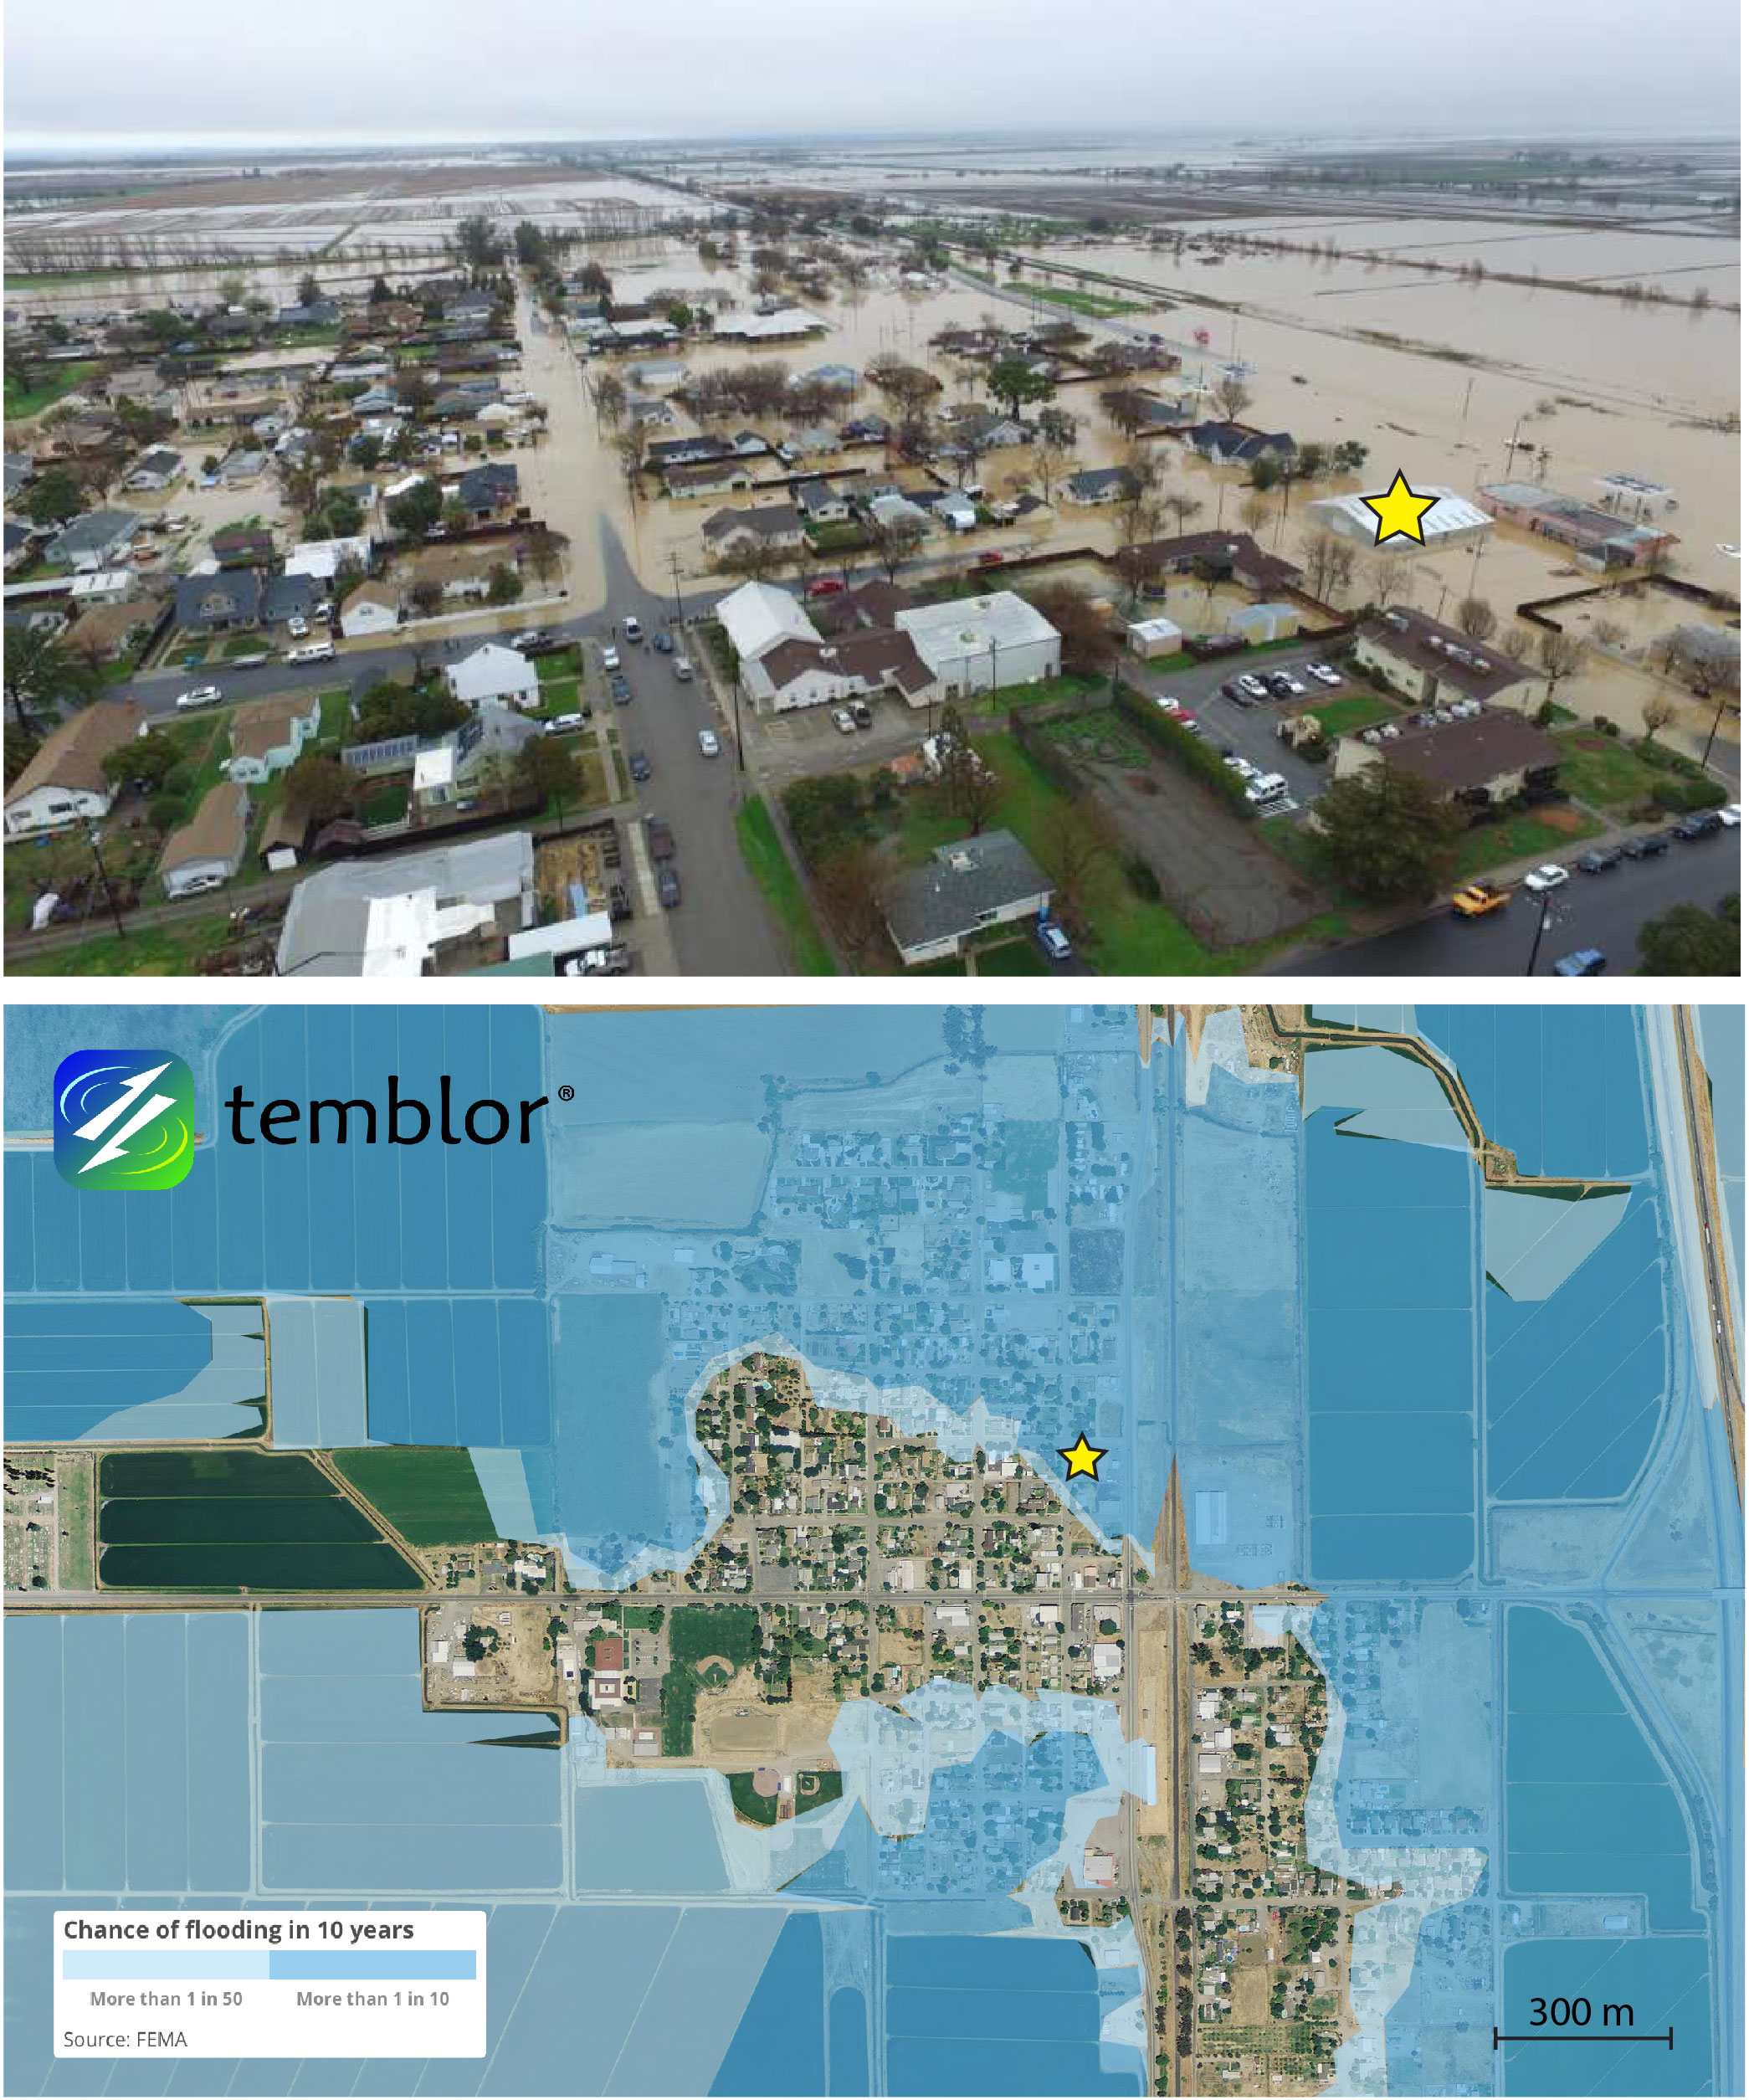
From the comparison above, one can see that the area of flooding almost perfectly mimics that in the FEMA flood maps. While there are some small discrepancies, the zone of flooding appears to follow the 10% chance per decade zone.
Other places we examined which experienced flooding include the Yolo Bypass Wildlife Area just west of Sacramento, and areas along Highway 37 along the northern shore of San Pablo Bay near Novato. Comparison images for these locations can be seen below.


What becomes evident from all of these figures is that flooding is inundating areas where the likelihood is roughly 10% per decade. Therefore, while flooding has closed roads, forced evacuations, and resulted in dam spillways being used for the first time in decades, the flooding, while unlikely, should not be considered rare. Had areas flooded where the likelihood was more than 1 in 50 every decade, it would have signified a rare event. Having said that, flooding could get worse for much of Northern California. While the rain will lighten over the next few days, the weekend is likely to bring another storm, which will bring more rain to an already soggy region.

References
FEMA
San Francisco Chronicle
SF Gate
- Beware quiet segments of the Philippine Fault - May 16, 2025
-
ډیری عوامل افغاني ټولنې د زلزلې پر وړاندې زیانمنوي
- August 11, 2022 - What’s happening this week in Humboldt County, California: The squeeze - February 6, 2019