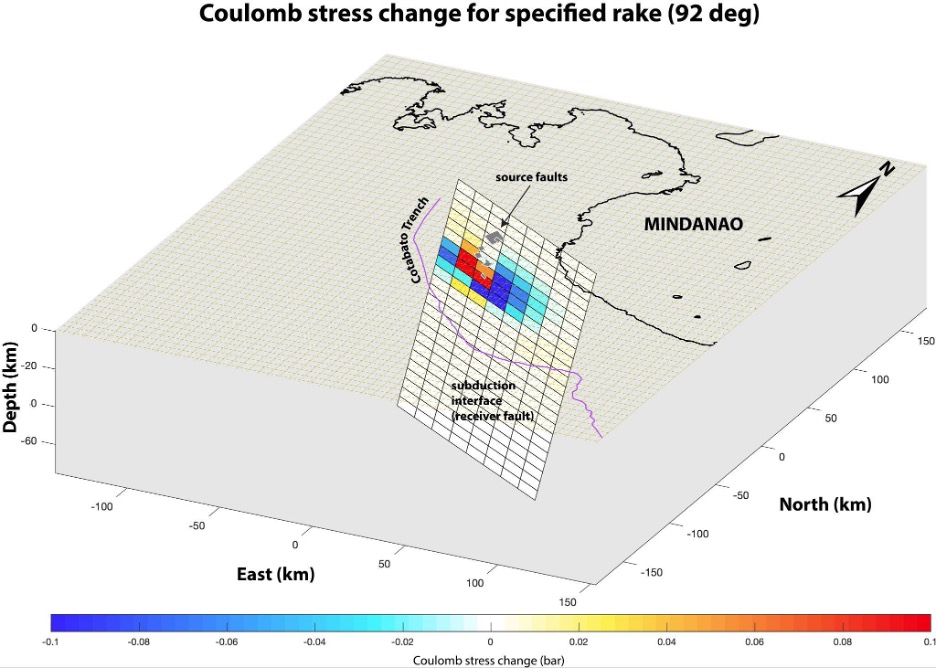
Figure 4. The Coulomb stress transfer model illustrates how the recent earthquake swarm may have altered stress along the subduction interface. Areas shown in red represent increased stress, whereas areas in blue represent decreased stress. Credit: Llamas et al., 2026, CC BY-NC-ND 4.0
Latest posts by Rachel Crowell (see all)