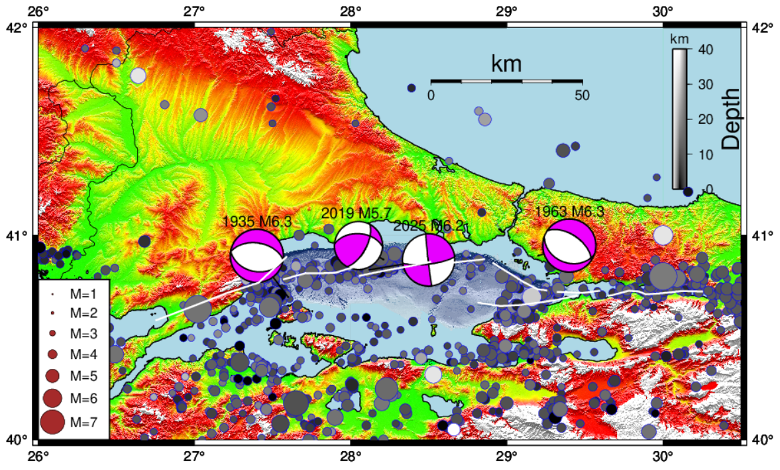
Figure 6. Seismicity of the Marmara region since 1900 shows earthquakes of magnitude greater than 3.5. The data are retrieved from the ISC bulletins. The beachballs indicate the faulting mechanisms of moderate-size earthquakes. The 1935 and 1963 earthquakes show normal faulting mechanisms. The green beachball shows the April 2025 event. Credit: Erdik et al., 2025, CC BY-NC-ND 4.0
Latest posts by Rachel Crowell (see all)