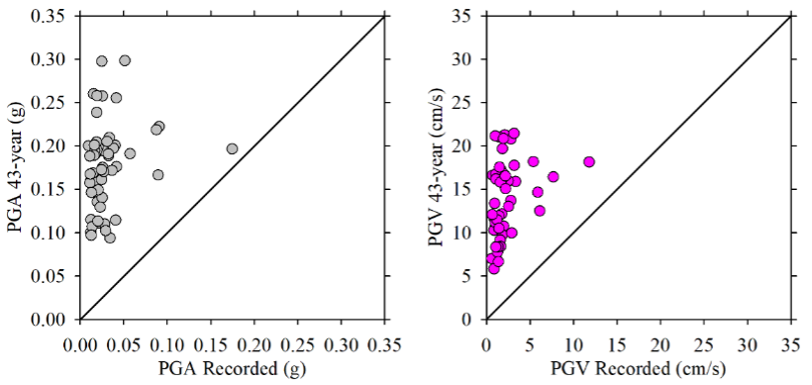
Figure 19. Comparison of the geometric mean recorded peak ground acceleration and peak ground velocity values with code-based peak ground motions corresponding to the 43-year return period. Credit: Erdik et al., 2025, CC BY-NC-ND 4.0
Latest posts by Rachel Crowell (see all)