Jason R. Patton, Ph.D., Ross Stein, Ph.D., Volkan Sevilgen, M.Sc.
A tsunami following the M = 7.5 earthquake in central Sulawesi, Indonesia yesterday caused many casualties yet remains an enigma until more data can be collected and analytical results are compiled. We do know that there was an earthquake with strong ground shaking, which is what we consider to be the warning of a possible tsunami: the ground shaking.
The actual tsunami run-up elevations are yet to be determined in a quantitative manner. In the coming weeks post tsunami survey teams will collect these important data about how large the tsunami actually was, its inland extent and the timing of wave arrivals. There are reports of wave heights between 7 feet and 18 feet, but these have yet to be substantiated with “boots on the ground” observations by subject matter experts as part of a post-tsunami survey. Some examples of the products of these post-tsunami responses are posted here at the Earthquake Engineering Research Institute.
Tsunami Causes
Tsunami are special waves that can be caused by a variety of scenarios. There are 4 main ways to generate a tsunami.
- Earthquakes that cause vertical land motion underwater.
- Underwater landslides that displace water.
- Underwater volcanic explosions
- Meteorological phenomena.
Earthquakes that happen as a result of compression, where plates move towards each other, are the types of earthquakes that generate the most amount of vertical land motion. These types of earthquakes happen at subduction zones, convergent plate boundaries like offshore of Sumatra, Japan, and the Pacific Northwest in the USA (Washington, Oregon, and California). This vertical land motion causes the entire water column to be displaced, causing the tsunami.
Below is a figure from Atwater et al. (2005) that shows how a subduction zone earthquake can generate vertical land motion. This vertical land motion pushes water upwards and when the water falls back down and begins to oscillate vertically, this is what generates tsunami waves.
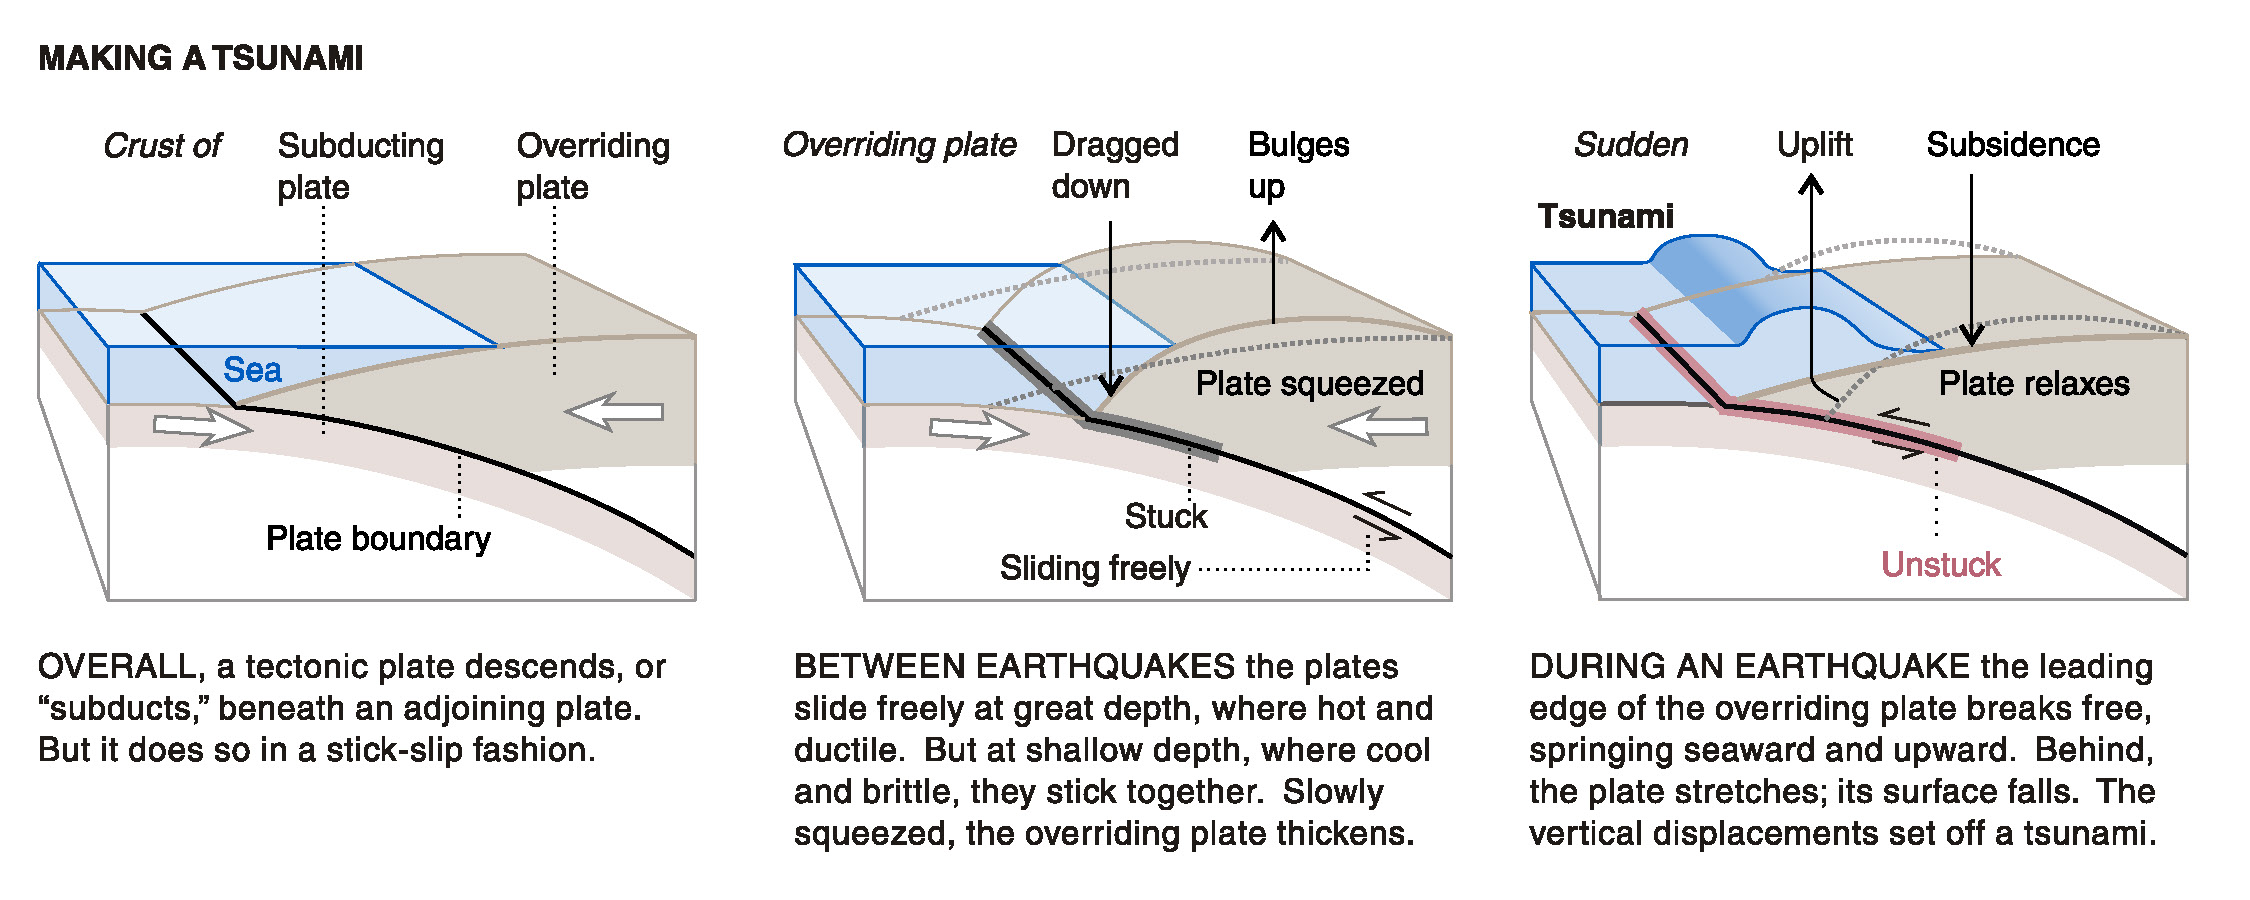
On the left is a cross sectional view of the physical configuration of a subduction zone. In the middle is what we think happens between earthquakes. On the right is what we think happens during earthquakes.
Below is a figure that is useful to illustrate the terminology about tsunami waves (National Research Council, 2011). Wave height is the elevation of the water surface above sea level. Run-up height is the maximum elevation that the tsunami reaches on land. Note how the tsunami wave height increases in shallow water.

A cross section of the ocean as a tsunami wave travels towards the shoreline. Ambient sea level is represented as a black horizontal line.
Strike slip earthquakes can also generate tsunami if there is significant vertical land motion or if there is topography that is offset during the earthquake. This topography can displace seawater causing a tsunami. However, strike slip generated tsunami are much smaller than subduction zone generated tsunami because the displacement of water is less for strike slip earthquakes.
We have some examples of strike-slip earthquake generated tsunami. For example, the 1999 M 7.4 İzmit Turkey earthquake on the North Anatolian fault was a strike slip earthquake and generated a tsunami. However the tsunami was not very large, maximum wave run-up elevation of about 2 meters or 6.5 feet (Altinok et al., 1999). There appears to have been some vertical land motion offshore during this earthquake. There was also a submarine landslide that caused large localized tsunami run-up in excess of 15 meters or 50 feet (Tinti et al., 2006).
There is also a possibility that there were submarine landslides that may have contributed to the M=7.5 Sulawesi tsunami. There have been observed extensive landslides in the surrounding mountains, along the valley floor in the city of Palu, and along the shoreline. There is no reason to believe that these landslides only occurred on land, so it is certainly possible that these likely submarine landslides contributed to the size of the tsunami. We won’t know this until scientists map the seafloor in Pula Bay and in the ocean offshore north of Pula Bay. They will need to try to locate evidence for recent landsliding.
Dr. Robert Hall is a geologist who is a prolific author reporting about the tectonics of Southeast Asia. Dr. Hall prepared a report where they present a map showing high resolution bathymetry of the ocean north of Palu Bay. Below is Dr. Hall’s map and their report can be found here. The map shows that there is evidence for large landslides in the past. Also, we can see on the map that the surrounding land is sending large amounts of sediment into the sea in this region. These sedimentary deposits do not have great strength and are quite susceptible to submarine landsliding.
When marine geologists collect new post-earthquake bathymetry data, they will be able to compare these with these data presented by Dr. Hall.

The inset map on the right shows the region of Sulawesi, Indonesia that is dissected by the Palu-Koro fault. The map on the right (extent shown as a red box on the right) shows the shape of the seafloor with color representing depth. Spot locations are shown as red dots and depths are labeled in meters below sea level.
Finally, a factor that probably contributed to the size of the tsunami was the shape of Palu Bay. Computer models of tsunami waves show that as waves travel south towards the city of Palu, the wave heights increase. This is probably caused because the depth of the bay gets shallower to the south. We know that as tsunami approach shallower water from deeper water, wave heights get larger.
We will need to wait some time before measurements are collected to verify the size of the tsunami and to test these various hypotheses before we have a better idea about what caused the tsunami and what may have contributed to its apparent large size.
The magnitude M 7.5 Earthquake and Tsunami
The M 7.5 earthquake near Palu, Sulawesi, Indonesia was a strike-slip earthquake that appears to have slipped a 160 km length of the Palu-Kora fault system. This Palu-Koru fault is the most active fault in Sulawesi, and has a slip rate larger the San Andreas fault in California. We discuss the earthquake further in this temblor report. These kinds of earthquakes result from the earth moving side by side and tend to generate less amounts of vertical land motion. Because of this, at first glance, geologists did not expect this earthquake would generate a large tsunami.
Below is a map that shows the regional earthquake faults. On the left is a small scale map showing the main faults in the region (Bellier et al., 2001). The location for the USGS epicenter is marked as a red star. The map on the right is larger scale and shows more details about how these faults may cross the region. Based upon preliminary analyses of satellite imagery, it appears that the fault or faults that slipped during this earthquake began near the epicenter and mostly slipped southwards, through Palu, and extended beyond the southern limit of Palu Valley. The spatial extent of the following figure is outlined as an orange rectangle.

Plate tectonic fault map showing major fault systems in Sulawesi (modified from Bellier et al., 2001). On the right is a more detailed fault map of the Palu-Kora fault system as it passes through and along Palu Valley (modified from Watkinson and Hall, 2017).
Below is a figure prepared by Dr. Sotiris Valkaniotis, an earthquake geologist from Greece. Dr. Valkaniotis used computer software to compare satellite imagery from before and from after the earthquake. This software uses the “pixels” (the small parts that make up the picture) and how they are arranged beside each other to estimate how those pixels changed position after the earthquake. This is a compilation of a series of analyses that they conducted.
Areas that are colored yellow and orange moved to the north. Areas that are colored blue are areas that moved towards the south, the opposite direction. Areas that are not colored were not analyzed for a variety of reasons. We can infer the magnitude of earthquake motion along the fault and we can infer the location of the fault using this map. Where these colors meet is an approximation for the location of the fault that slipped in this area of Palu Valley. The relative motion may be as large as about 10 meters, but we can see that as the colors change across the map, the relative motion varies too. This is a preliminary analytical result and we will learn more about this earthquake as time passes.
![]()
Relative north-south motion across the fault is shown as warm and cool colors. Note that the map is oriented with North pointing to the right. Blue represents motion to the south and orange represents relative motion to the north. The earthquake rupture does not end on the left part of the map, but extends further. This analysis is limited to the imagery available to Dr. Valkaniotis and if the imagery is obscured by clouds.
There have been some historic earthquakes in this region that also resulted in observable tsunami. Over the past century, there have been 6 tsunamigenic earthquakes in this region. 3 of these tsunamis in 1927, 1968, and 1996 are associated with earthquakes along the Palu-Kora fault (Prasetya et al., 1998). The other earthquakes were associated with the Sulawesi subduction zone to the north and the Paternoster (or Adang) strike slip fault zone to the southwest.
Tsunami Modeling
Computer models can be used to estimate the spatial and temporal patterns of tsunami. These models are based on assumptions about the initial condition of the water. This initial condition is often informed by our knowledge of how the seafloor may have been deformed, either by earthquakes or landslides. The calculations in these models about how water behaves are fairly well understood.
The factors that that control the results of these models are our knowledge of the initial condition (shape of seafloor deformation from earthquakes or tsunami) and our knowledge of the shape of the seafloor over which the tsunami travels. Larger amounts of seafloor deformation create larger initial tsunami waves. As the tsunami travels across the ocean, the shape of the seafloor can change the direction and magnitude of the tsunami waves. For example, the depth of water can control the speed of a tsunami, as well as the height.
We must keep in mind that these computer models are only as good as the information that we use to create them. If the knowledge of the initial conditions or the shape of the seafloor are poorly known, the model results may poorly represent what may have actually occurred. This is why post tsunami surveys are so vitally important to provide this “boots on the ground” information about the spatial distribution of tsunami inundation.
Below is a figure showing the results of tsunami modeling prepared by Andreas Shaefer (Schäfer et al., 2017). The source model is a strike slip earthquake with a fault oriented similar to the USGS fault slip model. This earthquake fault slip model was prepared by Bertrand Delouis. Given our limited knowledge of the tsunami wave height or run-up elevation, this model suggests that the slip on the fault may have been sufficient to explain the size of the tsunami. Note how, in general, the tsunami wave heights increase to the south.
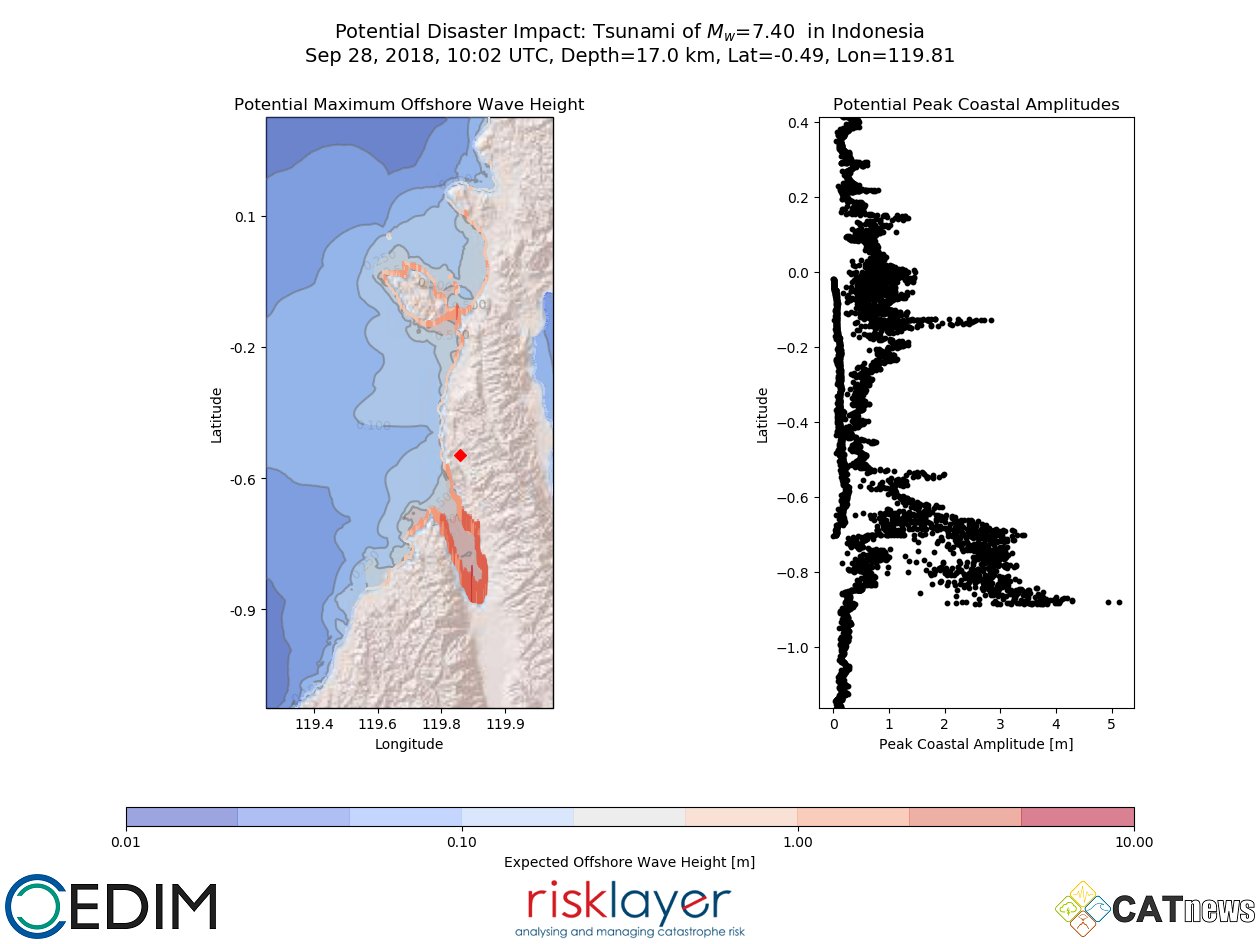
The map on the left shows the maximum tsunami wave heights along the coastline of Palu Bay and north of Palu Bay. The color bar shows these heights as color and units are in meters (1 meter is about 3.3 feet). The plot on the right show the wave heights at the different locations presented on the map. The vertical axis is aligned with the map on the left. The horizontal axis shows the height in meters.
Tsunami Preparedness
There are local tsunami and distant tsunami. Local tsunami are tsunami that occur nearby to the source of the tsunami. The tsunami that occurred in Palu Bay was a local tsunami. Distant tsunami are tsunami that inundate regions far from the source. Distant tsunami are also known as trans-oceanic tsunami as they travel across the ocean.
Distant tsunami have the potential to cause casualties of people who did not feel the earthquake, due to their distance from the earthquake. A recent example is the 2004 Sumatra-Andaman subduction zone earthquake and tsunami. The seismogenic tsunami traveled across the Indian Ocean and caused tens of thousands of deaths in India and Sri Lanka. Below is a photo of one of the train cars that was caught in the tsunami as it inundated the coast of Sri Lanka.

Train #50 was a train operating between the cities of Colombo and Matara, Sri Lanka. The tsunami wave height was between 24 and 29 feet at this location. Image Source: Public Domain via Wikipedia
Tsunami early warning systems can be help to save lives in regions where distant tsunamis strike. These early warning systems are based upon measurements of tsunami wave height as observed at tsunami buoys. The key to whether such a system could help people is the location of the tsunami source and the location of the tsunami buoys. First, the buoys need to be between the tsunami source and the people at risk in order for the tsunami warning to be sent to the people prior to the tsunami reaching them. Also, there needs to be sufficient time to effectively communicate this warning.
While the Indonesian tsunami early warning system was offline during this catastrophe, this system would not have helped the people in Palu because they were being subjected to a local tsunami.
I (JRP) live in coastal northern California, at the southern end of the Cascadia subduction zone. Local Redwood Coast Tsunami Working Group experts (like Dr. Lori Dengler) and I emphasize to the public that for a tsunami generated by a regional earthquake like that from Cascadia, the ground shaking IS the warning. There is no need for sirens or any other notification. Often the electricity stops working, making these sirens ineffective. We suggest that if an earthquake causes ground shaking for more than 20 seconds, that people should get to high ground if they are in a tsunami evacuation zone. Whenever one lives in or travels to a coastal region that is subject to tsunami inundation, they should keep this in mind.
An M=7.5 earthquake will probably shake for longer than 20 seconds, so this “rule of thumb” may have helped locals in Pula evacuate to higher ground. However, the tsunami warning had been retracted 5 minutes after the earthquake. This may or may not have affected how people responded.
The Indonesian Meteorological, Climatological, and Geophysical Agency (BMKG) have determined that the tsunami arrived at the shoreline in Palu between 8 and 11 minutes after the earthquake. This highlights the importance for people to take action to protect themselves. People in the region of potential tsunamigenic earthquakes need not rely on any external information other than their own senses.
Take Away
This story is continuing to develop and we get more information every day. Until we can collect and compile direct observations from field work (onshore and offshore), we won’t be able to fully reconstruct what really happened. Currently, we do not have the complete data set to test any hypotheses about why the tsunami was triggered or what controlled the size of the tsunami.
If we can learn anything from this natural disaster, we must know what to do if we are in earthquake country and are in a low elevation area near the coast. The earthquake is our natural warning to move to high ground. Tsunami waves can often last for hours, so this is the time that we want to remain at a higher elevation. Dr. Dengler tells the public about people who lived on islands offshore of Sumatra. Their oral history led them to evacuate to high ground whenever there was an earthquake and they would stay there for a week or so. This is what they did in response to the 2004 earthquake offshore of Sumatra and everyone survived. Hopefully we all become more resilient to natural disasters by sharing this knowledge with others.
Learn more about your exposure to natural disasters here at Temblor.net.
References
Altinok, Y., Alpar, B., Ersoy, S., and Yalςiner, A.C., 1999. Tsunami generation of the Kocaeli Earthquake (August 17th 1999) in the Izmit Bay; coastal observations, bathymetry and seismic data in Turkish J. Marine Science, vol. 5, no. 3, p. 131-148
Atwater, B.F., Musumi-Rokkaku, S., Satake, K., Tsuji, Y., Ueda, K., and Yamaguchi, D.K., 2015. The orphan tsunami of 1700—Japanese clues to a parent earthquake in North America, 2nd ed.: Seattle, University of Washington Press, U.S. Geological Survey Professional Paper 1707, 135 p.
Bellier, O., Sebrier, M., Beaudouin, T., Villenueve, M., Braucher, R., Bourles, D., Siame, L., Putranto, E., and Pratomo, I., 2001. High slip rate for a low seismicity along the Palu-Koro active fault in central Sulawesi (Indonesia) in Terra Nova, v. 13, No. 6, p. 463-470
National Research Council, 2011. Tsunami Warning and Preparedness: An Assessment of the U.S. Tsunami Program and the Nation’s Preparedness Efforts. Washington, DC: The National Academies Press. https://doi.org/10.17226/12628.
Prasetya, G.S., De Lange, W.P., and Healy, T.R., 2001. The Makassar Strait Tsunamigenic Region, Indonesia in Natural Hazards, v. 24, p. 295-307
Schäfer, A. M., and Wenzel, F., 2017. Tsupy: computational robustness in Tsunami hazard modelling in Computers & Geosciences, v. 102, p. 148-157
Tinti, S., Armigliato, SA., Manucci, A., Pagnoni, G., Zaniboni, F., Yalςiner, A.C., and Altink, Y., 2006. The generating mechanisms of the August 17, 1999 I˙zmit bay (Turkey) tsunami: Regional (tectonic) and local (mass instabilities) causes in Marine Geology, v. 225, p. 311-330, doi:10.1016/j.margeo.2005.09.010
Watkinson, I.M. and Hall, R., 2017. Fault systems of the eastern Indonesian triple junction: evaluation of Quaternary activity and implications for seismic hazards in Cummins, P. R. & Meilano, I. (eds) Geohazards in Indonesia: Earth Science for Disaster Risk Reduction, Geological Society, London, Special Publications, v. 441, https://doi.org/10.1144/SP441.8
Glossary
Amplitude is approximately the maximum height of the wave above sea level when in deep water. Note that this is not the same as the “double amplitude” (aka peak amplitude) which is the vertical distance between the crest and the trough. Wave height is another way of saying wave amplitude.
Inundation refers to the horizontal extent of coastal flooding due to tsunami.
Run-up height or elevation is the vertical elevation of the most landward penetration of the tsunami wave with respect to the initial sea level. Run-up is a vertical distance, while inundation is a horizontal distance.
- Osa Peninsula, Costa Rica: A unique opportunity to drill and instrumentthe seismogenic zone of large megathrust earthquakes - June 4, 2019
- Mexico-Guatemala earthquake, felt by millions, likely triggered by the 2017 megaquake - February 2, 2019
- Fuerte estremecimiento a partir de terremoto en la costa central de Chile: ¿Qué revela acerca del siguiente choque de megafalla? - January 23, 2019