Jason R. Patton, Ph.D., Shinji Toda, Ph.D., Ross Stein, Ph.D., Volkan Sevilgen, M.Sc.
The earthquake struck on the Palu-Koro fault, with a faster slip rate than the San Andreas, and is straddled by the city of Palu, with a population of about 340,000. The earthquake has a magnitude that was hypothesized to occur on this plate boundary fault, there was a localized tsunami generated during or after the earthquake, and there is some chance that there will be a triggered earthquake on other faults in the region. There have been 384 reported deaths and there remain people reported missing. There is also video evidence of a landslide triggered by this earthquake.
Plate Tectonics and Earthquake Hazard
The nation of Indonesia is a spatially large country that spans many different plate tectonic settings. The largest earthquakes that can occur on Earth are subduction zone earthquakes, the result of convergent plate boundaries. In December 2004 and March 2005, there were a pair of subduction zone earthquakes along the Sunda Trench offshore of the west coast of Sumatra. The magnitude M 9.1 2004 Sumatra-Andaman subduction zone earthquake generated a deadly trans-oceanic tsunami that caused casualties in Sumatra, Sri Lanka, and India. There were almost a quarter million casualties, most came from the tsunami.
Today’s magnitude M 7.5 earthquake
The event struck on a large strike-slip fault that transects the northern portion of the island of Sulawesi. This Palu-Koru fault is the most active fault in Sulawesi, and has a slip rate similar to that of the San Andreas fault in California. However, while the San Andreas is a right-lateral strike-slip fault, the Palu-Koro fault is left-lateral.
Socquet et al. (2006) use Global Positioning Systems (GPS) data and computer modeling to estimate that the Palu-Koro fault has a slip-rate of about 42 mm per year. This contemporary slip rate is comparable to the 35 mm per yr slip rate based upon offsets of Holocene (<12,000 years) stream channels (Bellier et al., 2001). The Palu-Koro fault is straddled by the city of Palu (Watkinson et al., 2017).
Using empirical relations for historic earthquakes compiled by Wells and Coppersmith (1994), Socquet et al. (2016) suggest that the Palu-Koro fault system could produce a magnitude M=7 earthquake once per century. However, studies of prehistoric earthquakes along this fault system suggest that, over the past 2000 years, this fault produces magnitude M 7-8 earthquakes roughly every 700 years (Bellier et al., 2006).
Below is a plate tectonic map of the region, showing the different plate boundary faults (Bellier et al., 2006). The location of today’s M 7.5 earthquake is shown as a blue star. There is an inset map that shows where Sulawesi is located in eastern Indonesia.

Regional plate tectonic map for the Sulawesi region of Indonesia (modified from Bellier et al., 2006). Black lines are the plate boundary faults. Triangles designate subduction zones. Red arrows show relative plate motion across these faults. Note the Palu-Koro fault has a left-lateral sense of motion.
Many governments and non-governmental organizations prepare estimates of seismic hazard so that people can ensure their building codes are designed to mitigate these hazards. The Global Earthquake Model (GEM) is an example of our efforts to estimate seismic hazards, though on a global scale. Temblor.net uses the Global Earth Activity Rate (GEAR) model to prepare estimates of seismic hazard at a global to local scale (Bird et al., 2015). Each of these models incorporates earthquake information from different sources including, but not limited to, fault slip rates, records of prehistoric earthquakes, historic seismicity, and strain of the Earth’s crust as measured using Global Positioning System (GPS) observations.
Below is a map prepared using the temblor.net app. The rainbow color scale represents the chance of a given earthquake magnitude, for a given location, within the lifetime of a person. The temblor app suggests that this region could have an earthquake of M=7.2 in a human lifetime.
The earthquake score for the area where this M 7.5 earthquake happened is 79. Learn more about your hazard score here.
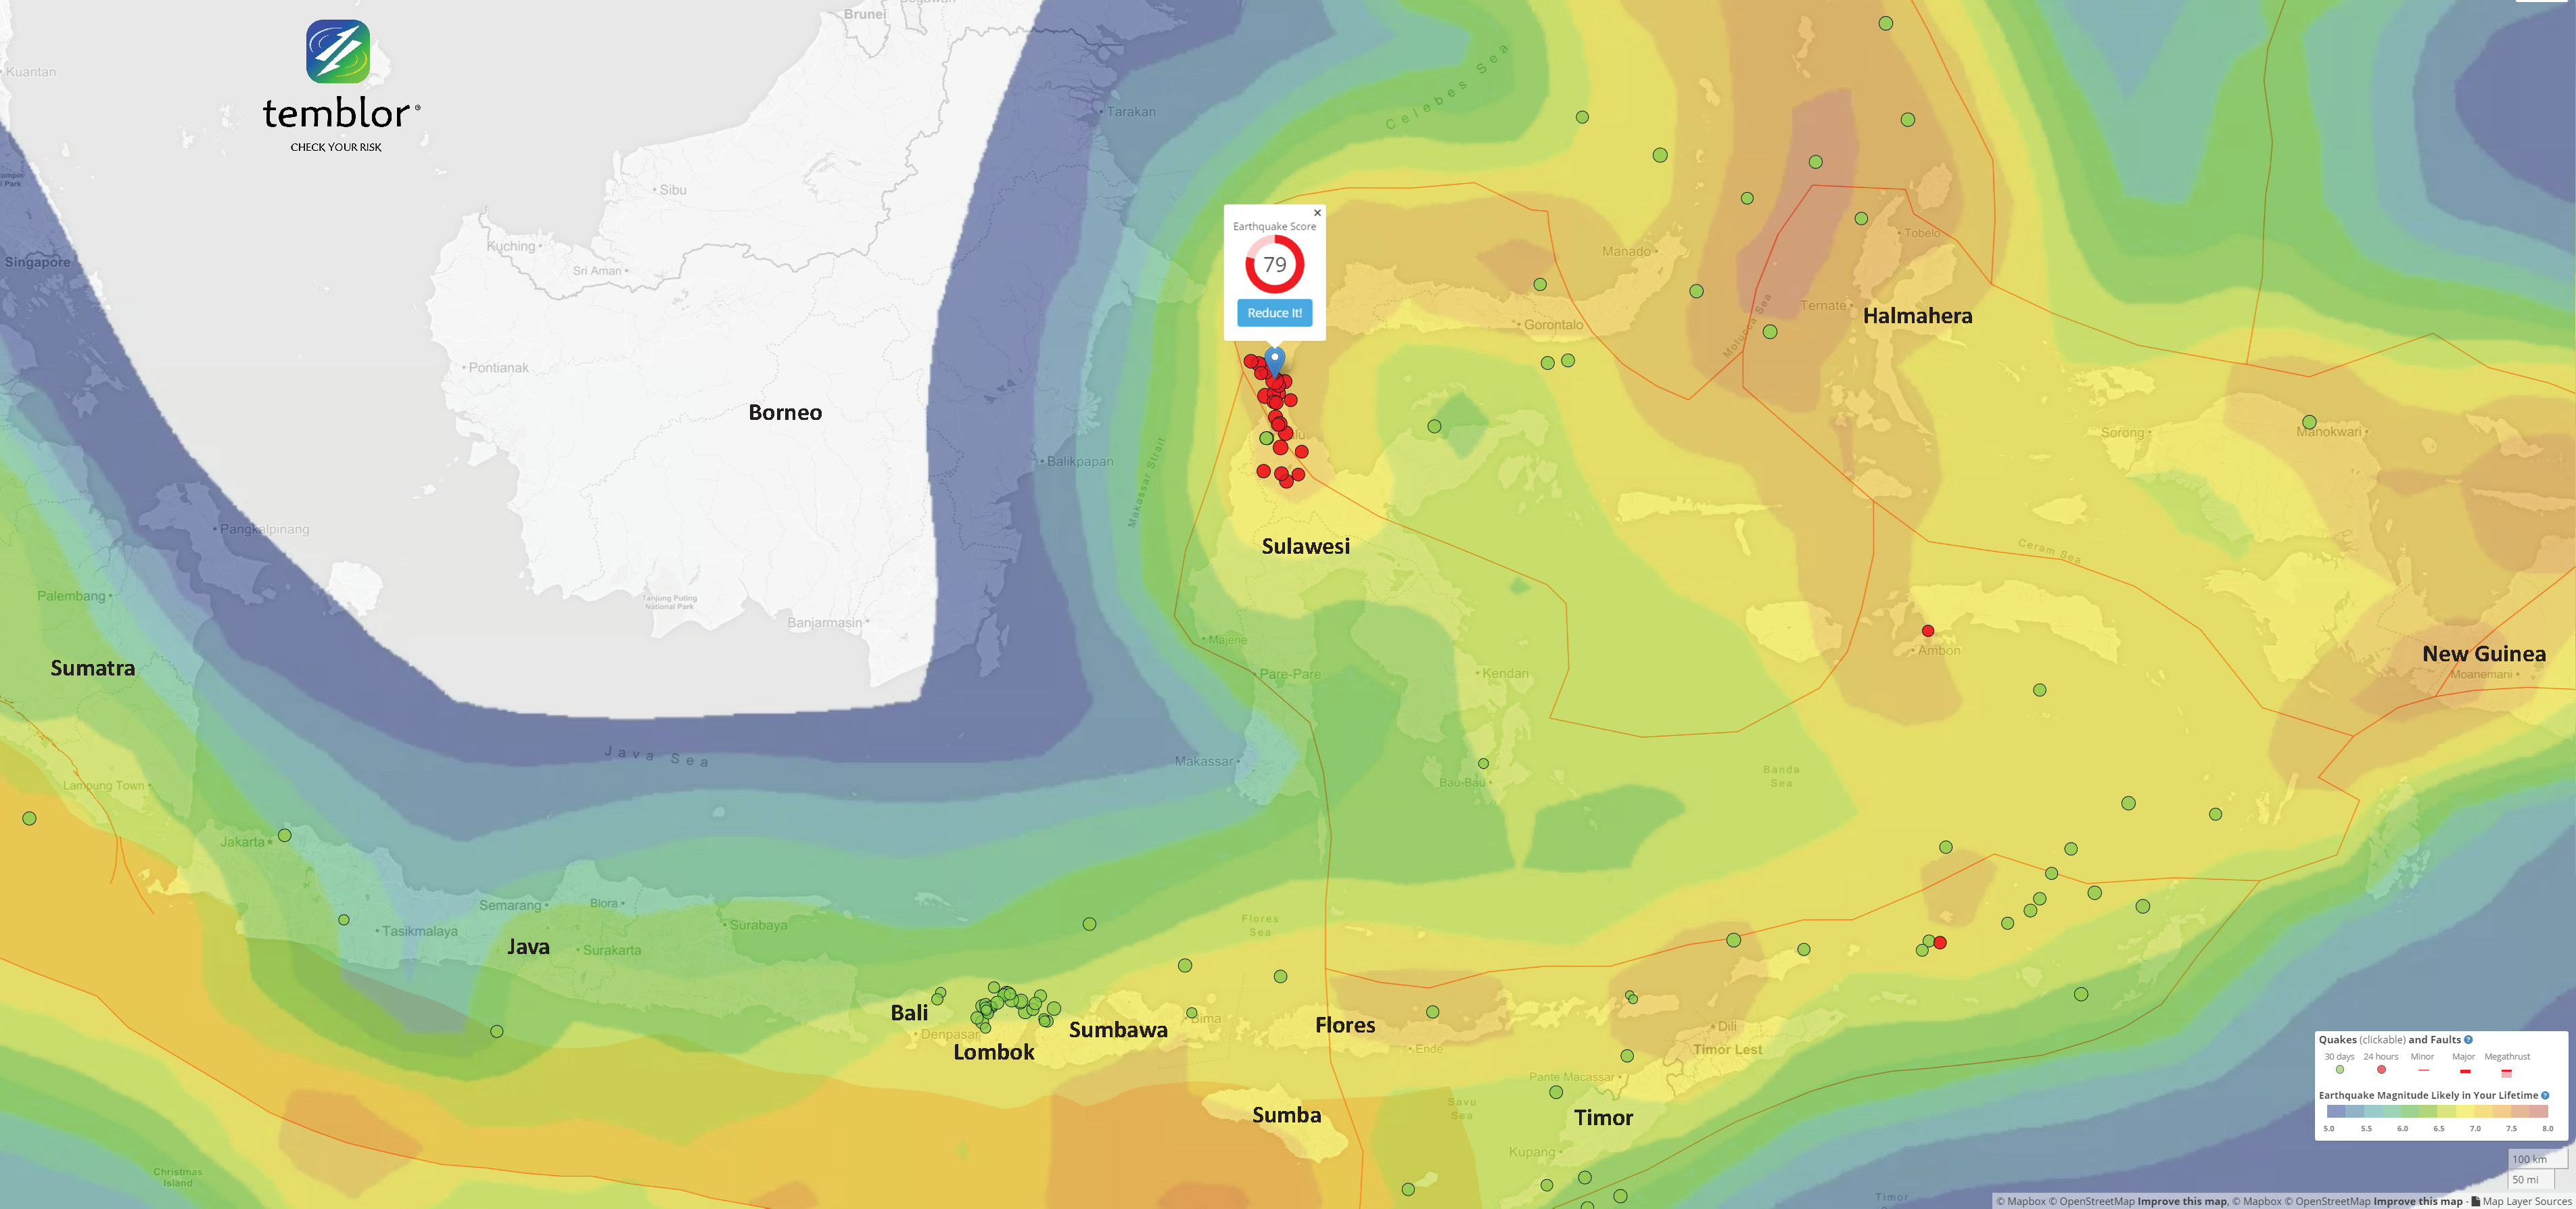
Global Earthquake Activity Rate map for this region of Indonesia. Warmer colors represent regions that are more likely to experience a larger earthquake than the regions with cooler colors. Seismicity from the past is shown and the location of the M 7.5 earthquake is located near the blue teardrop symbol. Earthquake epicenters from the past 24 hours are in red. Note that these earthquakes are aligned in a north-south orientation, the same orientation as the Palu-Kola fault. The ongoing aftershock sequence in Lombok, Indonesia can be seen as well.
2m (7’) high Tsunami
Tsunami can be caused by deformation of the seafloor from earthquakes, displacement of seawater by landslides, and meteorological processes. Most commonly, we associate tsunamigenic earthquakes with subduction zones and thrust faults because these are the types of earthquakes most likely to deform the seafloor, causing the entire water column to be lifted up. Once lifted up, the water column has stored potential energy which gets released when the water falls back down. This water has momentum, so may fall below sea level. As this water gravitationally oscillates vertically, tsunami waves are transmitted radially outwards.
There are observations of tsunami waves with run-up elevations of about 2 meters. Strike-slip earthquakes can generate tsunami if there is sufficient submarine topography that gets offset during the earthquake. Also, if a strike-slip earthquake triggers a landslide, this could cause a tsunami. There do not appear to be tsunami waves recorded on tide gages as posted on the UNESCO Sea Level Monitoring Facility website. This tsunami was probably too small to propagate to the nearest tide gages listed on this webpage. Tsunamigenic landslides generally create tsunami that are highly localized, largely because the displacement of the water column is so localized. It is possible that the M 7.5 earthquake triggered a landslide causing this tsunami, but more work would need to be done to determine if this is true.
Stress change and immediate earthquake potential
The Palu-Kola fault has a high slip rate but with few historic large earthquakes associated with this plate boundary (Bellier et al., 2001). There have been several M>6 earthquakes along this system, including a left-lateral M 6.3 earthquake on 2012.08.18.
Today’s M 7.5 earthquake has changed the stresses within the crust surrounding the earthquake. The amount of this stress change is moderate, especially when compared with the amount of stress that is typically released during an earthquake.
This change in stress is called a change in “static coulomb stress” and a paper that discusses the fundamental factors controlling these stress increases is from Lin and Stein (2004). There is software available to the public from the USGS to perform these calculations. This software is called “Coulomb 3” and is available online here. An introduction to this software and the physics behind the calculations can be found in Stein (2003).
An earthquake occurs when the stress is greater than the strength of the rock. Rocks can have strengths that range dozens of Mega Pascal (1,000,000 Pa = 1 MPa). When earthquakes slip they release stress on the order of several to a dozen MPa. In order for an earthquake to trigger another earthquake due to these changes in stress, the triggered earthquake fault needs to have a pre-existing level of stress that is somewhat close to failure.
Dr. Shinji Toda has calculated the change in static coulomb stress as a result of the M 7.5 earthquake. First heused a computer model to estimate the increased stress that could be observed on a generic fault parallel to the M 7.5 earthquake. Next, he used this model to estimate the increased stress on faults that are represented by historic earthquakes.
Gavin Hayes at the USGS used seismic data to estimate the geometry of the fault that ruptured to produce this M 7.5 earthquake. Dr. Toda used this fault geometry as the source fault for their static coulomb stress modeling.
Below are two figures that show changes in static coulomb stress imparted by the source M 7.5 earthquake onto (1) generic faults parallel to the source fault at depths ranging from 3-18 km and (2) faults that may be oriented similar to historic earthquakes in the region. Dr. Toda plots earthquake mechanisms (moment tensors from the global centroid moment tensor catalog) for historic seismicity in the region. These mechanisms inform us about what types of faults have slipped in this region historically and what types of faults may exist in the region that may rupture again in the future.
The figure on the left shows that there is an increase in stress to the north and south of the earthquake fault, as well as some regions to the northwest and east of the fault. Lobes of blue, the stress shadows, show regions of decreased stress.
The figure on the right shows that some of the representative earthquakes would have an increased amount of stress (the red moment tensors), while other representative earthquakes would have a decreased amount of stress (the blue moment tensors)

Static coulomb stress change imparted by the M 7.5 earthquake onto generic receiver faults that are parallel to the source fault. Red represents regions of increased stress and blue represents regions of decreased stress. The panel on the right shows the stress change imparted on faults that are represented by historic earthquakes as represented by the global Centroid Moment Tensor (gCMT) catalog.
The figures below show the background seismicity for this region, as well as the expected change in seismicity rates as a result of today’s earthquake sequence. On the left is plotted smoothed seismicity rates for the region, considering earthquakes M>4.5 using the gCMT catalog. We can see that this region has a low level of background seismicity.
On the right panel is an estimate of the change in rate of seismicity following the M 7.5 earthquake. Basically, positive changes in coulomb stress increase the background seismicity rates, while negative changes in coulomb stress decrease the background seismicity rates. Note how the increased background seismicity rates align with the regions of increased static coulomb stress in the plots.

Rates of seismicity in the region of Sulawesi, Indonesia. The left panel shows the rate of earthquakes using historic seismicity data. The right panel shows how the rate of earthquakes will change as a result of today’s earthquake sequence.
Take Away:
Today’s M 7.5 earthquake was preceded by several M~5 earthquakes and has had many aftershocks in this magnitude range. There will continue to be aftershocks, which will diminish in magnitude over time following what we know as “Omori’s Law” (Omori, 1894). Omori’s Law dictates that aftershocks will occur following an earthquake and these earthquakes will decay with time based upon material properties of the fault and surrounding crust. There is almost always a chance that this M 7.5 earthquake is a foreshock to a larger earthquake, but because it is quite large for this fault length, it may be near the upper bound. Though, our knowledge is limited by a short time period of historic seismicity observations.
There is an increased chance of having a triggered earthquake elsewhere on the Palu-Kora fault, or other faults, due to an increase in static coulomb stress changes from the M 7.5 earthquake.
References:
Bellier, O., Sebrier, M., Beaudouin, T., Villenueve, M., Braucher, R., Bourles, D., Siame, L., Putranto, E., and Pratomo, I., 2001. High slip rate for a low seismicity along the Palu-Koro active fault in central Sulawesi (Indonesia) in Terra Nova, v. 13, No. 6, p. 463-470
Bellier, O., Sebrier, M., Seward, D., Beaudouin, T., Villenueve, M., and Putranto, E., 2006. Fission track and fault kinematics analyses for new insight into the Late Cenozoic tectonic regime changes in West-Central Sulawesi (Indonesia) in Tectonophysics, v. 413, p. 201-220, doi:10.1016/j.tecto.2005.10.036
Bird, P., Jackson, D. D., Kagan, Y. Y., Kreemer, C., and Stein, R. S., 2015. GEAR1: A global earthquake activity rate model constructed from geodetic strain rates and smoothed seismicity, Bull. Seismol. Soc. Am., v. 105, no. 5, p. 2538–2554, DOI: 10.1785/0120150058
Lin, J., and R. S. Stein (2004), Stress triggering in thrust and subduction earthquakes and stress interaction between the southern San Andreas and nearby thrust and strike-slip faults, J. Geophys. Res., 109, B02303, doi:10.1029/2003JB002607
Omori, F., 1894. On the aftershocks of earthquakes in Journal of the College of Science, Imperial University of Tokyo, v. 7, p. 111–200
Stein, R.S., 2003. Earthquake conversations, Scientific American, v. 288, no. 1, p. 72-79
Socquet, A., W. Simons, C. Vigny, R. McCaffrey, C. Subarya, D. Sarsito, B. Ambrosius, and W. Spakman (2006), Microblock rotations and fault coupling in SE Asia triple junction (Sulawesi, Indonesia) from GPS and earthquake slip vector data, J. Geophys. Res., 111, B08409, doi:10.1029/2005JB003963.
Watkinson, I.M. and Hall, R., 2017. Fault systems of the eastern Indonesian triple junction: evaluation of Quaternary activity and implications for seismic hazards in Cummins, P. R. & Meilano, I. (eds) Geohazards in Indonesia: Earth Science for Disaster Risk Reduction, Geological Society, London, Special Publications, v. 441, https://doi.org/10.1144/SP441.8
More information about the tectonics in this region can be found here.
- Osa Peninsula, Costa Rica: A unique opportunity to drill and instrumentthe seismogenic zone of large megathrust earthquakes - June 4, 2019
- Mexico-Guatemala earthquake, felt by millions, likely triggered by the 2017 megaquake - February 2, 2019
- Fuerte estremecimiento a partir de terremoto en la costa central de Chile: ¿Qué revela acerca del siguiente choque de megafalla? - January 23, 2019