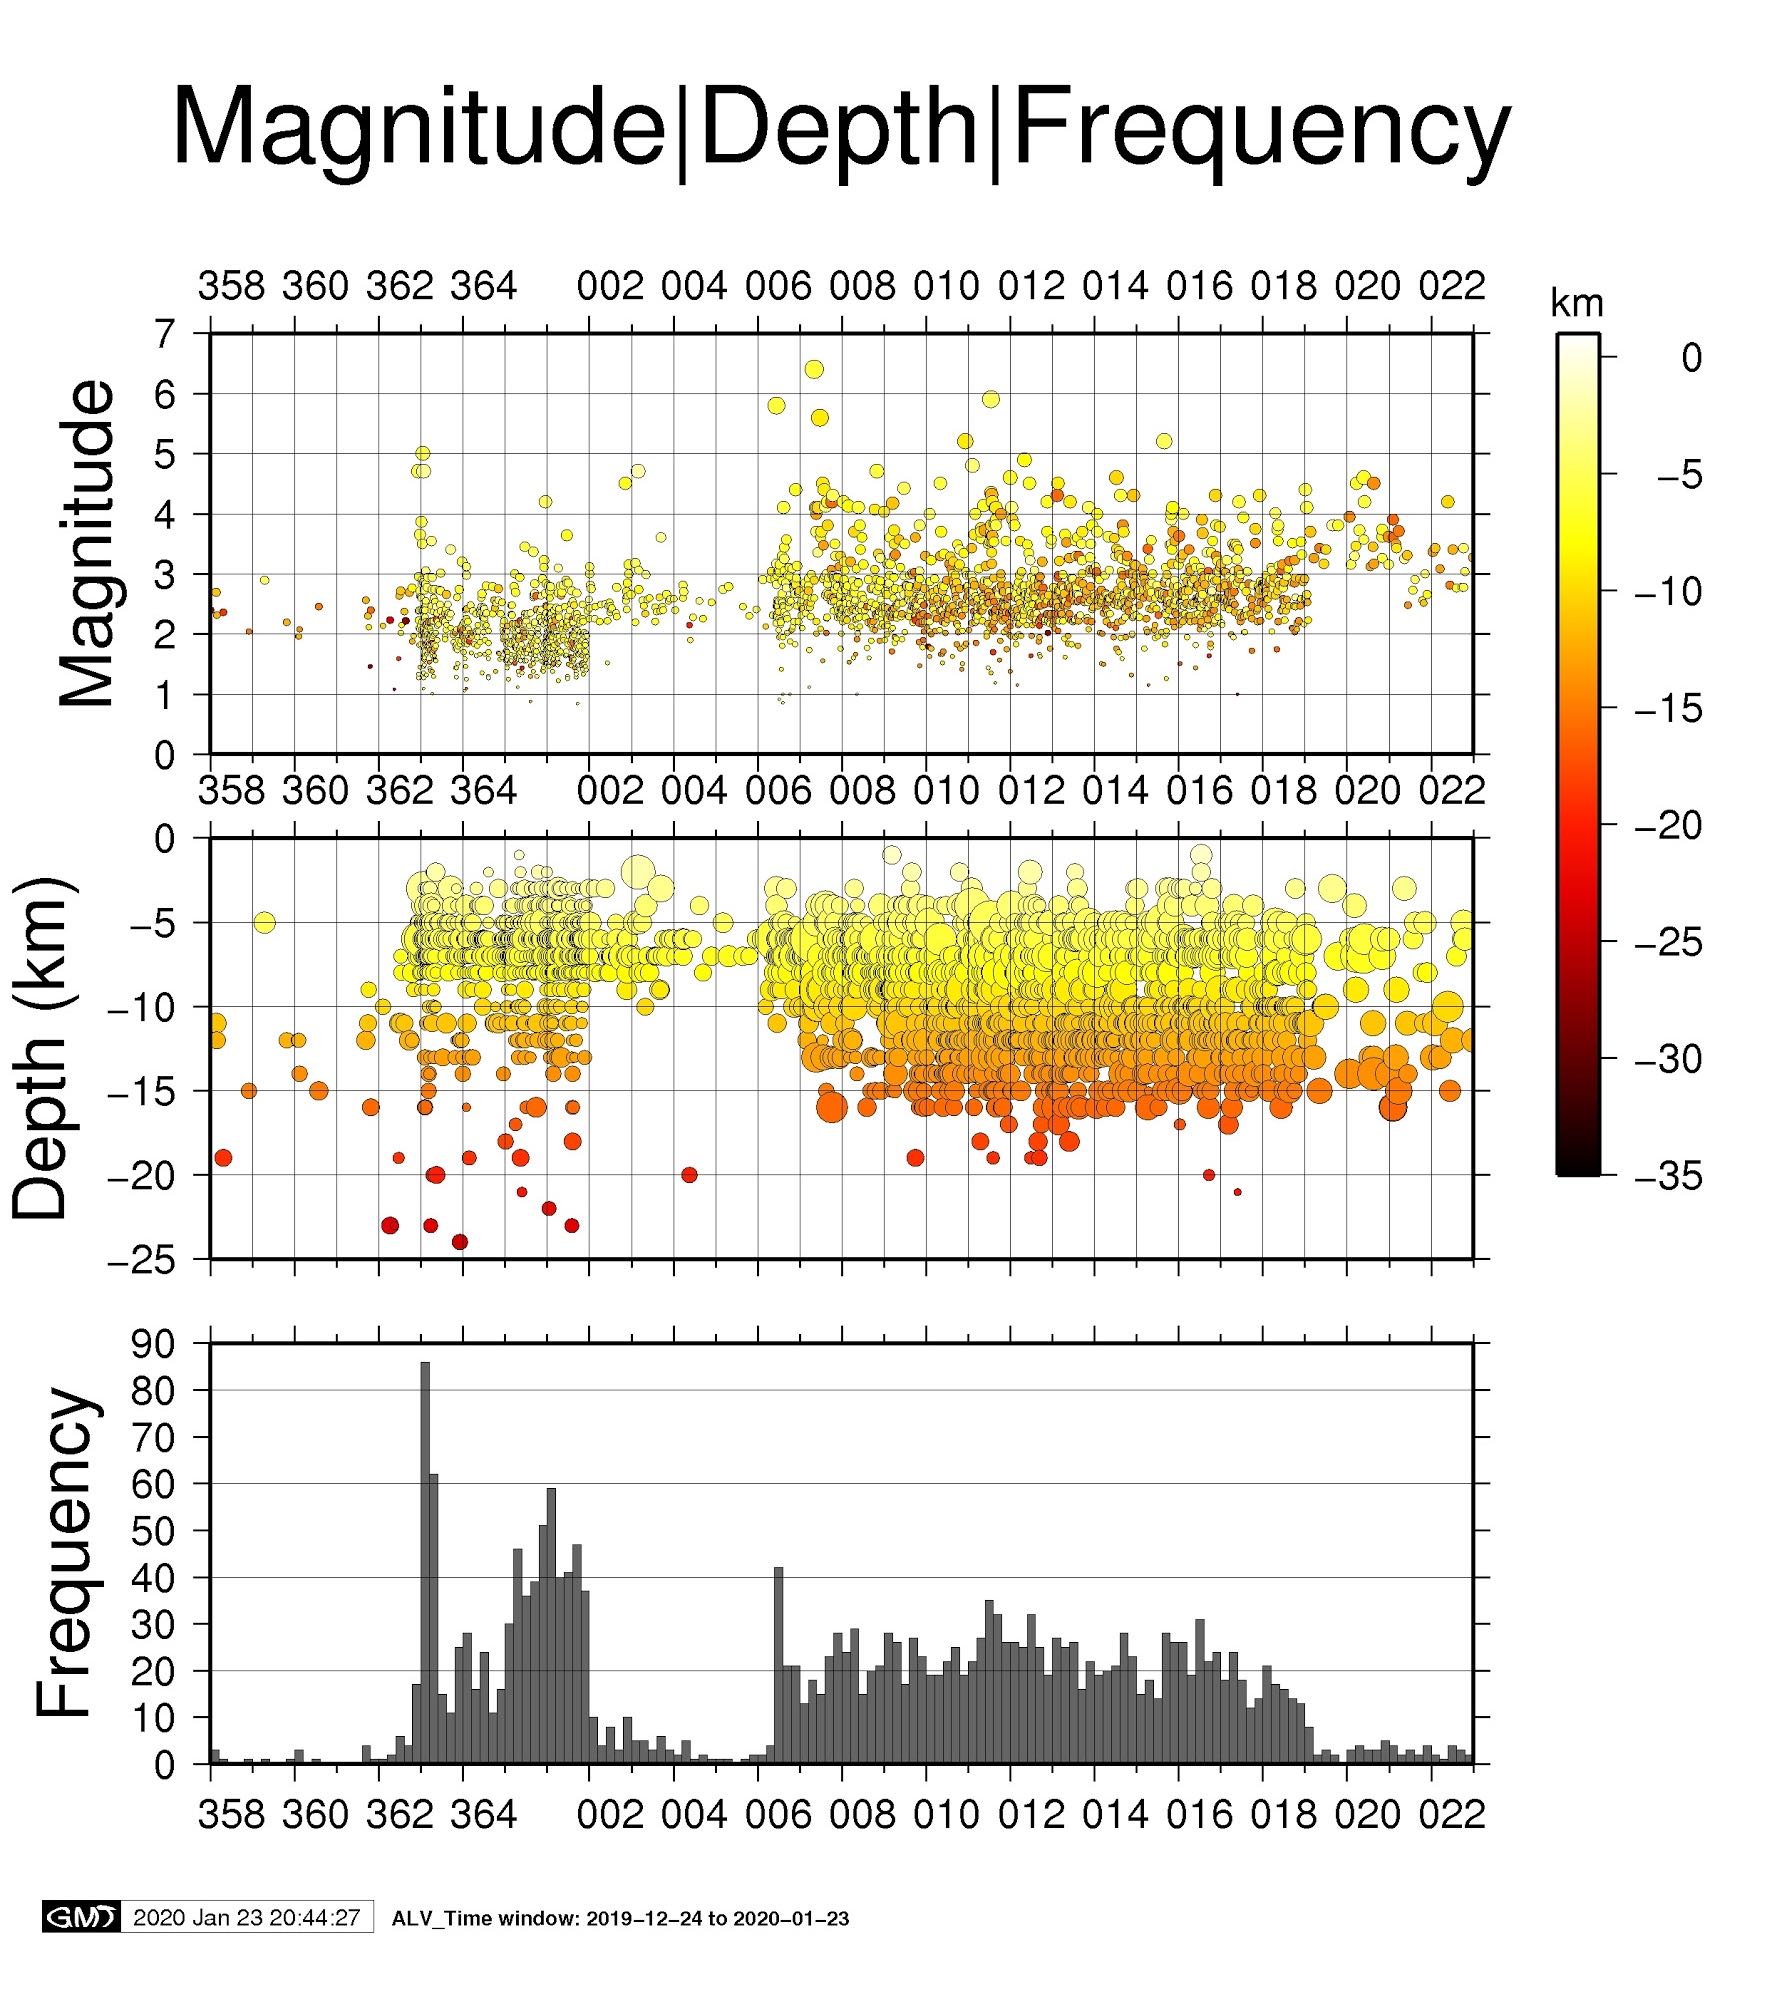
Multiple panel plot showing one month of seismic activity since the onset of the sequence on Dec. 28, 2019. In all panels, the x-axis is labeled with day of the year. For example, Dec. 28 is day 358 of 2019, and so on. Bottom panel shows a histogram of events per day. Middle and top panels shows depth and magnitude distribution, respectively. Color of each circle corresponds to the depth of the event following the color bar on the right. The magnitude of the event is given by the size of the circle. Clearly visible are windows showing the lack of completeness of the seismic record (Jan. 2 and Jan. 19). Because there are thousands of microseismic events, and priority is given to felt events, these windows reflect the backlog of data that need to be processed by analysts for the Puerto Rico Seismic Network. As time permits, the record will be revisited and completed.
- Living through the Loma Prieta earthquake - October 21, 2021
- The Great Quake Debate: an interview with seismologist and author Susan Hough - August 27, 2020
- Salton Sea Swarm quiets down - August 12, 2020