Jason R. Patton, Ph.D., Ross Stein, Ph.D., Volkan Sevilgen, M.Sc.
This U.S. government report written principally by federal agency scientists and their collaborators, argues that it is extremely likely that “human influence has been the dominant cause of the observed warming since the mid-20th century. For the warming over the last century, there is no convincing alternative explanation supported by the extent of the observational evidence.” Further, future outcomes range from some warming and extreme weather, to enormous warming and extreme weather becoming the norm.
Climate Science Special Report (CSSR): Why do we study climate change?
The topic of climate change and how people have altered the rates of climate change is one of the most important subjects of our lifetimes. The U.S. Global Climate Change Research Program recently published the 4th National Climate Assessment that reviews the state of the science regarding climate changes and the physical impacts from these changes. Climate is the statistics of weather over long periods of time (e.g. 30 years). Climate change is a “change in the statistical distribution of weather patterns when that change lasts for an extended period of time.”
This report is designed to help support efforts to “assess climate-related risks and inform decision-making about responses.”
Risk is the overlay of hazards and the peoples’ exposure to those hazards. Learn more about your exposure to natural hazards at temblor.net.
Decision making processes happen in places where public policy is developed and where consumer dollars are spent. Public policy can exert pressure to change how we respond to climate change. How we spend money has the biggest effect on how we, as individuals, can affect future climate change.
There are 6 major themes from the report and we review each of these briefly. The fact-based scientific foundation for the findings of these 6 themes is called a “Traceable Account.” These six themes are explained in more detail within the executive summary here.
We helped create this problem through our emissions of greenhouse gasses like carbon dioxide. The following figure shows why. This seems like a complicated figure, but with a short explanation, we can all understand the basics.
Below we see a comparison between observations of historic temperatures and global climate model results. The figures each have 2 types of data. The thick gray lines are actual observations of temperature through time. The wide colored orange or blue line represents the average temperature from computer models (the very wide band of color shows the entire range of the model results). The difference between these two figures is that the models using only naturally caused climate change (“forcing”) is in the thick blue line on the right panel, and the models that used both natural and anthropogenic caused change is colored orange.
The conclusion we can make from this comparison is that the observed temperatures cannot be explained by natural climate causes alone. In other words, the observed temperatures can only be explained if we include the effects from people. Learn more about the science behind this figure in chapter 3.

Temperature change through time. Temperature observations and computer output for climate models that include (B) only naturally caused change (blue) compared with (A) models that also incorporate human caused change (orange). (modified from IPCC, 2013; figure 10.1)
Global and U.S. Temperatures Continue to Rise
One of the basic foundations of our knowledge about climate change is the change in temperature on Earth. This knowledge was first hypothesized in the late 19th century and our ability to quantify the changes in temperature through time and space have only improved since then. Below is a figure that shows temperature anomalies through time and the global change in temperature as measured at the Earth’s surface.
Temperature anomalies are differences in temperature from an average baseline temperature (here the average temperature for the period 1901-1960). The plot on the left shows that these temperature anomalies are trending upwards (warmer).
Surface temperatures are measured across the globe and the map on the right shows how these temperatures have increased relative to the same time period. These two figures summarize that the global climate has increased by more than 1.2° F (0.7° C) for the period of 1986-2016 relative to 1901-1960. Notice that the largest increases tend to occur in continental interiors because the oceans can absorb heat more efficiently than the land.

On left, Red bars show temperatures that were above the 1901–1960 average, and blue bars indicate temperatures below the average. On the right, Surface temperature change (in °F) for the period 1986–2016 relative to 1901–1960. (from Wuebbles et al., 2017)
Future Climate Scenarios
Projections of future climate change are based on a range of plausible conditions. These projections were generated and published in the Intergovernmental Panel on Climate Change (IPCC) assessment report, most recently published in 2013/2014 (IPCC, 2013). The projections are results from global climate models based on a range of possible global carbon emissions. The scenario that projects emissions on track with our current trajectory (the worst case scenario) is labeled RCP8.4. The scenario that projects emissions on track with a proposed lower level of emissions is labeled RCP2.6.
Our path forward will be warmer regardless of our actions to reduce carbon emissions. This is because of how the atmosphere and oceans have stored, or have increased the ability to store, heat. The figure below shows the projected global carbon emissions (on the left) and the resulting projected global temperatures for each of these scenarios (on the right). Note how larger carbon emissions lead to higher projected temperatures. As a global and local society, we are faced with a future that will either be much worse than it is today, or only a little bit worse.

Annual historical and a range of plausible future carbon emissions in units of gigatons of carbon (GtC) per year (left) and the historical observed and future temperature change that would result for a range of future scenarios relative to the 1901–1960 average, based on the central estimate (lines) and a range (shaded areas, two standard deviations) as simulated by the full suite of CMIP5 global climate models (right) (from Wuebbles et al., 2017).
Temperature and Precipitation Extremes are Becoming More Common
From Wuebbles et al. (2017):
Temperature and precipitation extremes can affect water quality and availability, agricultural productivity, human health, vital infrastructure, iconic ecosystems and species, and the likelihood of disasters. Some extremes have already become more frequent, intense, or of longer duration, and many extremes are expected to continue to increase or worsen, presenting substantial challenges for built, agricultural, and natural systems. Some storm types such as hurricanes, tornadoes, and winter storms are also exhibiting changes that have been linked to climate change, although the current state of the science does not yet permit detailed understanding.
The figure below shows both the observations of increased precipitation extremes as well as the projections of these precipitation extremes into the future. On the left is a series of maps that show how the average daily precipitation has increased over the period 1948-2015. The baseline in this case is the amount of precipitation that occurs on average every 20 years.
On the right is a series of maps that show how these same averages are projected into the future, using the lower emissions and higher emissions scenarios. The change is measured in % change relative to the baseline period. Learn more about precipitation change in the U.S. in chapter 7.
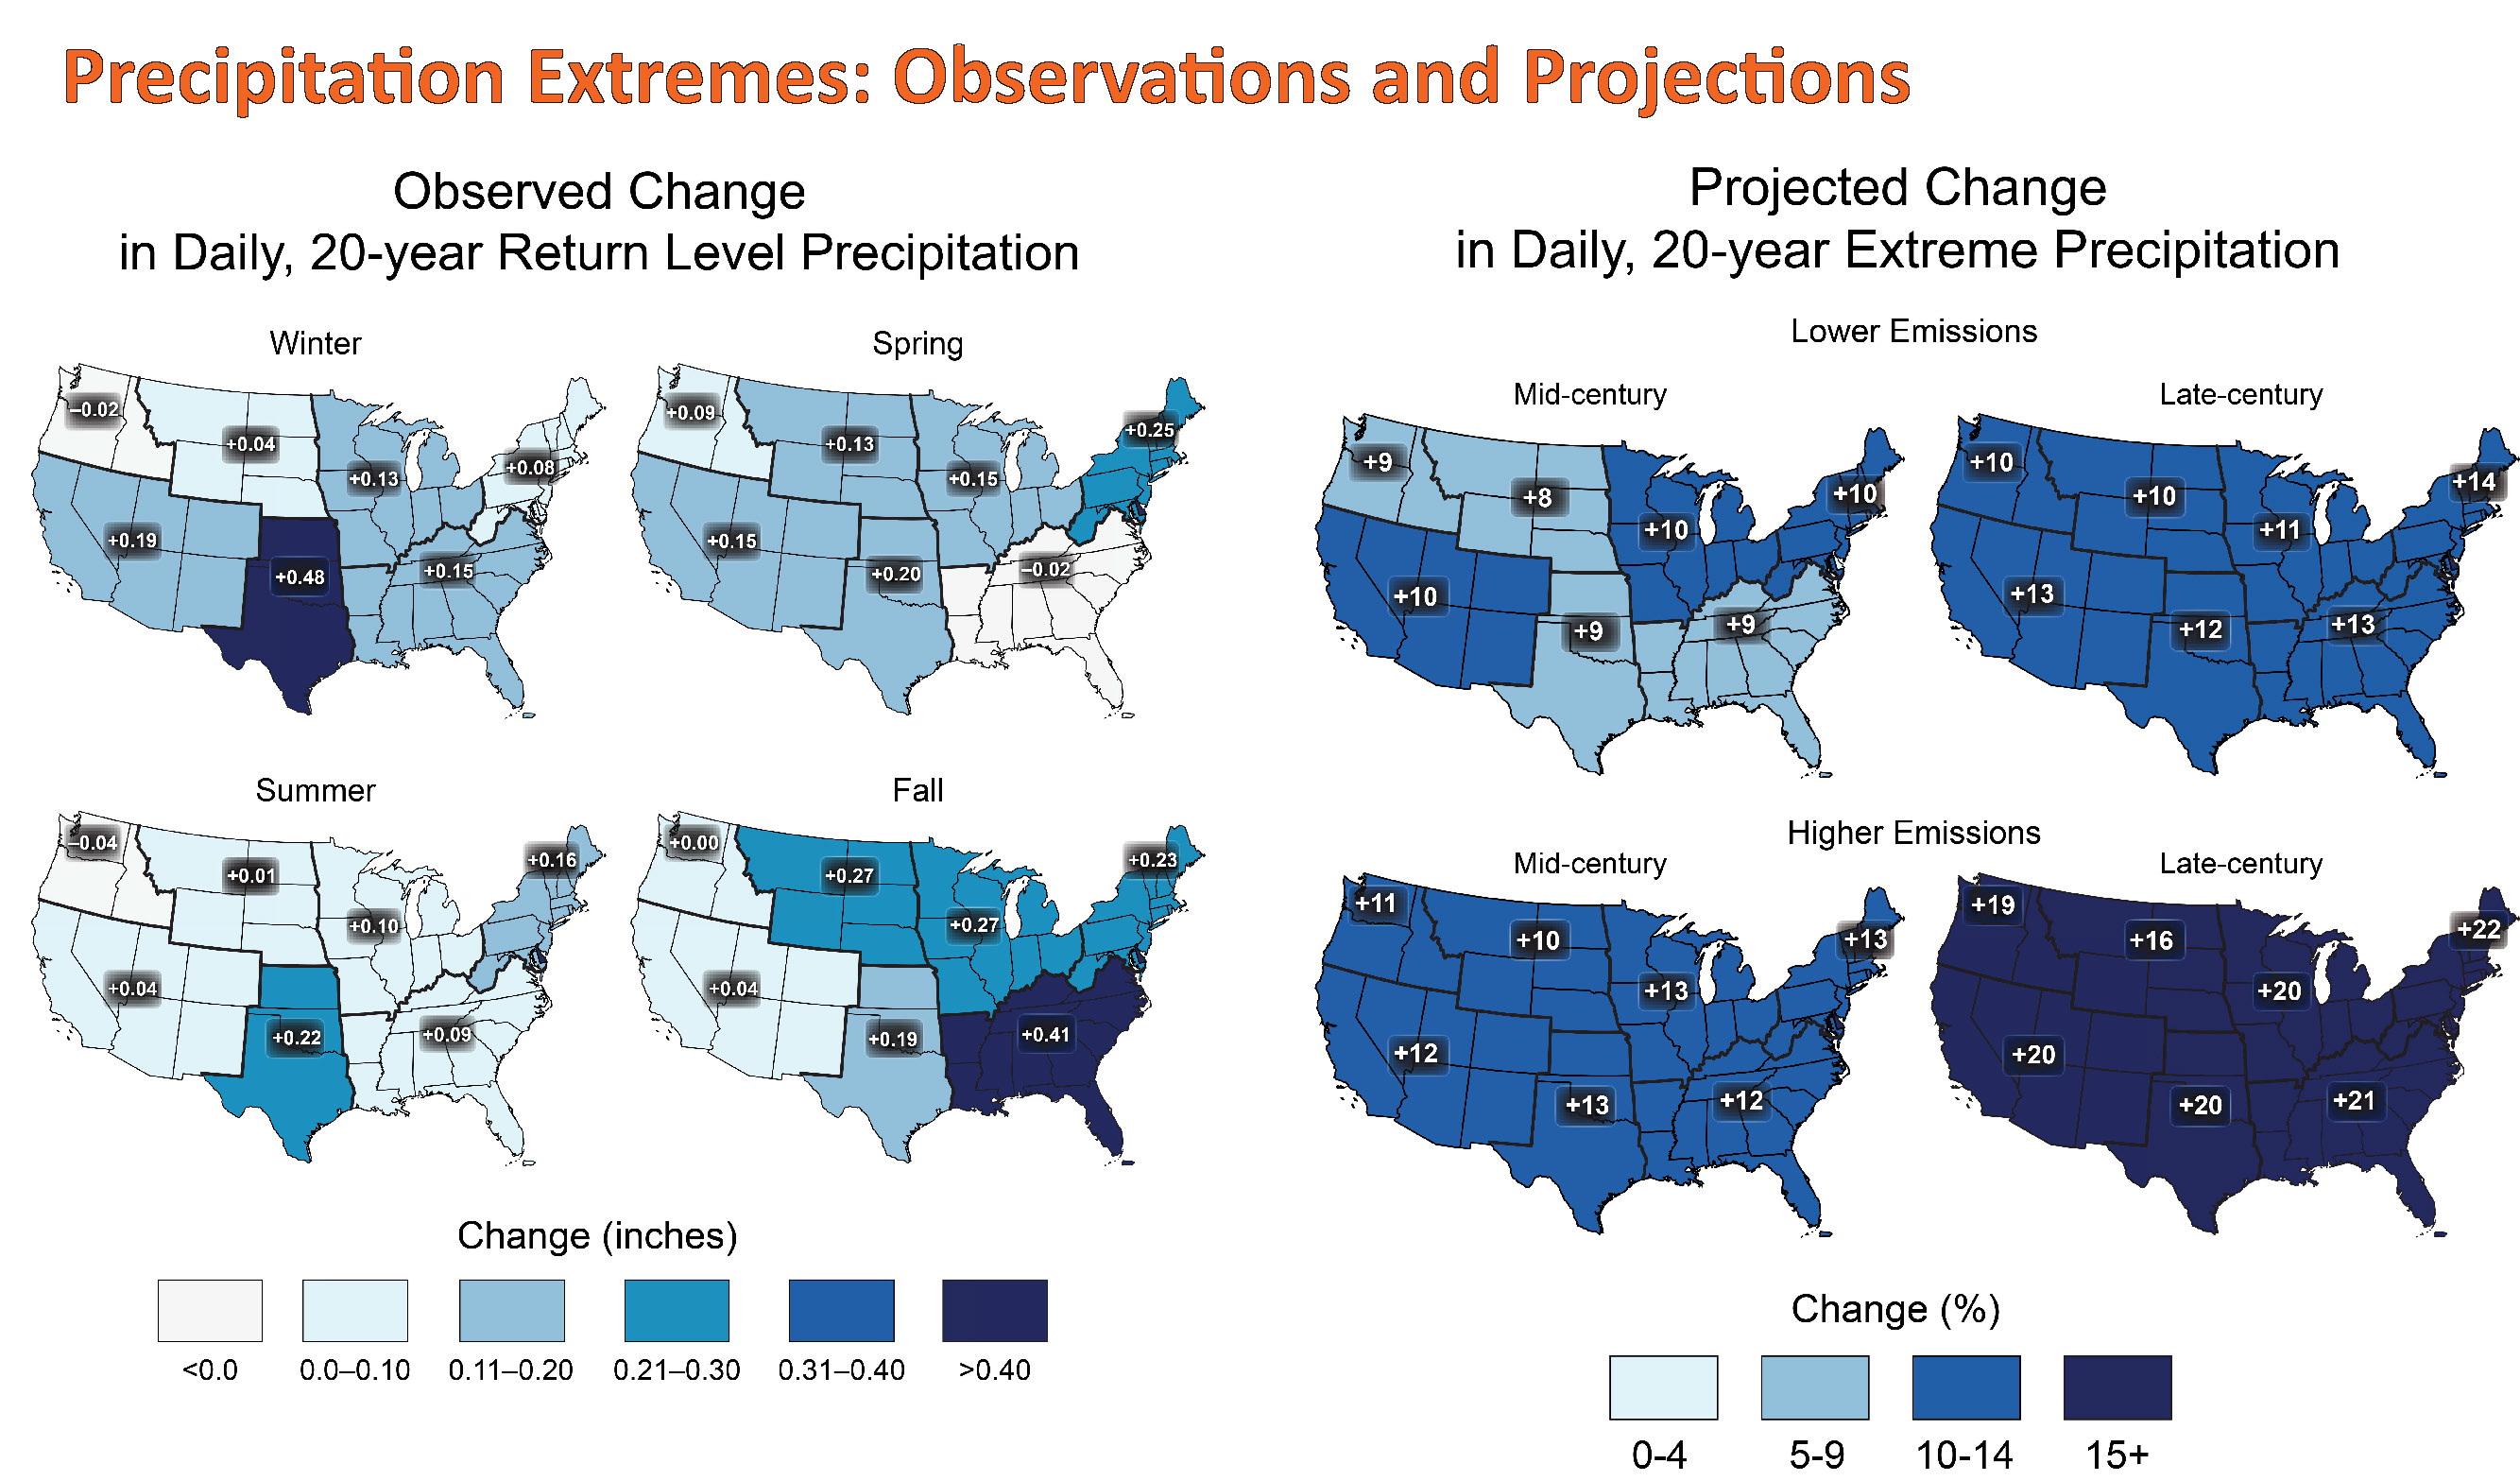
(left) The observed changes in the seasonal daily precipitation from storms that may occur on a 20 year average (read more about the technical definition of a “20 year storm” in USGCRP, 2017). Adapted from Kunkel et al. (2013). (right) Projected changes for this same “20 year storm” for the mid-century and late 21st century. The upper panel represents a lower carbon emissions scenario RCP4.5. The upper panel represents the highest scenario RCP8.5. (from USGCRP, 2017)
Additional major findings are also summarized in the report:
Oceans are Warming, Rising, and Becoming More Acidic
The global ocean has increased in heat content at all depths since the mid-20th century and surface waters have warmed by about 1.3° F (0.7° C) over the past century.
The melting of glacial ice and the thermal expansion of the ocean are causing sea level rise rates to increase at a rate higher than has been observed in the past 2,800 years. This sea level rise will likely result in the flooding of land where millions of people currently live. If these conditions continue, there will also be an increase in coastal flooding associated with coastal storms such as hurricanes. Because of the increase in heat in the ocean, these hurricanes will also be more intense (so this is a double blow to those living in low lying areas along the coast).
The increase in concentration of carbon dioxide emitted since the beginning of the industrial revolution has resulted in an increase in concentration of carbon dioxide in the seawater. This carbon dioxide has caused seawater to become more acidic, making it more difficult for organisms (like oysters) to construct shells. Read more about the changes in the global ocean in chapter 12 (sea level rise) and chapter 13 (ocean acidification).
Climate Change in Alaska and across the Arctic are Outpacing Global Climate Change
With a very high confidence, “Annual average near-surface air temperatures across Alaska and the Arctic have increased over the last 50 years at a rate more than twice as fast as the global average temperature.” Read more about this in chapter 11.
Limiting Warming to 2 C (3.6 F) Will Require Major Reductions in Emissions
Human activities are the major cause for the observed trends in the changing climate. The changes that we make today will determine the magnitude of climate change risks far into the future (centuries to millennia). Read more about this and how we can mitigate these changes in chapter 14.
Possibility of Unanticipated Changes
As highlighted in the executive summary (Wuebbles et al., 2017), “Unanticipated and difficult or impossible-to-manage changes in the climate system are possible throughout the next century as critical thresholds are crossed and/or multiple climate-related extreme events occur simultaneously.” Read more about how we might respond or mitigate these potential surprises in chapter 15.
Definitions
Traceable Accounts: “Traceable Accounts for each Key Finding 1) document the process and rationale the authors used in reaching the conclusions in their Key Finding, 2) provide additional information to readers about the quality of the information used, 3) allow traceability to resources and data, and 4) describe the level of likelihood and confidence in the Key Finding.”
Confidence and Likelihood:
Confidence in the validity of a finding based on the type, amount, quality, strength, and consistency of evidence (such as mechanistic understanding, theory, data, models, and expert judgment); the skill, range, and consistency of model projections; and the degree of agreement within the body of literature.
Likelihood, or probability of an effect or impact occurring, is based on measures of uncertainty expressed probabilistically (based on the degree of understanding or knowledge, e.g., resulting from evaluating statistical analyses of observations or model results or on expert judgment).
Here is a graphical summary of the terms regarding confidence level and likelihood (Wuebbles et al., 2017):

This summary shows how confidence levels and likelihood statements are used in the NCA4 (USGCRP, 2017; Wuebbles et al., 2017).
References
IPCC, 2013. Climate Change 2013: The Physical Science Basis. Contribution of Working Group I to the fifth Assessment Report of the Intergovernmental Panel on Climate Change. Cambridge University Press, Cambridge, UK and New York, NY, 1535 pp. http://www.climatechange2013.org/report/
Kunkel, K. E. et al., 2013. Monitoring and understanding trends in extreme storms: State of knowledge. Bulletin of the American Meteorological Society, v. 94, p. 499-514, doi:10.1175/BAMS-D-11-00262.1.
USGCRP, 2017. Climate Science Special Report: Fourth National Climate Assessment, Volume I [Wuebbles, D.J., D.W. Fahey, K.A. Hibbard, D.J. Dokken, B.C. Stewart, and T.K. Maycock (eds.)]. U.S. Global Change Research Program, Washington, DC, USA, 470 pp., doi: 10.7930/J0J964J6.
Wuebbles, D.J., D.W. Fahey, K.A. Hibbard, B. DeAngelo, S. Doherty, K. Hayhoe, R. Horton, J.P. Kossin, P.C. Taylor, A.M. Waple, and C.P. Weaver, 2017. Executive Summary of the Climate Science Special Report: Fourth National Climate Assessment, Volume I [Wuebbles, D.J., D.W. Fahey, K.A. Hibbard, D.J. Dokken, B.C. Stewart, and T.K. Maycock (eds.)]. U.S. Global Change Research Program, Washington, DC, USA, 26 pp.
- Osa Peninsula, Costa Rica: A unique opportunity to drill and instrumentthe seismogenic zone of large megathrust earthquakes - June 4, 2019
- Mexico-Guatemala earthquake, felt by millions, likely triggered by the 2017 megaquake - February 2, 2019
- Fuerte estremecimiento a partir de terremoto en la costa central de Chile: ¿Qué revela acerca del siguiente choque de megafalla? - January 23, 2019