By Alka Tripathy-Lang, Ph.D. (@DrAlkaTrip)
Since Taal began erupting last week, satellite images show surface movement around the volcano. Such rainbow imagery has flummoxed Twitter users.
Citation: Alka Tripathy-Lang (2020), Philippine volcano Taal erupts with a fury of earthquakes and ash, Temblor, http://doi.org/10.32858/temblor.067
Video of the PHIVOLCS IP camera at Crater Lake, on Volcano Island, in Lake Taal. The beginning of the eruption was captured at 5-minute intervals from 1 p.m. to 3 p.m. local time, at which point the camera was overcome by the eruption. Credit: PHIVOLCS
Before Sunday, Jan. 12, the Philippine volcano Taal was at Alert Level 1, out of 5, indicating a low level of abnormal activity. At 1 p.m. local time, the Philippines Institute of Volcanology and Seismology, PHIVOLCS, began to raise the alert level, and by 7:30 p.m. that day, they issued an Alert Level 4, indicating that a hazardous explosive eruption is possible within hours to days, highlighting the rapidity with which Taal’s unrest turned to eruption. Alert Level 4 remains in effect as of this writing.
The UN Office for the Coordination of Humanitarian Affairs estimates a population of at least 450,000 in the 14-kilometer-radius danger zone around Taal Main Crater. PHIVOLCS has expanded the danger zone to include people in the Pansipit River Valley southwest of Taal Lake where fissuring has been observed. As of this writing, the National Disaster Risk Reduction and Management Council (NDRRMC) report almost 145,000 people in evacuation centers, and an additional 111,000 people “served outside” the evacuation centers. PHIVOLCS most recently reported that as of 5 a.m. on Jan. 22, “there were no ash emissions.” However, ash has been “remobilized and transported by strong low-level winds,” and residents near Taal are “advised to guard against the effects of heavy and prolonged ashfall.”
The ground shakes and splits
Since 1 p.m. on Jan. 12, PHIVOLCS reports that the Philippine Seismic Network recorded a total of 718 volcanic earthquakes around Taal, of which 176 were felt by the population. The denser and more local Taal Volcano Network records small earthquakes undetectable by the national network, with 673 earthquakes recorded in 24 hours, between Jan. 19-20, and 488 earthquakes reported between Jan. 20-21. PHIVOLCS says that “such intense seismic activity likely signifies continuous magmatic intrusion beneath the Taal edifice, which may lead to further eruptive activity.”
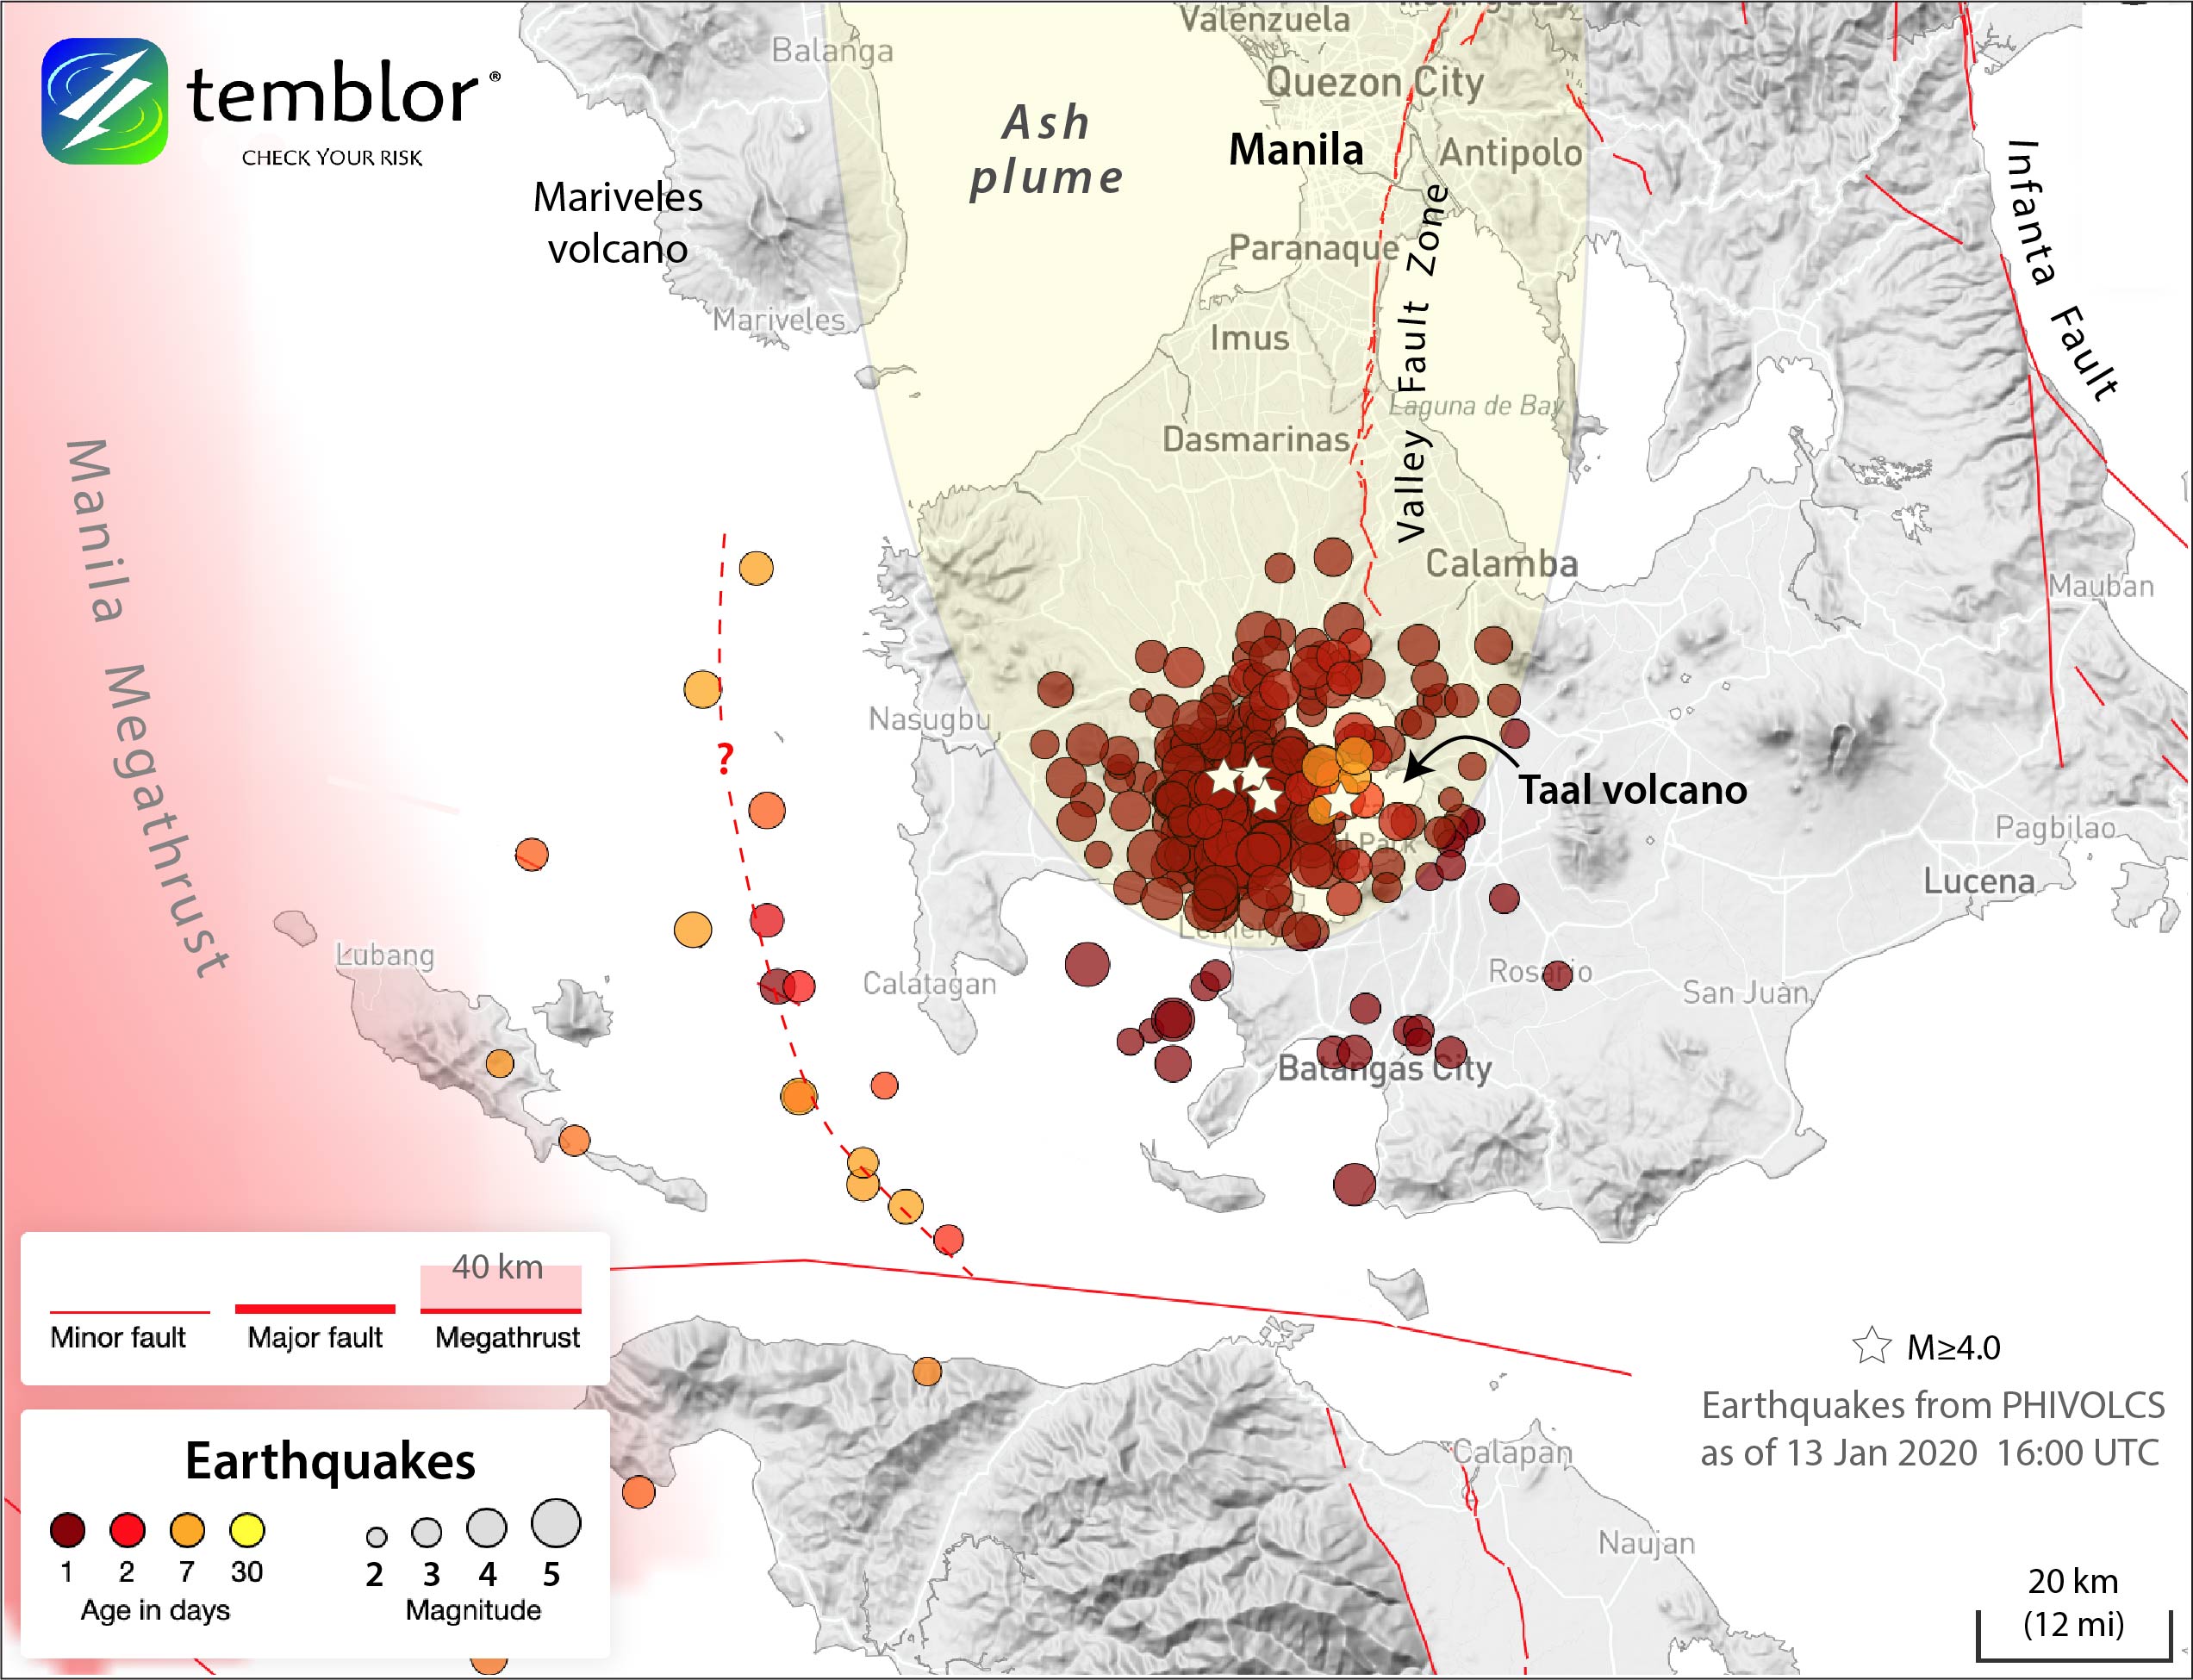
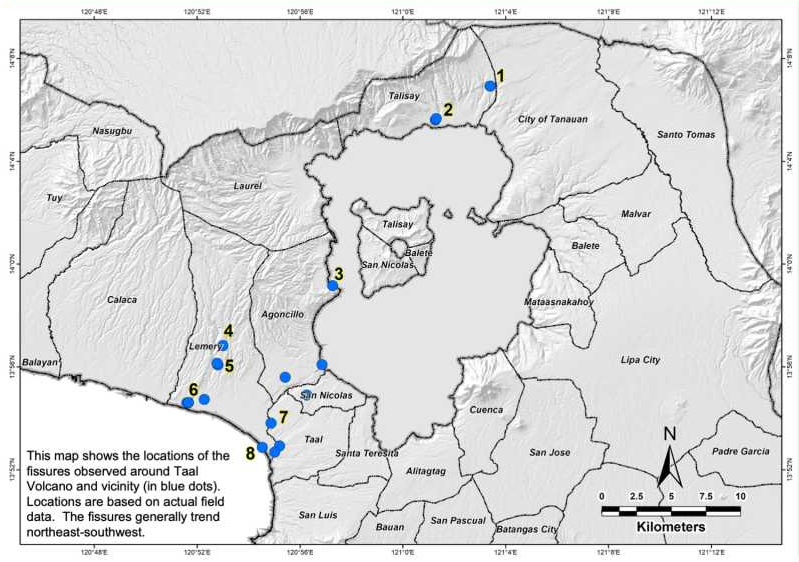
In places around Taal Lake, the ground has been ripped apart by fissures, which tell scientists that something is causing the ground to shift and change rather dramatically. These fissures can be hazardous, particularly when they cut across roads or through people’s homes.

Rainbow satellite data
Scientists have several tools at their disposal for looking at ground deformation, which is how the ground changes over time. One method—interferometric synthetic aperture radar, or InSAR—yields striking images of rainbows radiating away from Lake Taal that have captivated and confused segments of social media.
Eric Fielding, a geophysicist at NASA’s Jet Propulsion Laboratory (JPL) explains, “InSAR is a way to subtract one radar image from another radar image” to measure how the ground surface changes between the images. That change is called displacement. Fielding continues, “With the two satellites of the Copernicus Sentinel-1 [mission of the European Space Agency], it is possible to get an image every 6 days,” which means that ground deformation can be measured approximately weekly.

InSAR can “see through” most types of clouds day or night, which are “two big advantages during a volcanic crisis,” according to the U.S. Geological Survey (USGS).
Of course, it’s not quite so simple as comparing two radar images. The total interference is a sum of the ground displacement (what we want), topography, satellite orbit complexities, and atmospheric effects. In the “raw” Taal interferogram, Fielding says, “the topography and satellite orbit effects [have been] removed, [but] atmospheric effects are still present.”
Counting fringes
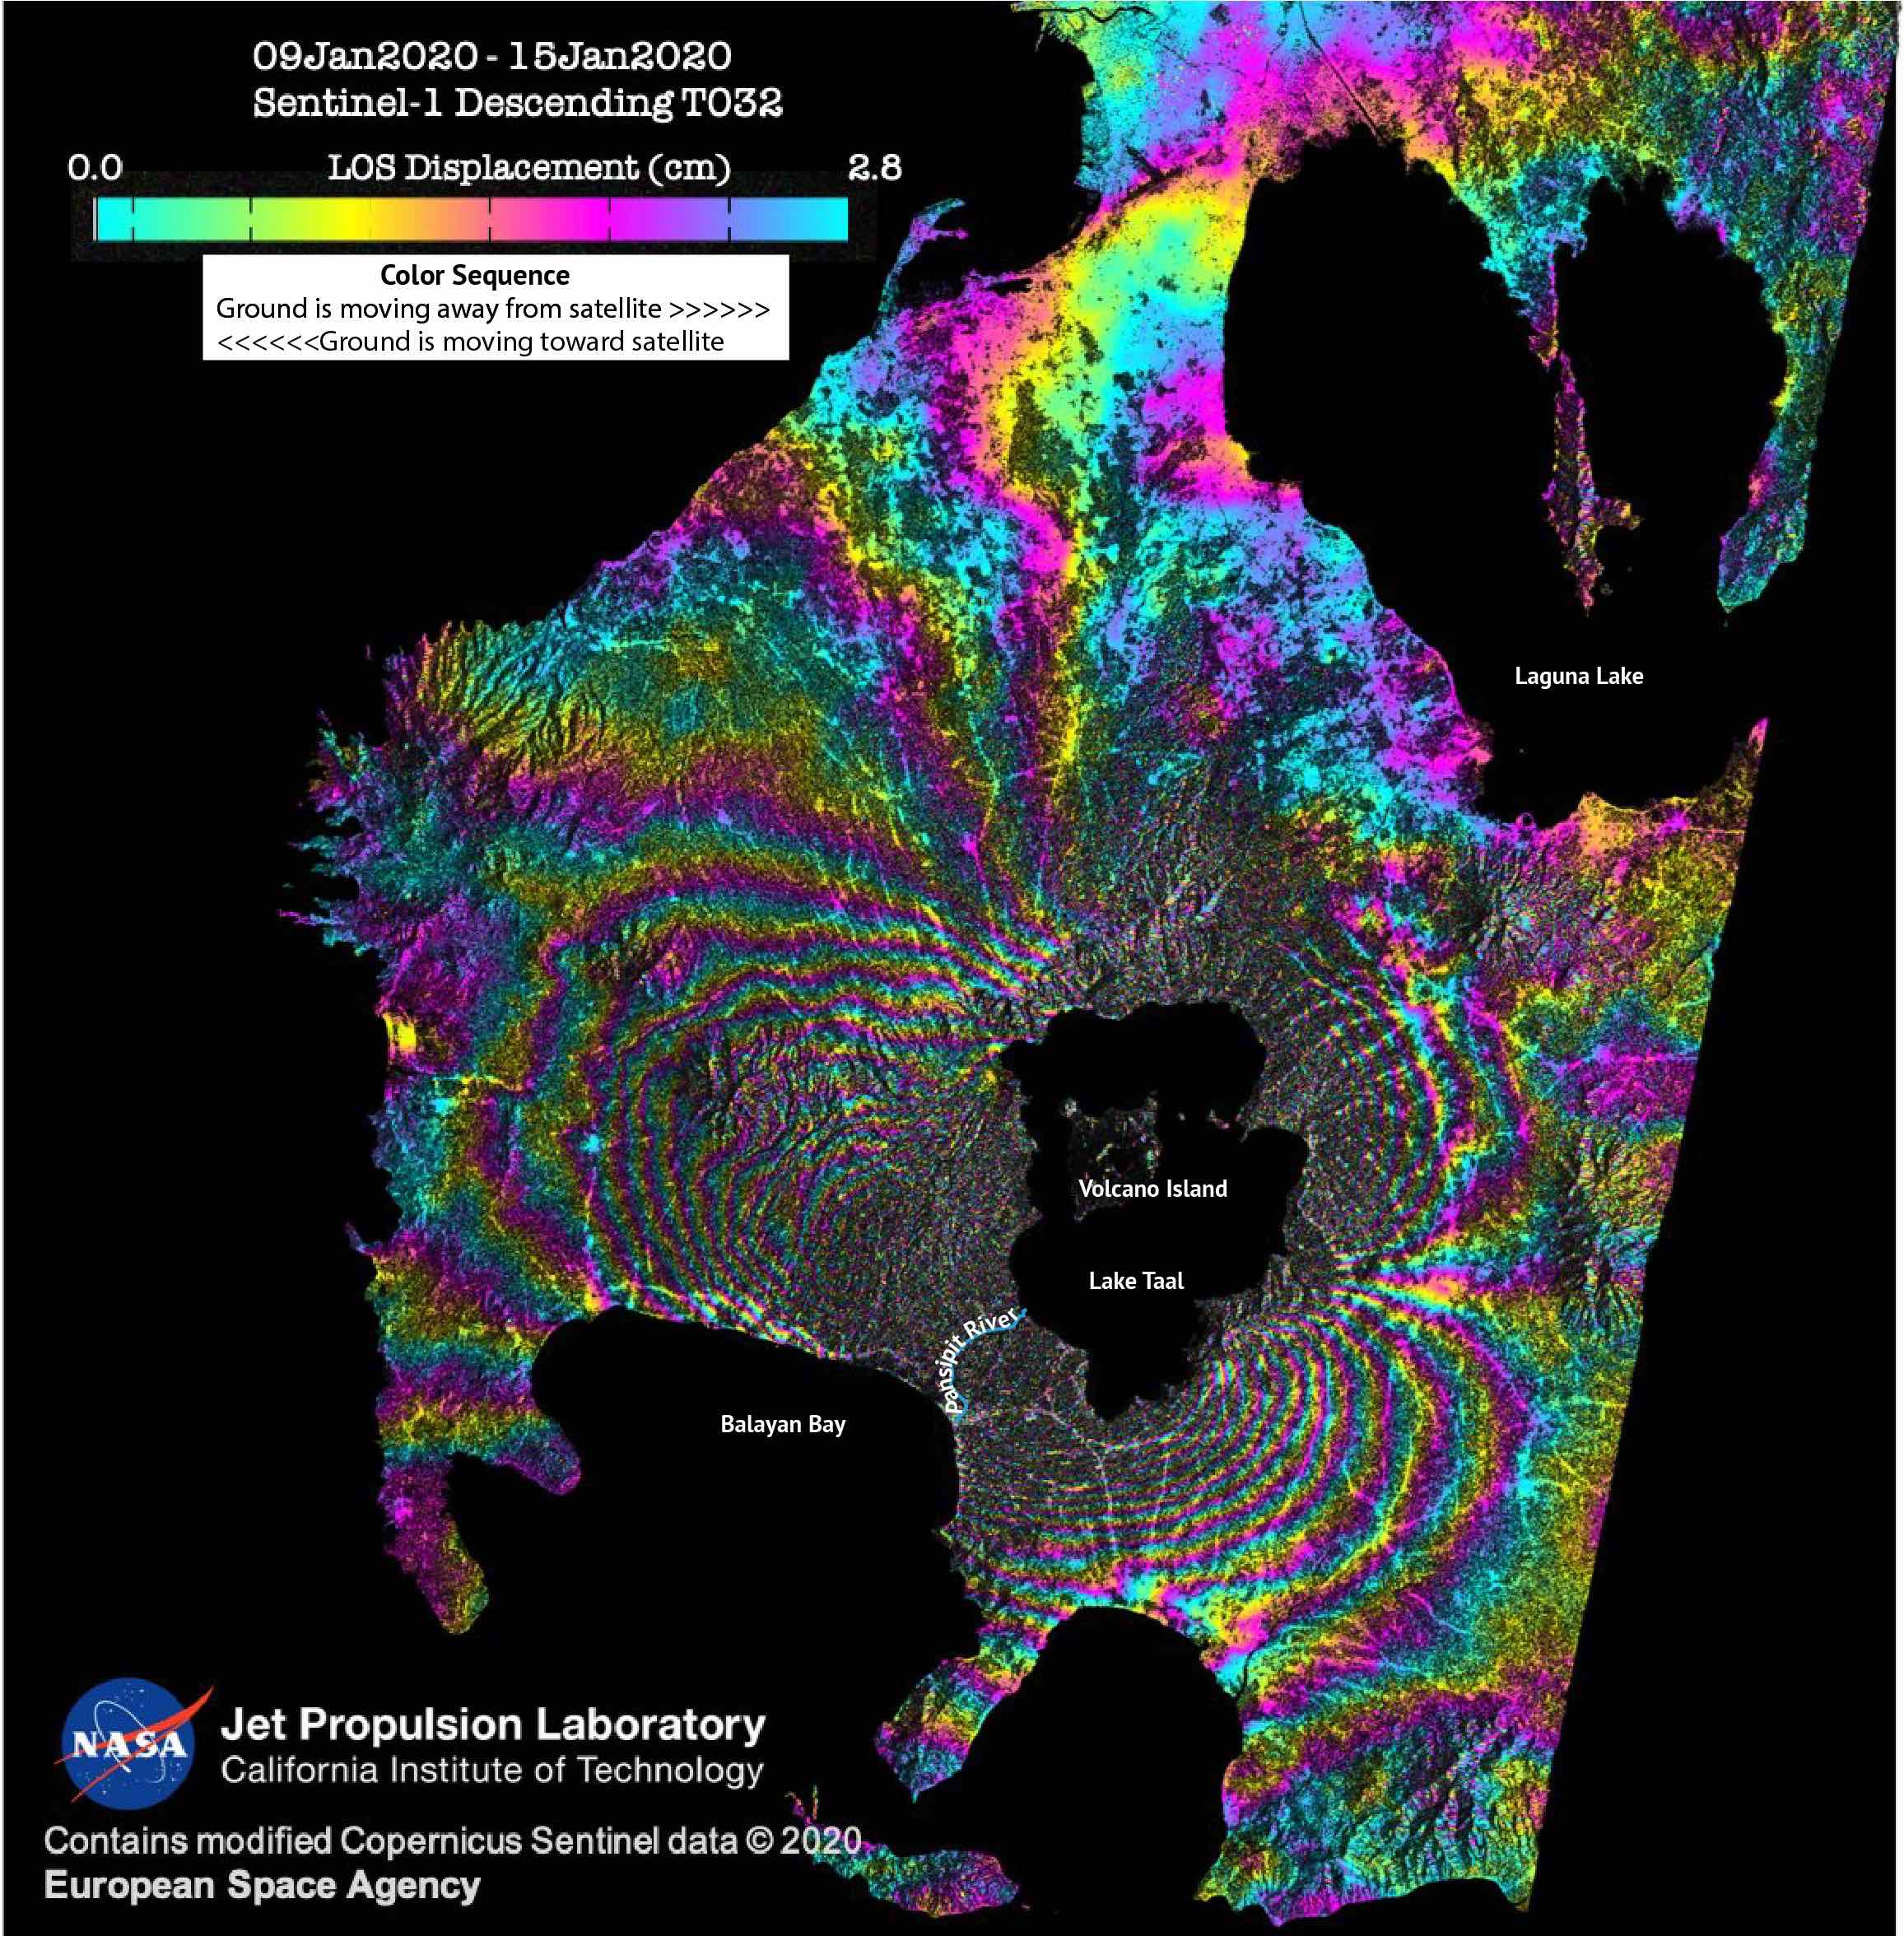
Fielding describes each fringe, which is a complete rainbow as per an interferogram’s scale bar, as akin to “contour lines on a topographic map, [but] the color contours are not elevation.” Instead, he says, they indicate some increment of displacement. Each fringe for the Sentinel-1 satellites, he says, depicts 2.8 centimeters of movement, and scientists simply count the fringes to calculate total displacement.
Scientists who look at these images have trained their eyes to read the repeating rainbows, or fringes. These scientists can determine at a glance which side of the image moved toward the satellite, and which side moved away, simply based on which direction the rainbows cycle through their colors. For the interferogram of Taal, the fringe pattern to the north, east and west of Lake Taal tell scientists the ground moved away from the satellite, and the fringe pattern to the south and southeast indicate the ground moved toward it.
Unwrapping the interferogram
Once the initial interferogram is constructed, scientists then “unwrap” it, which is a way of adding the fringes together to determine total displacement in the satellite’s line-of-sight. Fielding says, “[We] estimate the total displacement at every point of the image where the InSAR is good quality.”

For Taal’s unwrapped interferogram, the southeast side appears to move toward the satellite (eastward and upward) by a substantial amount relative to the rest of the area around Taal, and the southwest side moved away from the satellite. Deformation is focused around the volcano, but how much of that is vertical motion?
Vertical motion obscured
“The biggest source of confusion,” Fielding says, “is the fact that InSAR measures the component of displacement in the radar line-of-sight.” This is because the satellite is rarely directly above the target of interest, instead studying the ground from an angle. He continues,“This means that a single InSAR measurement is a combination of horizontal and vertical motion.” Therefore, to calculate how much the ground moved up or down versus side-to-side, additional data and processing are required. Quantification of vertical versus horizontal motion is important when trying to determine what’s causing ground movements around an active volcano.

To do so, images are required from other satellite angles, which Mary Grace Bato, a Filipina Postdoctoral Scholar at JPL, and Paul Lundgren, a geophysicist at JPL, explored as they processed additional InSAR data. Preliminary images of horizontal versus vertical components from Sentinel-1 data show more horizontal than vertical movement overall. The horizontal component shows that the southeast side of Taal moved away from the western side, indicating extension.
Bato says, “We delivered all our data and analysis directly to PHIVOLCS … to contribute to their current monitoring of the crisis.” She notes that these data are “complementary analysis to what [PHIVOLCS] observes on the ground.” In short, InSAR data are best interpreted with observations from around the volcano itself.
Pixel offset mapping
The final image released by JPL is a pixel offset map of Taal. According to Fielding, such images are made using only amplitude, or strength of the return signal, from the same before-and-after radar images used for InSAR. The amplitude is influenced by the Earth’s surface, and provides a way of seeing large ground surface changes where “the InSAR measurement becomes impossible,” says Fielding. Although less accurate than InSAR, he says “it works well where displacements are large.”
Bato says, “The pixel-offset results complement the missing part in the InSAR,” particularly in areas that have changed dramatically, like the Pansipit River Valley southwest of Lake Taal, which marks a distinct difference in deformation from one side of the valley to the other, and Volcano Island, which is now covered in ash.
Earthquakes, fissures and ground motion
Key to what’s happening now is the presence of deformation along the Pansipit River Valley, which is most obvious on the pixel offset map. This deformation coincides with fissure locations, as well as earthquakes that PHIVOLCS has described as signifying magma intruding beneath Taal.
Although the eruption has eased as of the most recent PHIVOLCS bulletin, something seems afoot at the southern end of Lake Taal, where it drains into the sea. The eruption itself may wax and wane for months, or it may diminish completely if Taal goes back to sleep. Regardless, PHIVOLCS is maintaining an Alert Level 4 as of this writing because the possibility of an explosive eruption remains.
For official and up-to-date information on this eruption, follow PHIVOLCS on twitter (@PHIVOLCS-DOST) or visit their website.
- Living through the Loma Prieta earthquake - October 21, 2021
- The Great Quake Debate: an interview with seismologist and author Susan Hough - August 27, 2020
- Salton Sea Swarm quiets down - August 12, 2020