Jason R. Patton, Ph.D.
Seismic Hazards
Natural hazards from earthquakes are a substantial source of risk for people in earthquake hazard zones. Everyone can benefit from learning more about their exposure to potential earthquake ground shaking. However, some earthquake hazards are affected by the actions of people. When earthquakes are caused by the actions of people, we call this “induced seismicity.” Recent research conducted by Goebel and Brodsky (2018) reveals that prior assumptions about what controls the extent of induced seismicity may be incorrect.
Many governments and non-governmental organizations prepare estimates of seismic hazard so that people can ensure their building codes are designed to mitigate these hazards. In Europe, the European Union Seismic Hazard Harmonization for Europe (SHARE) program characterized the seismic hazard for much of Europe (Woessner et al., 2014). The Global Earthquake Model (GEM) is another example of our efforts to estimate seismic hazards, though on a global scale. Temblor.net uses the Global Earth Activity Rate (GEAR) model to prepare estimates of seismic hazard at a global to local scale (Bird et al., 2015). Each of these models incorporate earthquake information from different sources including, but not limited to, fault slip rates, records of prehistoric earthquakes, historic seismicity, and strain of the Earth’s crust as measured using Global Positioning System (GPS) observations.
Below is a map made using the Temblor App. Shown for Oklahoma City, OK and the surrounding region are the known active faults and seismicity for the past 30 days. The earthquake score for Oklahoma City is 100. Learn more about your earthquake score here at temblor.net.

Figure 1. Earthquake Hazard in the Oklahoma City, Oklahoma region. Active faults are red lines.
In the USA, the U.S. Geological Survey (USGS) prepares this evaluation every few years and prepares the National Seismic Hazard Map with updates on this schedule (Petersen et al., 2014). Following a notable increase in earthquake frequency in Oklahoma in 2009, there was an increased interest in how the seismicity rates there were related to oil exploration and extraction practices. There was found a correlation between fluid injection rates and rates of seismicity. Because of the hypothesized and observed dependence on earthquake frequency with rates of injection, and these rates have spatial and temporal variation dependent upon human activity, the USGS chose to prepare additional annual updates on seismic hazard associated with this induced seismicity (Petersen et al., 2018).
Though, even with all this knowledge about earthquake hazards, people often do not protect themselves from the potential losses during an earthquake. Recent analyses show that only about 13% of people who are exposed to earthquake hazards in their California residences are insured with earthquake insurance.
This illustration below shows that the number of earthquake rose above the late 20th century background level of seismicity. The bar graph shows the number of earthquakes each year. The change from red to blue represents the onset of an increased rate of induced seismicity in 2009. The map shows the earthquake epicenters with color coordinated with the bar graph.

Figure 2. Number of M 3+ earthquakes in the Central U.S. from 1973 to August 2018. The histogram shows the number of earthquakes with magnitudes at least M 3. Map shows spatial extent of seismicity colored relative to time as plotted in histogram.
This illustration below is the annual update of the national seismic hazard map (Petersen et al., 2018). In both maps, color represents the chance of a building or structure designed to the building code might experience minor damage from ground shaking during the year of 2018. This level of shaking is equivalent to the “Modified Mercalli Intensity Scale VI. More about the MMI scale here. On the left is a map that shows the seismic hazard for the western US, based upon the standard National Seismic Hazard Model published in 2014. The map on the right shows the seismic hazard for the Central and Eastern US regions, based upon the annual estimate of seismic hazard due to induced seismicity.

Figure 3. The 2018 National Seismic Hazard Map, annual update. Color represents the relative chance of experiencing a damaging earthquake in 2018. The inset map on the left is from the 2014 update to the 2014 National Seismic Hazard Map. The inset map on the right also includes the annual estimate of increased hazard due to induced seismicity.
Background Material
Stress and Strain: Earthquakes occur because Earth’s crust, or lithosphere, is being deformed due forces applied from plate motions and the interactions at these plate boundaries. These forces cause stress in the crust over time. This stress is often localized along the plate boundaries (faults), but can also be distributed within the plate interiors. Over time, this stress causes the crust to deform and we call this accumulated deformation “strain.” Strain is defined as a change in shape (length, width, etc.) over time.
Elastic and Plastic Behavior: Accumulated strain can be released during an earthquake. The extent that the Earth returns to its pre-deformed shape is called elastic behavior, while the extent that the Earth remains in a deformed shape is called plastic (or anelastic) behavior. These behaviors act at different scales, including the crustal scale and the scale of a grain of sand.
Porosity and Permeability: Porosity is the amount of open space (called pores) between particles or within bedrock. Permeability is a measure of the ability of fluid to flow through a material, from pore to pore. Different bedrock can have different ranges of both porosity and permeability.
Induced Seismicity
A better understanding of the driving mechanisms behind earthquakes will help us to better forecast seismic hazard related to induced seismicity. Typically, hazard assessment for induced seismicity is based upon analysis of changes in the stress field from higher pore pressures related to fluid injection. However, changes in the stress field can also be modulated by the elastic properties of bedrock if the pore pressure change is transmitted to the bedrock (via coupling).
Pore pressure is the pressure in fluids that are contained within pores. Pores are the spaces between rocks or sediments within bedrock. We think that when fluids fill cracks in the earth (like in earthquake faults), the pressure from the fluid (the pore pressure) can push against the sides of these cracks changing the forces acting on the fault. Generally, if this pore pressure is large enough, the walls of the fault can be pushed apart, reducing the friction on the fault, leading to fault slip during an earthquake. Pore pressure increases can be the result of a variety of anthropogenic activities, including geothermal energy activities, waste water or fluid injection, hydraulic fracturing (a.k.a. “fracking”), CO2 sequestration, and dam construction.
Evidence for fluid injection induced seismicity was first evaluated for earthquakes related to fluid injection at a well located on the Rocky Mountain Arsenal in Colorado (Healy et al., 1968). These authors found a direct correlation between fluid injection rates and rates of earthquakes and offered the explanation presented above. Later, Raleigh et al. (1976) conducted an experiment to test these hypotheses regarding the mechanism and found a direct linkage between changes in pore pressure and rates of seismicity along a fault system near several fluid injection wells near Vernal, Utah.
Below is a plot from Healy et al. (1968) that shows the correlation between earthquakes per month and volume of waste water injected at the well in Colorado.

Figure 4. Earthquake frequency relative to the volume of fluid injected at the well in Colorado (Healy et al., 1968)
In this figure below, Healy et al. (1968) shows the pressure measured at the Colorado well and how well that correlates with earthquake frequency.

Figure 5. The number of earthquakes per month and the average monthly pressure at the bottom of the Colorado Arsenal well plotted relative to time.
Interestingly, there is also evidence that reductions in pore pressure can also lead to induced earthquakes (Seagall, 1989). This response to lowering pore pressure is thought to be due to “poroelastic” changes in stress and is true only under certain circumstances that relies partly on fault geometry.
When there are changes in pore pressure that change the forces applied to the materials these fluids surround, those materials can deform elastically. The combined effect of changes in pore pressure and changes in elasticity is called poroelasticity.
When fluids are injected into bedrock through wells, the pore pressure increases in the subsurface surrounding the well. This pressure is transmitted across a 3-dimensional area and the pressure diminishes with distance from the well. This pore pressure increase can transmit forces into the surrounding bedrock and the bedrock can deform elastically in response. The amount that the forces are transmitted from the fluid to the surrounding materials is referred to as “coupling.”
Imagine some strips of Velcro. When these strips are new they stick together, we might say that they are well coupled. They are well coupled because forces are well transmitted from one strip of Velcro to the other strip. Over time, the Velcro wears out and does not stick together so well. We might say these Velcro strips are poorly coupled.
The amount of coupling between the fluid and the bedrock is dependent upon the elastic material properties of the bedrock and the mineral or particle grains within the bedrock and how well fluids can migrate within the bedrock (permeability).
Goebel and Brodsky:
Goebel and Brodsky (2018) conducted an analysis of a global scale data set of induced seismicity. Their intent was to evaluate the impact of single injection wells on induced seismicity in the region surrounding these wells. They included regions that fit a narrow range of suitability that allowed them to test a variety of hypotheses (e.g. what physical factors might control the spatial and temporal extent of induced seismicity).
Here is a map showing the geographical distribution of the sites used by Goebel and Brodsky (2018) in the United States, Europe, and Australia.
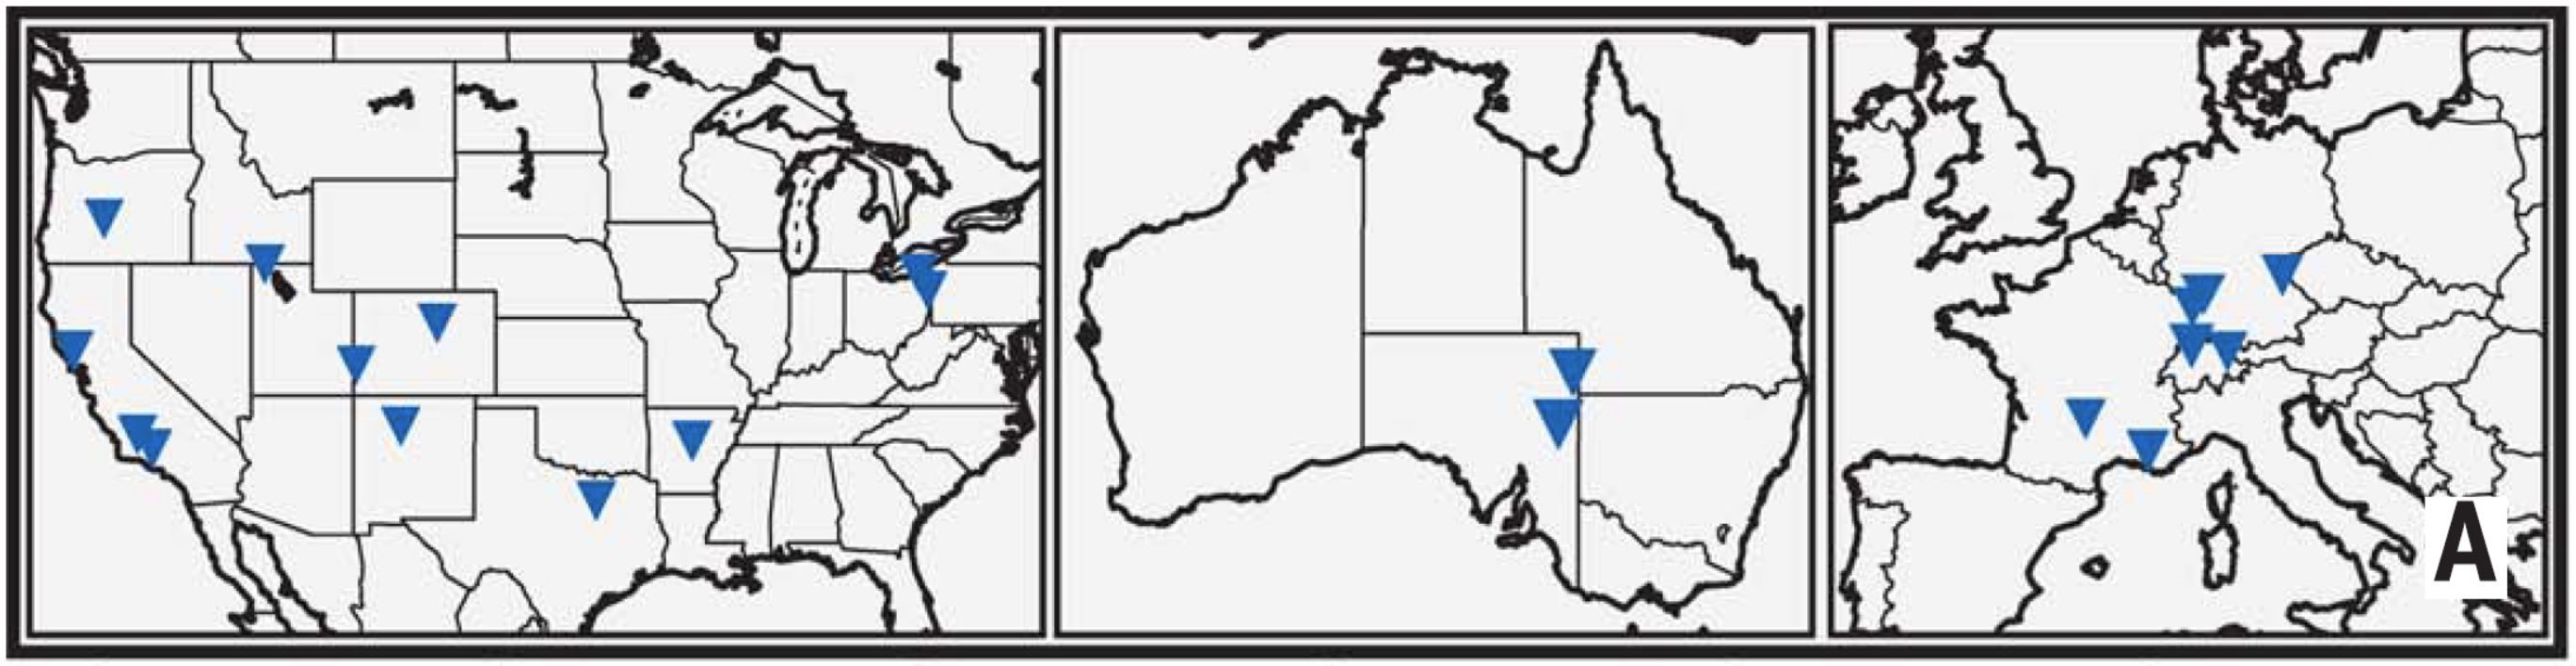
Figure 6. Spatial distribution of induced seismicity data used by Goebel and Brodsky (2018).
A main goal for all scientists is to isolate factors so that they can be evaluated for their influence on the experiment. For example, induced seismicity in Oklahoma was excluded from their study because there are too many injection wells to be able to effectively determine the impact of an individual well.
Their analyses revealed that there are two main groups of earthquake behavior. These groups are segregated based upon how the number of induced earthquakes diminishes with distance from the injection well. These two groups were in different types of bedrock: sedimentary rock (like sandstone) and crystalline bedrock (like granite).
These authors unexpectedly found that the bedrock type exerts a first order control on (1) the distance that earthquakes are triggered by fluid injection and (2) the decay rate for earthquakes following this fluid injection. The results presented by Goebel and Brodsky (2018) inform us that sedimentary bedrock locations are more coupled than crystalline bedrock locations. This allows the pore pressure increases to extend well beyond the area that would have seen pressure increases due to fluids alone.
In their figure below, this is an oblique cut-away into the Earth that shows a map on top with a well symbol showing where fluid is being injected into the subsurface. Below the map there are two plots with colored lines that represent the number of earthquakes on the vertical axis with distance (r) from the injection well on the horizontal axis. The two groups are the pressure dominated (low coupling) group in blue and the elastic stress dominated (high coupling) group in red.
For the low coupling sites (crystalline bedrock), earthquake numbers are plateaued to a certain distance, then they rapidly decay to 0, the distance (r) denoted by the blue dashed line. For high coupling sites (sedimentary bed rock), the plateau is less wide, then earthquake numbers decay with a more steady rate ending at the red dashed line. These different distances are represented in the map as blue and orange circles, respectively.
In the ochre colored crust there are white lines that represent faults. Note how there are more faults within the orange circle, than in the blue circle alone. However, also note that in the outermost part of the orange circle, there are a lower number of earthquakes in that region (see the red line in plot C).
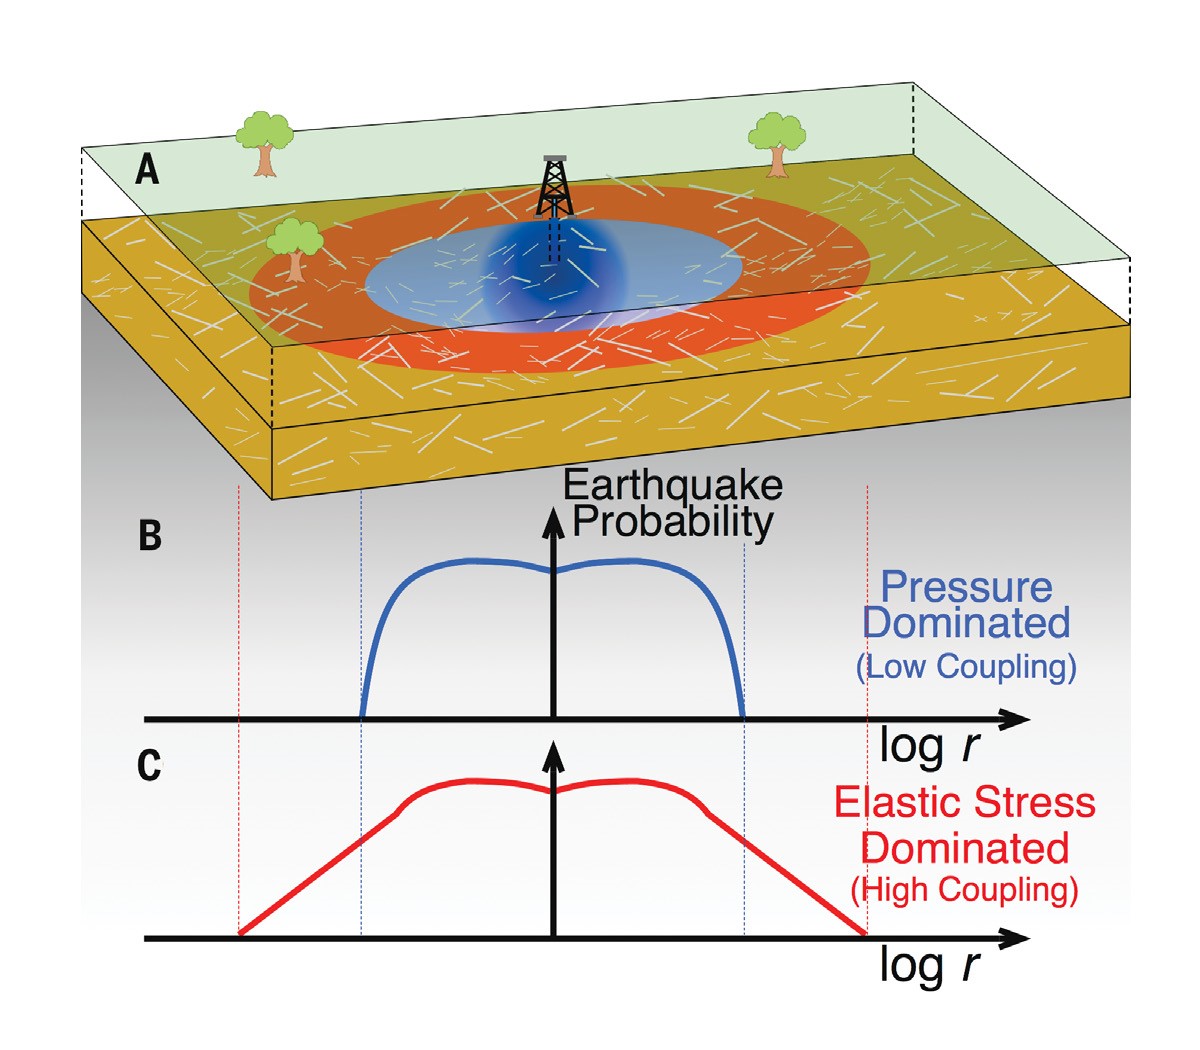
Figure 7. The spatial extent for induced seismicity relative to the type of bedrock. (A) The maximum extent of induced earthquakes relative to crystalline bedrock (blue ellipse) and sedimentary bedrock (red ellipse). The hypothetical fault network is shown as gray lines. (B) The chance of an earthquake (blue, vertical axis) relative to distance from the well for crystalline bedrock sites. (C) The chance of an earthquake (red, vertical axis) relative to distance from the well for crystalline bedrock sites.
Goebel and Brodsky hypothesize that because sedimentary rocks have high porosity and the sedimentary particles are not well bonded to the rock, they allow the pore pressure to be transmitted to the surrounding bedrock better than for crystalline bedrock.
Ramifications
Before this research was conducted, the recommendations to limit the number of induced earthquakes was to inject waste water into the Earth at crystalline bedrock sites. However, now we suspect that the opposite is true. This change in perspective is substantiated by the empirical evidence compiled and analyzed by Goebel and Brodsky. They suggest that it is generally more dangerous to inject fluids into sedimentary rock than to inject into crystalline bedrock.
However, Dr. Brodsky warns us to recognize that the Earth is not homogeneous and the real world configuration of bedrock shapes, bedrock types, regional distribution of fractured bedrock, earthquake faults, and how these geometrically relate to each other may make things more complicated. These complications may lead to exceptions to the rule presented in the figure above. More from Dr. Brodsky can be found here.
Important take away knowledge from this article comes summarized in their abstract, “[the] far-reaching spatial effects during injection may increase event magnitudes and seismic hazard beyond expectations based on purely pressure-driven seismicity.”
Learn more about your exposure to natural hazards like earthquakes here at temblor.net.
Resources:
USGS information page about induced earthquakes https://earthquake.usgs.gov/research/induced/
USGS One Year Potential Ground-Shaking Hazards https://www.usgs.gov/news/new-usgs-maps-identify-potential-ground-shaking-hazards-2017
Emily’s layperson explanation:
References:
Bird, P., Jackson, D. D., Kagan, Y. Y., Kreemer, C., and Stein, R. S., 2015. GEAR1: A global earthquake activity rate model constructed from geodetic strain rates and smoothed seismicity, Bull. Seismol. Soc. Am., v. 105, no. 5, p. 2538–2554, DOI: 10.1785/0120150058
Goebel, T.W. and Brodsky, E.E., 2018. The spatial footprint of injection wells in a global compilation of induced earthquake sequences in Science, v. 361, p. 899-904, DOI: 10.1126/science.aat5449
Healy, J.H. et al., 1968. The Denver Earthquakes, Science, v. 161, p. 1301-1310
Petersen, M.D., Moschetti, M.P., Powers, P.M., Mueller, C.S., Haller, K.M., Frankel, A.D., Zeng, Yuehua, Rezaeian, Sanaz, Harmsen, S.C., Boyd, O.S., Field, Ned, Chen, Rui, Rukstales, K.S., Luco, Nico, Wheeler, R.L., Williams, R.A., and Olsen, A.H., 2014, Documentation for the 2014 update of the United States national seismic hazard maps: U.S. Geological Survey Open-File Report 2014–1091, 243 p., http://dx.doi.org/10.333/ofr20141091
Petersen, M. et al., 2018. One-Year Seismic Hazard Forecast for the Central and Eastern United States from Induced and Natural Earthquakes – Seis. Res. Lett., doi.org/10.1785/0220180005.
Raleigh, C.B. et al., 1976. An experiment in Earthquake Control at Rangely, Colorado, Science, v. 191, p. 1230-1237
Woessner, J., Danciu, L., Giardini, D., and the SHARE Consortium, 2013. The 2013 European Seismic Hazard Model in proceedings from Workshop: Results of the European Project SHARE: Seismic Hazard Harmonization in Europe
Glossary:
Stress is the application of a force across some area.
Strain is the change in shape of a material as a result of stress being applied.
Pores are the open spaces within bedrock or between particles in sediments.
Porosity is the amount (percent) of open space (called pores) between particles or within bedrock.
Permeability is a measure of the ability of fluid to flow through a material.
Pore pressure is the pressure within a fluid that exists when the fluid is contained within bedrock or sedimentary pores.
Poroelasticity is a physical behavior that couples the effects from pore pressure in fluids with elastic effects in the surrounding material (e.g. bedrock).
Elastic behavior is after a stress is applied to a material and that material deforms, when that stress is no longer applied, the material returns to its previous shape. Think about the elastic in one’s underwear. In contrast, for plastic behavior, after the stress is released, the material stays in the deformed shape.
- Osa Peninsula, Costa Rica: A unique opportunity to drill and instrumentthe seismogenic zone of large megathrust earthquakes - June 4, 2019
- Mexico-Guatemala earthquake, felt by millions, likely triggered by the 2017 megaquake - February 2, 2019
- Fuerte estremecimiento a partir de terremoto en la costa central de Chile: ¿Qué revela acerca del siguiente choque de megafalla? - January 23, 2019