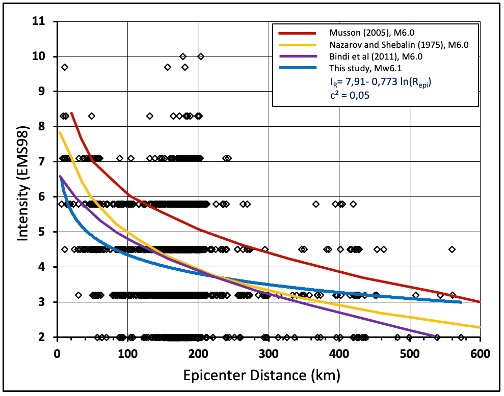
Figure 4. Variation of the intensity values determined by EMSC for the Nov. 23, 2022, Gölyaka earthquake, depending on the distance to the epicenter and the best fitting attenuation curve (blue line) calculated for this change. The attenuation graphs determined for earthquakes of similar magnitude for different seismically active areas of the world are shown for comparison. Data with intensity I (1) from the intensity values reported by EMSC are not included in this chart. Credit: Haluk Eyidoğan
Latest posts by Krystal Vasquez (see all)