By Tiegan E. Hobbs, M.Sc., Ph.D. candidate at Georgia Institute of Technology and Shinji Toda, Ph.D., IRIDeS, Tohoku University
Citation: Hobbs T.E., Toda S., 2018, Did Tuesday’s M=7.9 Kodiak earthquake nudge the Alaskan Megathrust closer to failure?, Temblor, http://doi.org/10.32858/temblor.005

Communities across Alaska test their earthquake and tsunami preparedness
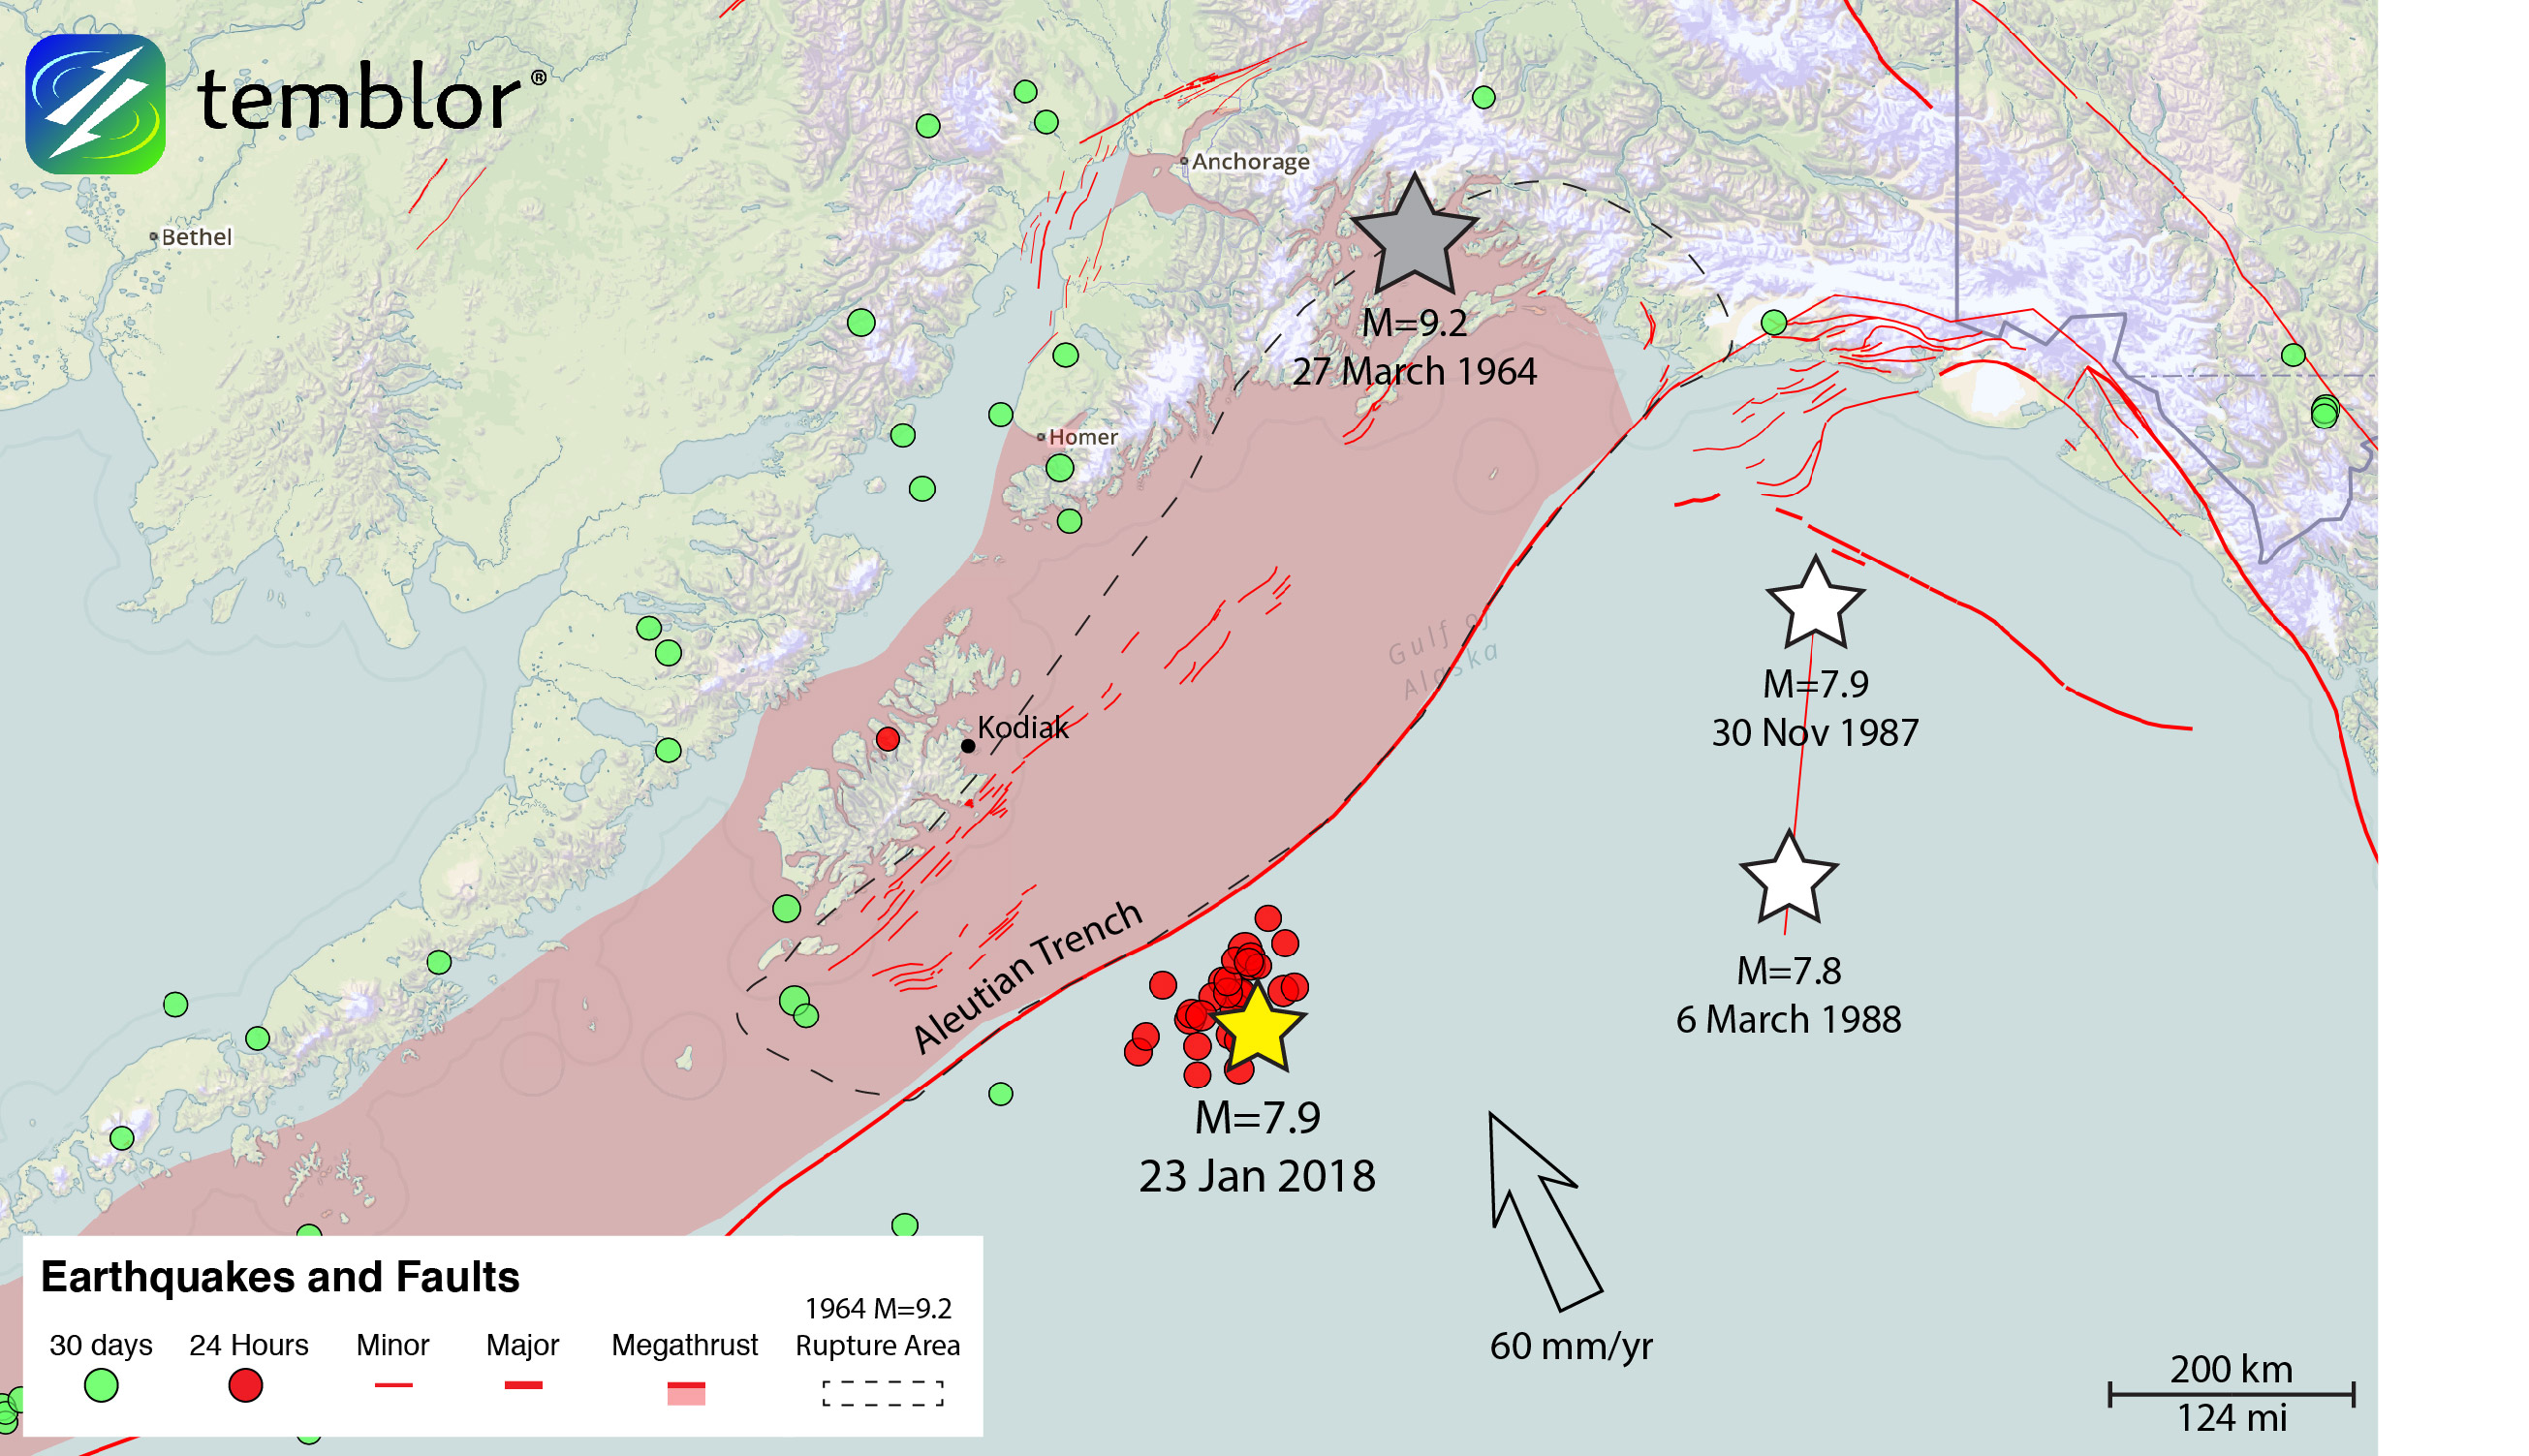
Tuesday’s Mw 7.9 Kodiak Earthquake was widely felt throughout Alaska. Shaking was reported 360 mi (600 km) away in Anchorage, and as much as 620 mi (1000 km) away in Fairbanks, AK (1). As a testament to the strong hazard planning of Alaskan communities, citizens in the nearby city of Kodiak were trained to self-evacuate to a nearby mountain when they heard the tsunami sirens (2). Across the Gulf of Alaska, the Seward Fire Department helped assist evacuation efforts, and many residents spent the evening sheltered in Seward High School (3) until they got the all-clear. Though a damaging tsunami did not materialize, Tuesday morning’s earthquake served as a successful drill and a potent reminder of the necessity for natural hazard preparedness.
Could this earthquake trigger a large event on the megathrust?
Following a large earthquake like this one, researchers don’t just study the distribution of shaking onshore, but also collect information about what surrounding faults were brought closer to failure as a result of earthquake. Seismologists use global recordings of earthquake waves to generate a detailed map of where exactly the fault plane slipped during the mainshock. These maps, called “finite fault solutions,” can be used to predict how the earth was stressed and deformed during the earthquake. We use such a map from Gavin Hayes at the USGS (4) with Coulomb Stress Analysis software (5) to probe how yesterday’s earthquake affected the stress state of the nearby Aleutian Megathrust. As we discussed in a previous post, Tuesday’s magnitude 7.9 event ruptured very close to—but not on—the nearby subduction zone, or megathrust, which was responsible for the largest recorded earthquake ever recorded in North America (6).
A giant earthquake studied by a giant of geophysics
In fact, it was that M=9.2 ‘Good Friday’ earthquake that first led a young USGS geologist, George Plafker, to argue that subduction zone quakes slid huge hunks of the oceanic seafloor beneath the continents on gently included megathrust faults, now called ‘subduction zones.’ This bitterly-opposed heresy also explained what happened in the 1960 M=9.5 Chile quake, the largest ever recorded. But within a year, it was soon widely embraced, where it helped to trigger the plate tectonic revolution, which fell into place within two years of his discovery. George, recipient of the 2017 Reid Medal of the Seismological Society of America and the 2017 Penrose Medal of the Geological Society of America, is still working at the USGS on Alaskan and other giant quakes.

A gentle stress increase on the Alaskan Subduction Zone
We also consider how the stress perturbation from this event is related to aftershocks. In other words: can we use information about Tuesday’s mainshock to predict where aftershocks should have occurred? We test the hypothesis by comparing the prediction we might have made yesterday with the aftershocks that have been recorded so far.
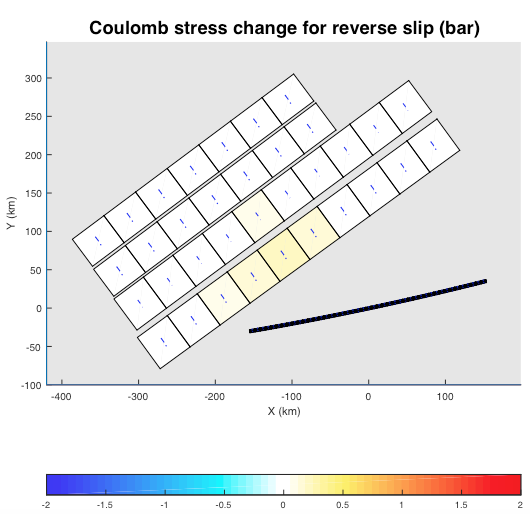
An earthquake changes the shape of the earth’s crust slightly, which can increase or decrease in the stress on other faults. Because the fault from yesterday’s earthquake sits so close to the Alaskan subduction zone (the Aleutian Megathrust), displacement from Tuesday’s Kodiak earthquake was able to change the stress on the subduction fault by up to 0.2 bars. For reference, the average pressure of our atmosphere at sea level is about 1.01 bars or 14.6 pounds per square inch (psi). That means that the Kodiak earthquake changed the stress on the megathrust by about 1/5th of an atmosphere, or 2.9 psi. It’s not much, but studies show that Coulomb stress changes of 0.1 bars can be sufficient to trigger seismicity (7-9). While this doesn’t mean that a large earthquake is going to happen any time soon, it suggests that yesterday’s earthquake has pushed a small portion of this subduction zone closer to its failure state. Doing a quick calculation, we know that most earthquakes have a stress drop of about 40 bars (10), and this region has a roughly 500-year inter-event time for great earthquakes (11). At 0.08 bars of stress accumulated per year, Tuesday’s earthquake may have advanced a megathrust event by several years.
Does mainshock slip explain aftershock distribution?
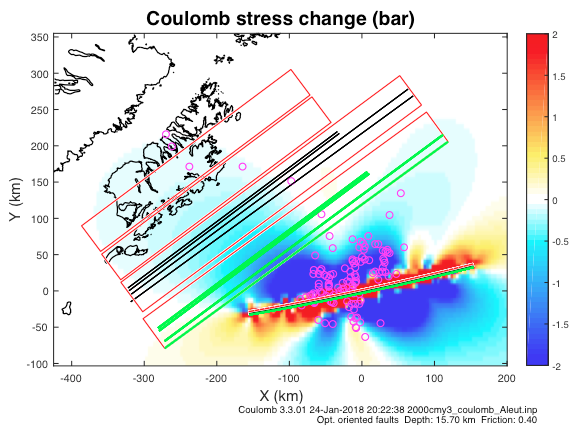
In less than a two days, the USGS has already recorded over 100 events, most of which are on or near the mainshock fault plane. Aftershocks should occur more frequently in areas where this stress is high. Here we see an interesting deviation from that pattern. Aftershocks, shown as pink circles, appear to cluster tightly around the fault plane. We would expect the off-fault aftershocks to be located near the edges, where there are lobes of positive stress transfer (red and orange colors). However, we see that the aftershocks happened closer to the center of the fault.
So why do we see aftershocks in areas that were brought farther from failure by the mainshock? One possibility is that the fault model is not sufficiently accurate. For instance, the earthquake may have ruptured a slightly different fault or been composed of multiple ruptures. Alternately, there may be a pre-existing state of stress in the crust that we are not accounting for in this approximation. Investigating these possibilities helps refine our knowledge of aftershocks, allowing for better predictions in the future.
Citation: Hobbs T.E., Toda S., 2018, Did Tuesday’s M=7.9 Kodiak earthquake nudge the Alaskan Megathrust closer to failure?, Temblor, http://doi.org/10.32858/temblor.005
References
(1) USGS ‘Did You Feel It?’ Map for the 23 January 2018 Kodiak, AK Earthquake.
(2) Anchorage Daily News “7.9 quake in Gulf of Alaska spurs tsunami alerts, evacuations”.
(3) Anchorage Daily News “Video: Seward residents describe early morning tsunami threat”.
(4) USGS Finite Fault Solution for 23 January 2018 Kodiak, AK Earthquake.
(5) USGS ‘Coulomb 3’ Software.
(6) Fountain, Henry, ‘The Great Quake, How the biggest earthquake in North America changed our planet,’ Penguin Random House, 2017.
(7) Reasenberg, P. A., & Simpson, R. W. (1992). Response of regional seismicity to the static stress change produced by the Loma Prieta earthquake. Science, 255(5052), 1687.
(8) King, G. C., Stein, R. S., & Lin, J. (1994). Static stress changes and the triggering of earthquakes. Bulletin of the Seismological Society of America, 84(3), 935-953.
(9) Hardebeck, J. L., Nazareth, J. J., & Hauksson, E. (1998). The static stress change triggering model: Constraints from two southern California aftershock sequences. Journal of Geophysical Research: Solid Earth, 103(B10), 24427-24437.
(10) Allmann, B. P., & Shearer, P. M. (2009). Global variations of stress drop for moderate to large earthquakes. Journal of Geophysical Research: Solid Earth, 114(B1).
(11) Shennan, I., Bruhn, R., & Plafker, G. (2009). Multi-segment earthquakes and tsunami potential of the Aleutian megathrust. Quaternary Science Reviews, 28(1), 7-13.
- Beware quiet segments of the Philippine Fault - May 16, 2025
-
ډیری عوامل افغاني ټولنې د زلزلې پر وړاندې زیانمنوي
- August 11, 2022 - What’s happening this week in Humboldt County, California: The squeeze - February 6, 2019