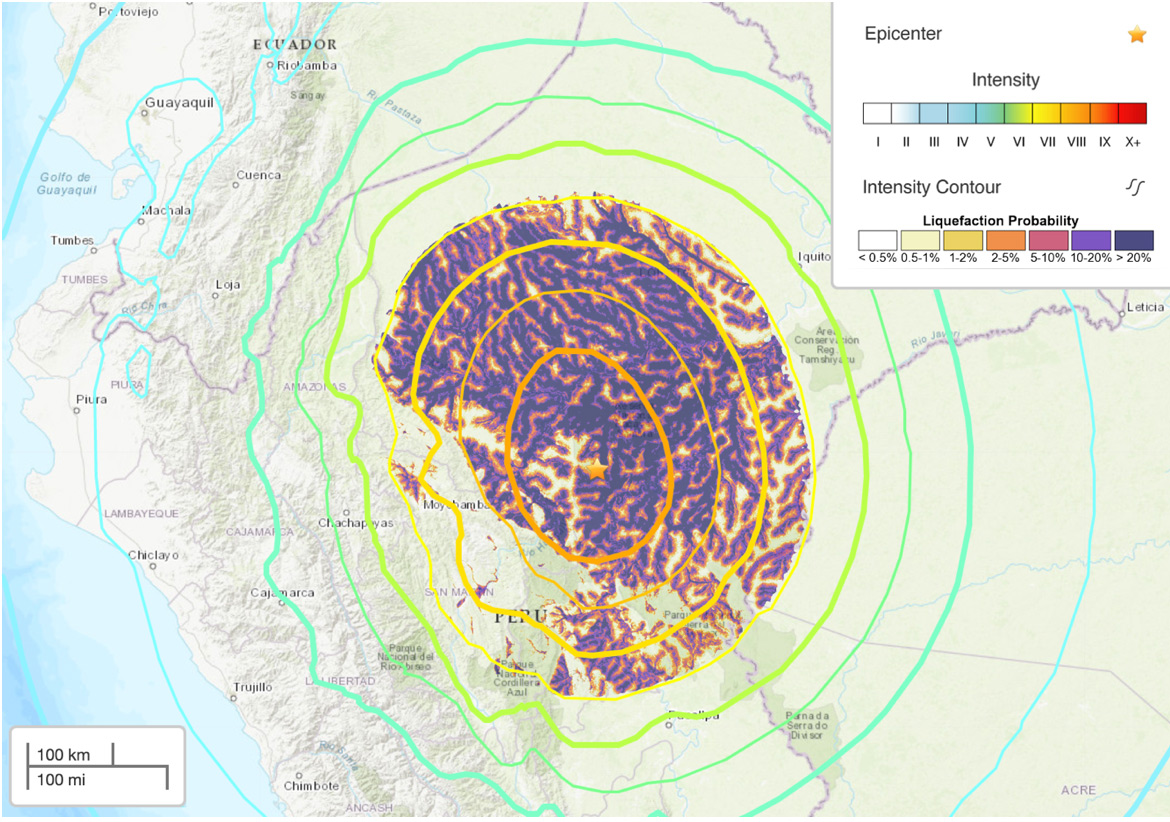
This map, produced by the United States Geological Survey, shows estimated Mercalli shaking intensity (colored contour lines from maximum of orange level VIII) and liquefaction probability (colored contours with maximum dark purple representing a greater than 20% chance of liquefaction).
Latest posts by Temblor (see all)
- Beware quiet segments of the Philippine Fault - May 16, 2025
-
ډیری عوامل افغاني ټولنې د زلزلې پر وړاندې زیانمنوي
- August 11, 2022 - What’s happening this week in Humboldt County, California: The squeeze - February 6, 2019