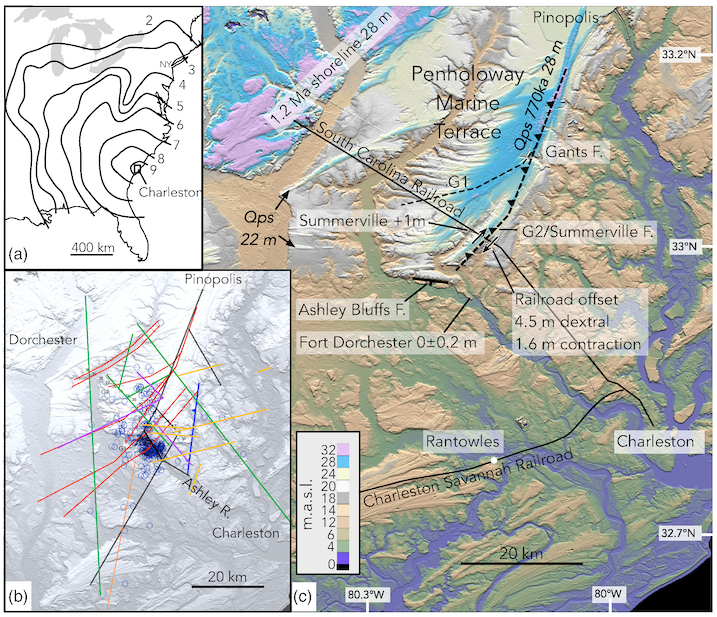
Panel (a) shows a location map with earthquake intensity counters published in 1890 (Dutton, 1890). Panel (b) shows relocated seismicity spanning 1977 to 2005 (blue circles, Chapman et al., 2016). The colored lines show faults proposed by Chapman et al. (2016). Panel (c) shows the geomorphology of the Charleston region with locations of faults and key coseismic constraints according to Bilham and Hough (2023). Credit: Bilham and Hough, 2023, The Seismic Record
Latest posts by Rachel Crowell (see all)