Brought closer to failure by the Feb. 6, 2023, magnitude-7.8 shock, the magnitude-7.5 shock that struck nine hours later caused aftershocks to turn on in some zones and off in others. But why both shocks nucleated on secondary faults — one quite small, the other misaligned for failure — is unclear. Moreover, decades earlier, two independent groups noted the heightened risk of large earthquakes in the approximate location of the magnitude-7.8 event. And what do these quakes suggest about potential California ruptures?
By Ross S. Stein, Temblor, Inc., Shinji Toda, IRIDeS, Tohoku University, Ali Deger Özbakir, Temblor, Inc., Volkan Sevilgen, Temblor, Inc., Hector Gonzalez-Huizar, CICESE, Gabriel Lotto, Temblor, Inc., and Serkan Sevilgen, Temblor, Inc.
Citation: Stein, R.S.., Toda, S., Özbakir, A. D., Sevilgen, V., Gonzalez-Huizar, H., Lotto, G., Sevilgen, S. 2023, Interactions, stress changes, mysteries, and partial forecasts of the 2023 Kahramanmaraş, Türkiye, earthquakes, Temblor, http://doi.org/10.32858/temblor.299
On Feb. 6, 2023, two massive earthquakes struck south-central Turkey near the Syria border. The first, a magnitude-7.8 shock, struck the Kahramanmaraş region along the East Anatolian Fault. It started, however, on a 20-kilometer-long secondary fault called the Narlı Fault — not the main East Anatolian Fault. It then ruptured for a total of 300 kilometers to both the northeast and southwest. The second large shock, a magnitude 7.5, ruptured nine hours later about 100 kilometers away from the epicenter of the magnitude-7.8 quake. The magnitude-7.5 quake propagated 150 kilometers total, both west and east, along the Sürgü-Çardak Fault that abuts the East Anatolian Fault at about a 30-degree angle. Both quakes have been followed by aftershocks, as expected. However, the aftershock sequence has wrought many surprises.
Within two days of the magnitude-7.8 and 7.5 quakes, we ran initial Coulomb stress calculations (Toda et al., 2023, published on Feb. 8), based on the preliminary U.S. Geological Survey (USGS) source model, also called a finite fault model. Our goal was to publish preliminary calculations of where stress was transferred from one fault to another during the earthquakes to aid in emergency response, and to probe how and why the first shock triggered the second. Similar, independent findings were published on Feb. 22, 2023, by the USGS Geologic Hazards Science Center and collaborators (2023).
Here, we furnish updated and more fully analyzed stress transfer calculations, using the latest available USGS source models. These calculations tell us that the magnitude-7.8 shock indeed brought the epicentral portion of the magnitude-7.5 fault rupture significantly closer to failure. They also tell us that a previously unmapped portion of the Sürgü-Çardak Fault was inhibited from failure by the magnitude-7.8 mainshock, but ruptured anyway, a curious finding considering the proximity of this segment to a nearby unruptured portion of the East Anatolian Fault. So, the triggering process was not as simple as we had initially surmised. Further, once the magnitude-7.5 quake struck, it shut down aftershocks on part of the magnitude-7.8 rupture, and so these two great shocks toggled seismicity on and off.
Also mysterious is why both shocks nucleated on secondary faults. Crucially, though, the site of the magnitude-7.8 rupture was roughly forecast by two independent research groups 10 and 20 years ago — insights that could be used to help governments focus mitigation and preparation resources where the need would be greatest. These large quakes also offer sobering implications for California, which hosts faults that strongly resemble those that ruptured in Turkey.
The magnitude-7.5 Sürgü-Çardak rupture was promoted by the magnitude-7.8 mainshock
We used Coulomb 3.4 for our stress analysis, and the latest USGS source models (v3 for the magnitude-7.5 shock, and v4 for the magnitude-7.8 shock). We find, as we did in our initial calculations (Toda et al., 2023), that up to 3 bars of Coulomb stress were imparted to the portion of the Sürgü-Çardak Fault (Balkaya et al., 2021) that ruptured nine hours after the magnitude-7.8 earthquake struck (Figure 1a). Three bars of stress is roughly 10% of a typical stress drop in an earthquake (as in, about 10% of the roughly 30 bars of Coulomb stress thought to accumulate before a fault ruptures), and thus is large enough to trigger an earthquake if the fault was already close to failure. However, the previously unmapped section of the Sürgü-Çardak Fault northeast of the epicenter — the part that runs parallel to the East Anatolian Fault — was inhibited by the magnitude-7.8 event (Figure 1a, labeled “reduced stress”). Yet, the magnitude-7.5 shock ruptured through this section anyway.
Another mystery is that there were no aftershocks on or near the Sürgü-Çardak Fault during the nine hours between the magnitude-7.8 and the magnitude-7.5 quakes (Figure 3a), according to the ANSS earthquake catalog, which should successfully capture all events greater than or equal to magnitude 4.4 for this region. This is also true of the Turkish AFAD earthquake catalog, which extends down to magnitude-1.0 earthquakes, but which likely missed earthquakes in the first hour after the magnitude-7.8 mainshock (because of so many simultaneous quakes). If the Sürgü-Çardak Fault were close to failure, and received a sudden 3-bar stress increase, why didn’t small shocks immediately appear? Although foreshocks are rare (occurring before about 5% of mainshocks), we would think that the large sudden stress would create the conditions for precursory seismicity — which was not observed.

In contrast, the region extending from the northeast tip of the magnitude-7.8 rupture to the North Anatolian Fault, about 150 to 200 kilometers, is rife with aftershocks. The calculated stress from the northwestern extent of the rupture to Bingöl also increased (Figure 2a). (Notably, the region southeast of Elazığ lacks aftershocks because of a previous earthquake that has already unloaded the stress on that fault segment.)
Similarly, at the southwestern extent of the magnitude-7.8 rupture, aftershocks that trend north-south also illuminate the short distance to the northern tip of the Dead Sea Fault (Figure 2a). The Feb. 20, 2023, magnitude-6.3 aftershock struck in this zone; we calculate that this zone was brought several bars closer to failure by the magnitude-7.8 rupture. (Because the geometry and sense of slip of the magnitude-6.3 shock differs from that of the East Anatolian Fault, we make a separate calculation for it, as shown in Figure 2b.)

These observations suggest that certain segments of the East Anatolian Fault are likely stressed but unruptured because of this sequence, both northeast toward the North Anatolian Fault, south toward the Dead Sea Fault, and possibly also southwest toward Cyprus.
In fact, this updated analysis shows that portions of the East Anatolian Fault to the northeast and southwest of the magnitude-7.8 rupture were more strongly promoted, or stressed, than was the Sürgü-Çardak Fault. We don’t know why these stressed segments of the East Anatolian Fault did not fail, nor do we know why an unstressed section of the Sürgü-Çardak Fault joined the magnitude-7.5 rupture instead. Of course, those sections of the East Anatolian Fault that remain unruptured could still do so.
Toggling mainshock stresses turned aftershocks on and off
In the nine hours after the magnitude-7.8 earthquake struck, numerous aftershocks illuminated the length of the rupture, as expected (Figure 3a). Our calculations show that this event stressed parts of the East Anatolian Fault (red zones, also called trigger zones, in Figure 3a) and the Sürgü-Çardak Fault (red patches along Sürgü-Çardak Fault in Figure 1a; not visible in Figure 3a because Figure 1 uses idealized versions of both rupture surfaces as the receiver faults, and Figure 3a uses only a uniform left-lateral fault, akin to the East Anatolian Fault, as the receiver).
In the nine hours after the magnitude-7.5 earthquake struck, our calculations show that this second major earthquake stressed different portions of the East Anatolian Fault and Sürgü-Çardak Fault (Figure 3b). However, the magnitude-7.5 event also placed the high-slip area of the magnitude-7.8 rupture under a stress shadow (blue zones, Figure 3b), which means that this part of the East Anatolian Fault is inhibited.

So, the magnitude-7.5 quake decreased the stress on the part of the East Anatolian Fault that ruptured during the magnitude-7.8 quake, resulting in fewer aftershocks than would be expected on that section of the fault after a quake of that magnitude. Together, the two quakes “toggled” the stress, as has been seen in double mainshocks (e.g., Toda and Stein, 2003). As a result, there is an increase in aftershock rates where the trigger zones (red regions) from the two mainshocks combine in the northeast, as well as at the western edge of the Sürgü-Çardak Fault (Figure 2); and, there is a drop in the rate of shocks along the magnitude-7.8 high-slip zone (Figure 3b).
The cumulative numbers of aftershocks in the Turkey sequence are low relative to comparable quakes such as the 2008 magnitude-7.9 quake in Wenchuan, China, and the 2016 magnitude-7.8 quake in Kaikoura, New Zealand (Figure 4b). Why the aftershock sequences differ so much is hard to explain, although the stress shadow imparted by the magnitude-7.5 event might have reduced the subsequent quake rate. However, during the first nine hours after the magnitude-7.8 shock, the aftershock rate was extremely low. Only after the magnitude-7.5 struck did the rate of all aftershocks in the region begin to resemble more common earthquake sequences, like after Kaikoura. Regardless of its explanation, if the rate of aftershocks is low, then, based on empirical observations, the probability of large aftershocks is also likely low, which is good news.

Among the faults brought closer to failure, why did the Sürgü-Çardak rupture?
The short answer is: We don’t know. The 150-kilometer-long Sürgü-Çardak Fault (Duman and Emre, 2013, Balkaya et al., 2021) is not optimally aligned for failure. By this, we mean that the tectonic force driving slip (the principal horizontal contraction axis) is roughly aligned north-south in this region; the east-west oriented Sürgü-Çardak Fault is almost perpendicular to this force, whereas a fault aligned 30 to 40 degrees from the principal axis (northeast-southwest or northwest-southeast) — like the East Anatolian Fault — would most be optimally aligned for failure.
All that is known about the seismic history of the Sürgü-Çardak is that it might have hosted a magnitude-6.7 or larger earthquake in 1544 (Ambraseys, 1989). With enhanced GPS station coverage, Kurt et al. (2022) found the slip rate along the epicentral portion of the East Anatolian Fault rupture to be 10 mm/yr. In contrast, those GPS data suggest the Sürgü-Çardak Fault is unlikely to have a slip rate higher than several mm/yr. Duman and Emre (2013) estimate 2.5 mm/yr for the Sürgü-Çardak Fault from geological indicators. All told, a misaligned, low slip-rate fault ruptured in a very large magnitude-7.5 earthquake — a startling turn of events. Thus, we infer that in order to rupture, the Sürgü-Çardak Fault must have very low friction (it must be very slippery).
Key surprise: Neither mainshock nucleated on the East Anatolian Fault
Both large shocks nucleated on faults secondary to the East Anatolian Fault. How do earthquakes this large occur, or at least begin, on minor faults? After traveling only 20 kilometers from the epicenter, the magnitude-7.8 rupture may have transitioned and unzipped at “supershear” speed, in this case about 1.55 times the shear wave velocity (Rosakis et al., 2023). Supershear rupture can cause a “Mach cone or wave” in the Earth, like an airborne sonic boom, except in the ground, that attenuates very little with distance. So, it’s possible that the mach cone promoted the jump to the East Anatolian Fault.
These two earthquakes are not alone: Two other recent large shocks, the 2002 magnitude-7.9 Denali, Alaska (Eberhart-Philipps et al., 2002), and the 2016 magnitude-7.8 Kaikoura, New Zealand (Cesca et al., 2017) earthquakes, also nucleated on secondary faults, and then jumped onto the main faults. This might also have occurred in the 1983 magnitude-6.9 Borah Peak, Idaho, and 1999 magnitude-7.1 Düzce, Turkey, quakes, for which the data are less certain. Whether this is a common or rare phenomenon is not known. But, the ability for a rupture on a small fault to activate slip on a large fault nevertheless complicates fault monitoring and hazard assessment, since most hazard models estimate the maximum earthquake magnitude based on the length of the fault. Because hazard models may not take into account that fact that large earthquakes can begin on smaller faults, they may very well underestimate the hazard posed by such secondary structures. For instance, should a magnitude-6.0 shock occur on the San Andreas Fault, that would cause more alarm than a magnitude-6.0 event on a secondary fault 15-20 kilometers away, though either event could trigger a larger San Andreas event.

A double mainshock or a large aftershock?
Contrary to the often-stated expectation that the largest aftershock will be one magnitude unit smaller than the mainshock, large aftershocks or multiple mainshocks within hours to months of each other are not rare (Kagan and Jackson, 1999). Among many, here are some well-known examples:
- 1811-1812 M 7.2, M 7.0, M 7.4 New Madrid, Missouri (magnitudes from Hough et al., 2000)
- 1905 M 8.0, M 8.3 Bolnay, Mongolia
- 1992 M 7.3 Landers and M 6.5 Big Bear, California
- 1999 M 7.6 Izmit and M 7.2 Düzce, Turkey
- 2006-2007 M 8.3 and M 8.1 Kuril Islands, Japan
- 2019 M 6.4 and M 7.1 Ridgecrest, California
Each set of mainshocks took place within hours to months of each other. Whether one refers to the second shock as an aftershock or a second mainshock (or even the first event as a foreshock) is a semantical choice; what matters, in our view, is that, as best we understand, the first earthquake promoted the second.
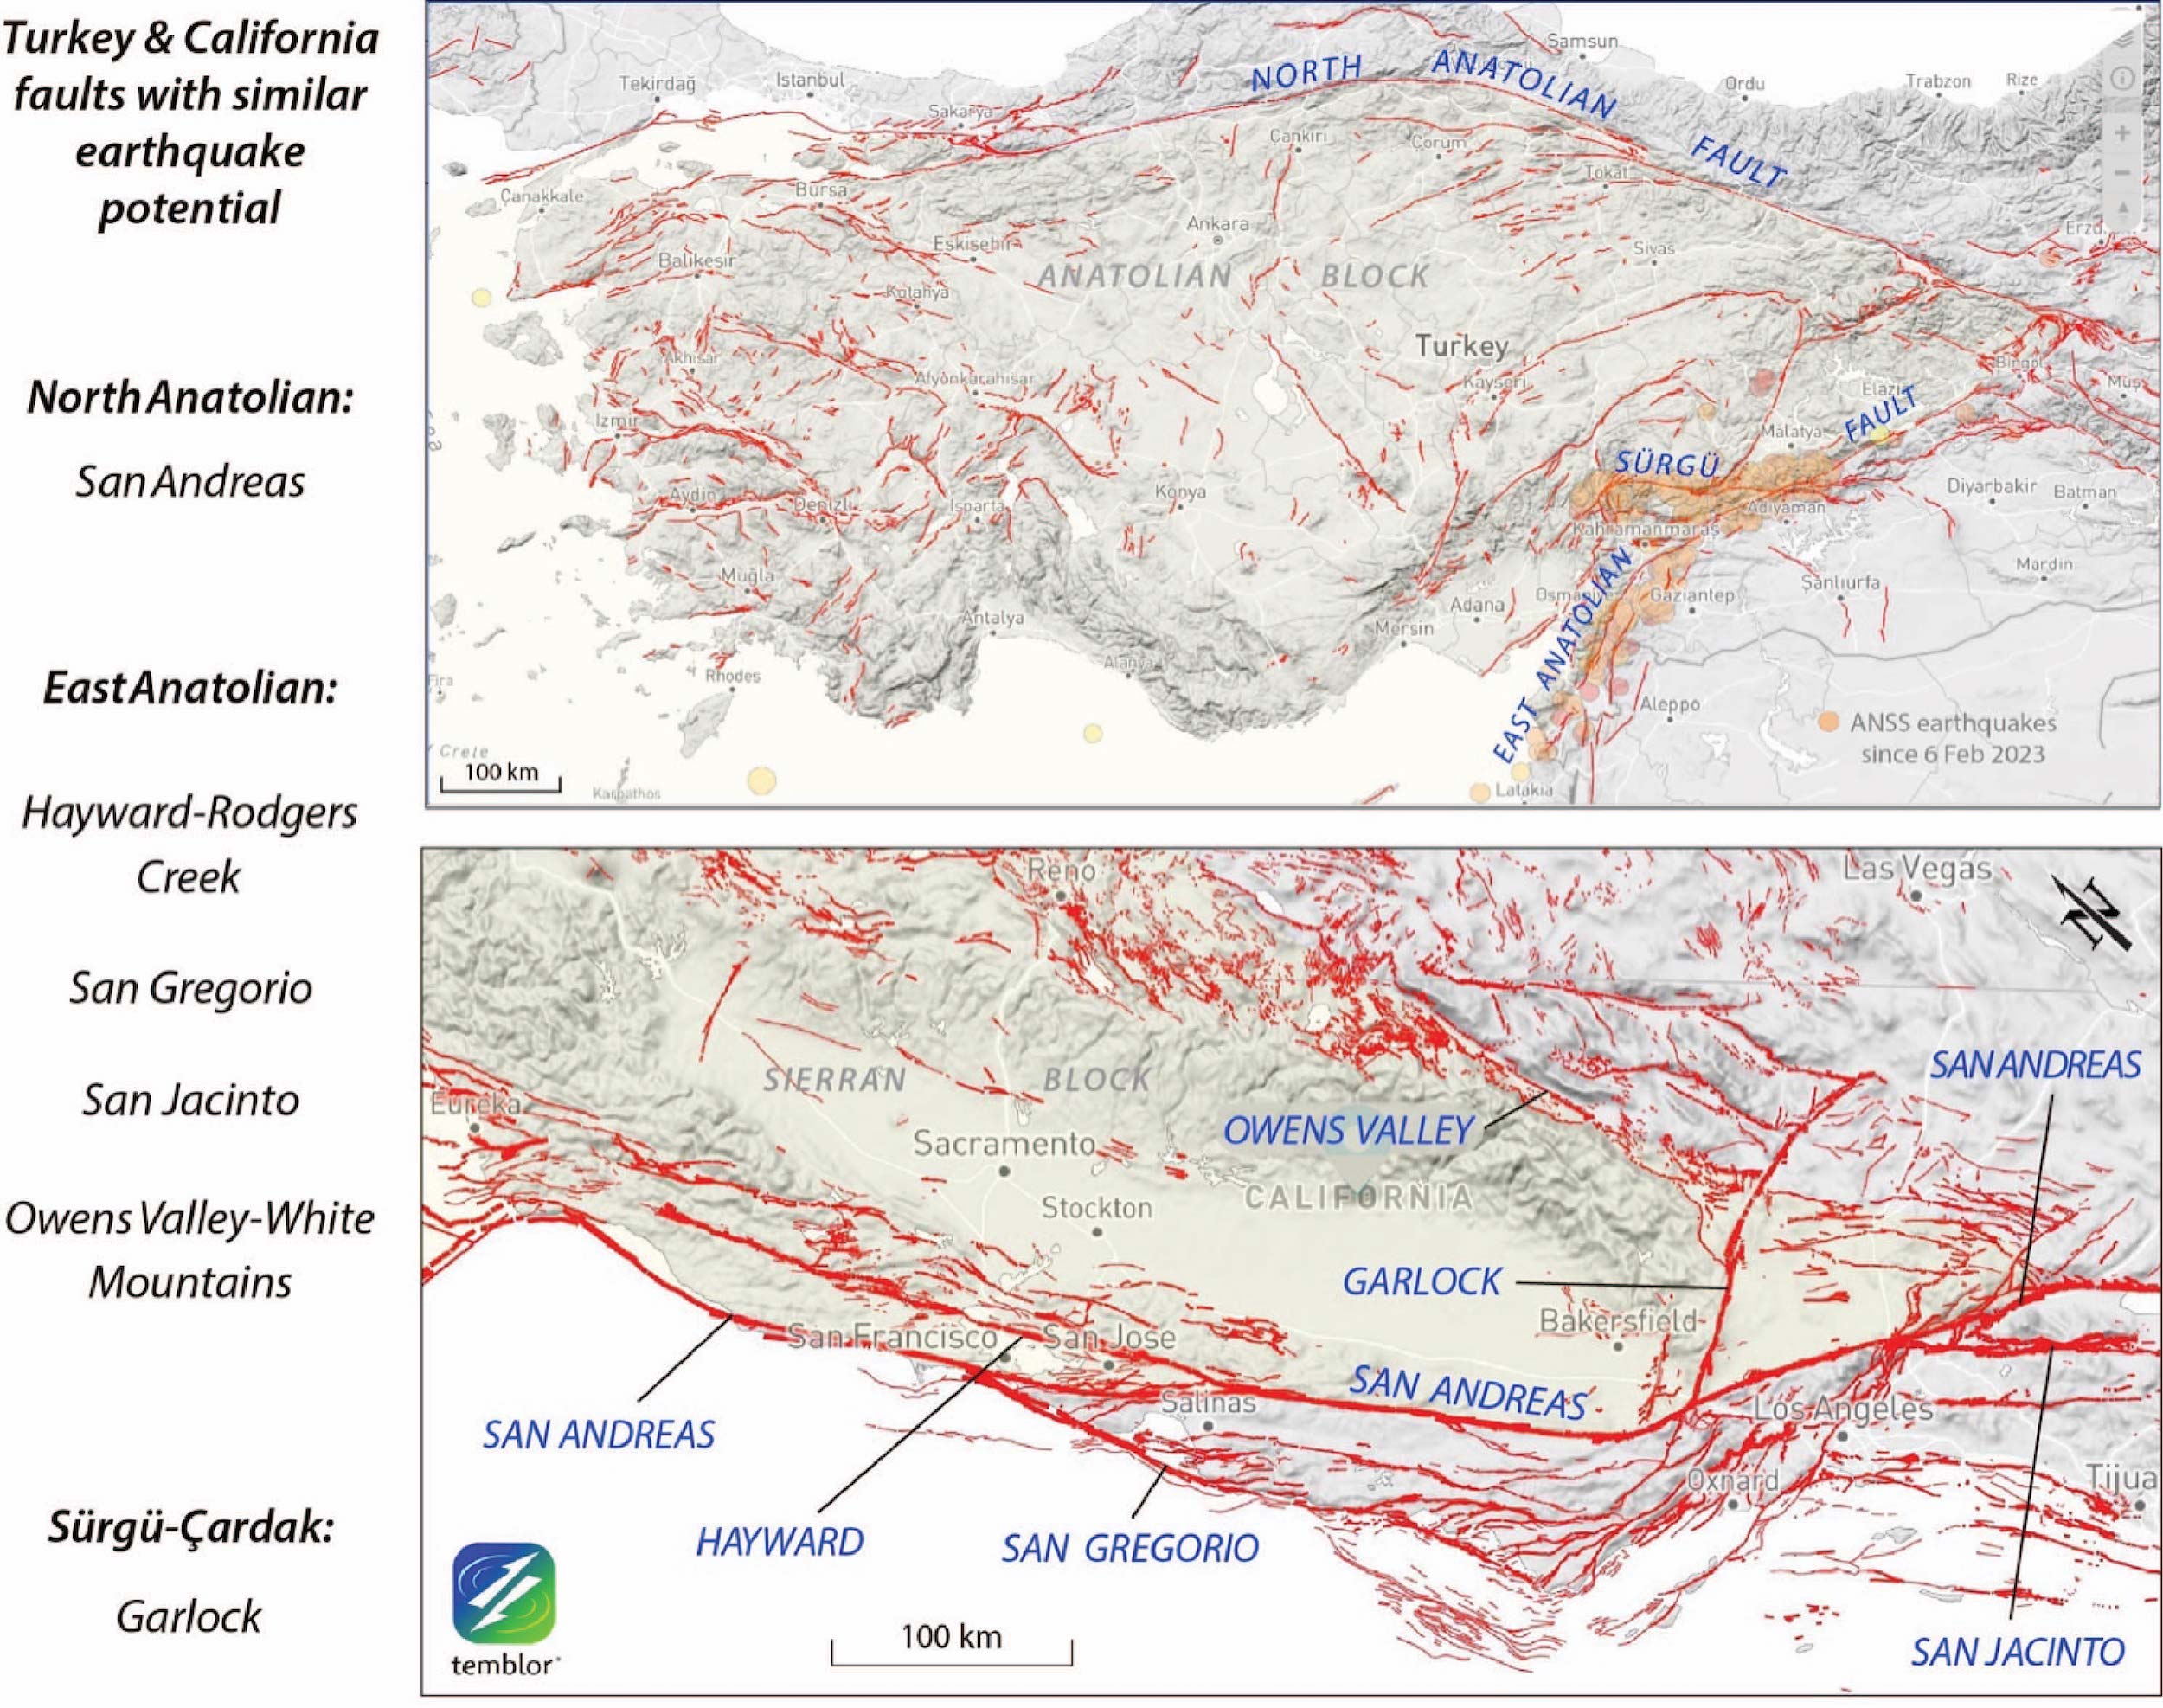
Reflections on the implications for California
In terms of slip rate and length, the East Anatolian Fault resembles the Hayward-Rodgers Creek and San Gregorio faults in northern California, the Owens Valley-White Mountains faults in eastern California, and the San Jacinto Fault in southern California. The Sürgü-Çardak Fault resembles the 250-kilometer-long Garlock in southern California, which has not recently ruptured, but has paleoseismic evidence for large earthquakes (McGill and Sieh, 1993, and Dawson et al., 2003). So, it should now be abundantly clear that magnitude-7.8 (give or take) shocks could also strike on these faults. Both the Garlock Fault and the Sürgü-Çardak Fault are long, non-optimally aligned faults. The Garlock Fault was loaded by up to 10 bars by the 2019 magnitude-7.1 Ridgecrest earthquake (Toda and Stein, 2020); if a magnitude-7.5 shock were to nucleate there, this already-stressed fault could conceivably rupture all the way to where it meets the San Andreas Fault (Figure 6).
The East Anatolian Fault rupture was largely forecast
Two decades ago, Nalbant et al. (2002) analyzed the Coulomb stress transferred by large earthquakes on the East Anatolian Fault Zone over the previous 180 years, and concluded that their stress modeling “clearly indicates a buildup of stress in the Kahramanmaraş region [which extends between the cities of Kahramanmaraş and Malatya] of the East Anatolian Fault Zone” (Figure 7a). That section of the fault, along with the section to the southwest and northeast, ruptured in the 2023 earthquake. Nalbant et al. (2002) did not assign an earthquake magnitude or probability of rupture. In contrast, they calculated a low stress buildup on the section of the fault between Kahramanmaraş and Antakya (between K and A in Figure 7a), because it last had an earthquake in 1822, which they placed along the Amanos segment. But the Kahramanmaraş-Antakya section also ruptured in the 2023 magnitude-7.8 earthquake.
A decade later, Duman and Emre (2013) compared the slip rate inferred for each fault segment along the East Anatolian Fault to the recency of the last large earthquake on each segment. Unlike Nalbant et al. (2002), Duman and Emre placed the 1822 earthquake on the Yesemek segment, which has fresher fault-related morphology than the Amanos segment (Figure 7b). They concluded: “Taking account of the time elapsed from the latest events on the East Anatolian Fault, we suggest that the Pazarcık and Amanos segments have the potential to produce destructive earthquakes in the near future.” Their conclusion proved prescient, as these two segments participated in the 2023 magnitude-7.8 rupture, along with the Erkenek segment to the northeast.

It’s essential to emphasize that neither of these studies issued a forecast in the strict sense: They did not indicate the probability during a given time period of an earthquake of a given size range in a given area. They nevertheless identified where a large quake was most likely to strike along the East Anatolian Fault, a signal achievement.
These studies are a testament to the quality of the fault mapping (Emre et al., 2018), analysis of the historical earthquake record (Ambraseys, 1989), and seismic (AFAD and KOERI) and geodetic (Tubitak and General Directorate of Mapping) monitoring in Turkey. Nalbant et al. (2002) and Duman and Emre (2013) differed in some key elements; for example, they placed the 1822 earthquake on different fault strands. But by independent means, they reached a broadly similar conclusion that — in hindsight — was emphatically correct.
Studies like these helped point out the hazard on the East Anatolian Fault. This constitutes scientific progress and provides potentially useful information for civic authorities. Based on these and other studies, there was consensus in the scientific community that the East Anatolian Fault had not demonstrated a progressive failure as observed on the North Anatolian Fault, which might indicate that its time was due. The government then made use of the results of these papers to develop a seismic hazard map, out of which came the building codes. Those codes were enforced and controlled to varying degrees and with varying success (Erdik et al., 2023).
Acknowledgments. We thank Dara Goldberg (USGS) for the rapid calculation and release of the USGS source (“Finite Fault”) models, and for her assistance with their parameterization.
Science editor: Dr. Alka Tripathy-Lang, Ph.D.
Reviewer: Dr. Wendy Bohon, Ph.D.
References
Aktug, B., Ozener, H., Dogru, A., Sabuncu, A., Turgut, B., Halicioglu, K., Yilmaz, O., Havazli, E. (2016). Slip rates and seismic potential on the East Anatolian Fault System using an improved GPS velocity field. Journal of Geodynamics, 94, 1-12, https://doi.org/10.1016/j.jog.2016.01.001.
Erdik, M., Tümsa, M. B. D., Pınar, A., Altunel, E., and Zülfikar, A. C. 2023, A preliminary report on the February 6, 2023 Earthquake in Türkiye, http://doi.org/10.32858/temblor.297.
Ambraseys, N. N. (1989). Temporary seismic quiescence: SE Turkey. Geophysical Journal International, 96(2), 311-331, https://doi.org/10.1111/j.1365-246X.1989.tb04453.x.
Balkaya, M., Ozden, S. Akyüz, H. S. (2021). Morphometric and Morphotectonic characteristics of Sürgü and Çardak Faults (East Anatolian Fault Zone), Journal of Advanced Research in Natural and Applied Sciences, 7, 375-392, https://doi.org/10.28979/jarnas.939075.
Cesca, S., Zhang, Y., Mouslopoulou, V., Wang, R., Saul, J., Savage, M., Heimann, S., Kufner, S.-K., Oncken, O., Dahm, T. (2017). Complex rupture process of the Mw 7.8, 2016, Kaikoura earthquake, New Zealand, and its aftershock sequence. Earth and Planetary Science Letters, 478, 110-120, https://doi.org/10.1016/j.epsl.2017.08.024.
Dawson, T. E., McGill, S. F., Rockwell, T. K. (2003). Irregular recurrence of paleoearthquakes along the central Garlock fault near El Paso Peaks, California, J. Geophys. Res. 108, https://doi.org/10.1029/2001JB001744.
Duman, T. Y., Emre, Ö. (2013). The East Anatolian Fault: geometry, segmentation and jog characteristics. Geological Society, London, Special Publications, 372(1), 495-529, https://doi.org/10.1144/SP372.14.
Eberhart-Phillips, D., Haeussler, P. J., Freymueller, J. T., Frankel, A. D., Rubin, C. M., Craw, P., Ratchkovski, N. A., Anderson, G., Carver, G. A., Crone, A. J., Dawson, T. E., Fletcher, H., Hansen, R., Harp, E. L., Harris, R. A., Hill, D. P., Hreinsdóttir S., Jibson, R. W., Jones, L. M., Kayen, R., Keefer, D. K., Larsen, C. F., Moran, S. C., Personius, S. F., Plafker, G., Sherrod, B., Seih, K., Sitar, N., Wallace, W. K. (2003). The 2002 Denali Fault earthquake, Alaska: A large magnitude, slip-partitioned event. Science, 300(5622), 1113–1118. https://doi.org/10.1126/science.1082703
Harris, R. A., Simpson, R. W. (1998). Suppression of large earthquakes by stress shadows: A comparison of Coulomb and rate‐and‐state failure. Journal of Geophysical Research: Solid Earth, 103(B10), 24439-24451, https://doi.org/10.1029/98JB00793.
Hough, S. E., Armbruster, J. G., Seeber, L., Hough, J. F. (2000). On the modified Mercalli intensities and magnitudes of the 1811–1812 New Madrid earthquakes. Journal of Geophysical Research: Solid Earth, 105(B10), 23839-23864, https://doi.org/10.1029/2000JB900110.
Kagan, Y. Y., Jackson, D. D. (1999). Worldwide doublets of large shallow earthquakes. Bulletin of the Seismological Society of America, 89(5), 1147-1155, https://doi.org/10.1785/BSSA0890051147.
McGill, S., Sieh, K. (1993). Holocene slip rate of the central Garlock fault in southeastern Searles Valley, California. Journal of Geophysical Research: Solid Earth, 98(B8), 14217-14231, https://doi.org/10.1029/93JB00442.
Nalbant, S. S., McCloskey, J., Steacy, S., Barka, A. A. (2002). Stress accumulation and increased seismic risk in eastern Turkey. Earth and Planetary Science Letters, 195(3-4), 291-298, https://doi.org/10.1016/S0012-821X(01)00592-1.
Reitman, N. G., Briggs, R. W., Barnhart, W. D., Thompson Jobe, J. A., DuRoss, C. B., Hatem, A. E., Gold, R. D., Mejstrik, J. D., Akçiz S. (2023) Preliminary fault rupture mapping of the 2023 M7.8 and M7.5 Türkiye Earthquakes. https://doi.org/10.5066/P985I7U2.
Rosakis, A., Abdelmeguid, M., Elbanna, A. (2023), Evidence of early supershear transition in the Mw 7.8 Kahramanmaraş earthquake from near-field records, EarthArXiv, https://doi.org/10.31223/X5W95G.
Toda, S., Stein, R. (2003). Toggling of seismicity by the 1997 Kagoshima earthquake couplet: A demonstration of time‐dependent stress transfer. Journal of Geophysical Research: Solid Earth, 108, https://doi.org/10.1029/2003JB002527.
Toda, S., Stein, R. S. (2020). Long-and short-term stress interaction of the 2019 Ridgecrest sequence and Coulomb-based earthquake forecasts. Bulletin of the Seismological Society of America, 110(4), 1765-1780, https://doi.org/10.1785/0120200169.
Toda, S., Stein, R. S., Özbakir, A. D., Gonzalez-Huizar, H., Sevilgen, V., Lotto, G., and Sevilgen, S., 2023, Stress change calculations provide clues to aftershocks in 2023 Türkiye earthquakes, Temblor, http://doi.org/10.32858/temblor.295.
USGS Geologic Hazards Science Center and Collaborators (2023), The 2023 Kahramanmaraş, Turkey, Earthquake Sequence (as of February 22, 2023), https://earthquake.usgs.gov/storymap/index-turkey2023.html.
- Venezuela’s doublet leaned toward Caracas - June 30, 2026
- Is Southern California’s Cajon Pass an ‘earthquake gate’ ready to open? - June 29, 2026
- Philippines magnitude 7.8 shock may have loaded the central Cotabato subduction zone - June 11, 2026