At 4:17 a.m. on Feb. 6, 2023, a magnitude-7.8 earthquake struck near Pazarcık City in south-central Türkiye, followed by a magnitude-7.5 event about 9 hours later. In this report, scientists from Türkiye explain what happened, including the complexity of the rupture itself, ground motion, building codes, and damages.
By M. Erdik, Turkish Earthquake Foundation, M. B. D. Tümsa, Turkish Earthquake Foundation, A. Pınar, Boğaziçi University, Istanbul, Turkey, E. Altunel, Eskişehir Osmangazi University, Engineering Faculty, Department of Geology, 26040 Eskişehir-Turkey, A. C. Zülfikar, Gebze Technical University, Department of Civil Engineering
Citation: Erdik, M., Tümsa, M. B. D., Pınar, A., Altunel, E., and Zülfikar, A. C., 2023, A preliminary report on the February 6, 2023 earthquakes in Türkiye, http://doi.org/10.32858/temblor.297
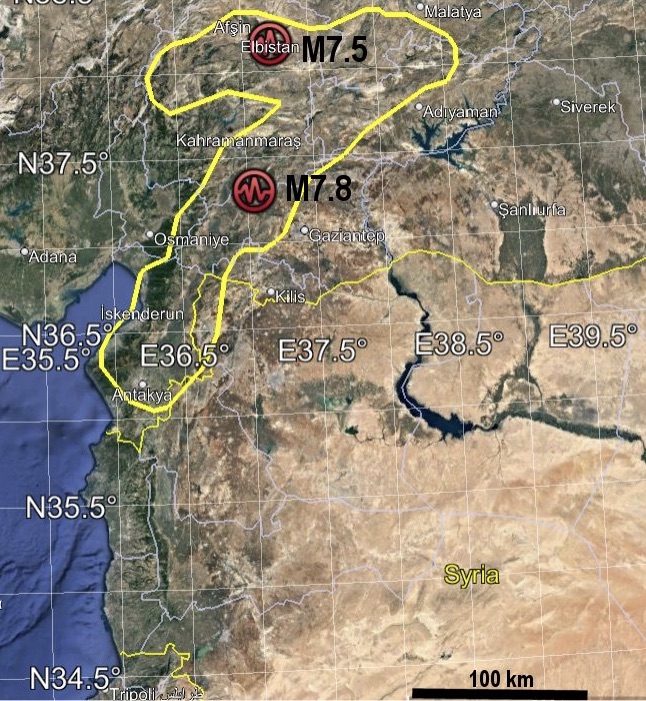
On Feb. 6, 2023, a magnitude-7.8 earthquake struck at 4:17 a.m. local time near Pazarcık City in south-central Türkiye. This earthquake was followed by a second earthquake of magnitude 7.5 at 1:24 p.m. with the epicenter in Elbistan City. Both events are associated with the East Anatolian fault system. The two earthquakes were felt as far away as Syria, Cyprus, Greece, Jordan, Lebanon, Iraq, Georgia, Armenia, Egypt, and Israel.
Figure 1 shows the epicenters of these two earthquakes and the contour for MMI VII, the Modified Mercalli Intensity of shaking that resulted in light-to-medium damage for buildings in Türkiye. This contour (thick yellow line in Figure 1) shows the approximate boundary of regions significantly affected by the earthquakes and encompasses the ruptured segments of the fault and the higher intensities that reached MMI X levels.
As of Feb. 23, 2023, the death toll from the Türkiye earthquakes has reached 43,566 in Türkiye alone. The number of collapsed buildings and heavily damaged buildings that must be demolished has reached 156,000. The number of buildings sustaining medium and light damage is around 43,000. The number of housing units within those collapsed and heavily damaged buildings is around 507,000, indicating the size of emergency housing needed for earthquake victims. We expect this number to rise.
The earthquakes came as winter storms impacted the region, with freezing temperatures and snowfall. These conditions unfortunately have compounded the challenges faced by the extensive search and rescue operations conducted by local teams, who are supported by international teams.
This preliminary report is intended to provide correct and current (as of Feb. 23) information regarding the geo-tectonic and seismic characteristics of these earthquakes, as well as a discussion of the strong ground motions and the structural damage observed in the region.
Seismotectonics
The magnitude-7.8 event of Feb. 6, 2023 is Türkiye’s most powerful earthquake recorded since 1939, when the magnitude-7.8 Erzincan earthquake, struck northeastern Turkey along the right-lateral strike-slip North Anatolian fault system. The 1939 event ruptured a 360 kilometer long fault with a horizontal offset of up to 7 meters. Estimates suggest about 33,000 lives were lost.
The pair of recent earthquakes struck on the East Anatolian Fault Zone — one of the major active tectonic structures of the Eastern Mediterranean region (Figure 2a). This fault moves with left-lateral strike-slip sense of motion. It has been relatively quiet compared to its northern neighbor over the past century or so.
The northeast-southwest trending, 550 kilometer-long East Anatolian Fault Zone constitutes the southeastern boundary of the westward-moving Anatolian Block. The structure accommodates the relative motion between the Anatolian Block and the Arabian Plate (e.g., Şengör et al., 1985; Dewey et al., 1986; Barka and Kadinsky-Cade, 1988; Barka and Reilinger, 1997). Slip rate ranges from 4 to 31 millimeters per year, based on different criteria, including geological data (e.g., Arpat and Şaroğlu 1975, Westaway and Arger 1996, Yönlü et al. 2017), GPS data (e.g., McClusky et al. 2000, Reilinger et al. 2006), plate kinematic analysis (e.g. Lyberis et al. 1992, Yürür and Chorowicz 1998) and seismological data (Taymaz et al. 2004). Total offset ranges from about 15 to 27 kilometers (e.g., Arpat and Şaroğlu, 1975).
The East Anatolian Fault Zone runs from Karlıova in the northeast, truncating at the North Anatolian Fault Zone. As the East Anatolian Fault Zone continues to the southwest, it is divided into several distinct geometric segments based on fault step-overs, jogs, or changes in fault strike (e.g., Arpat and Şaroğlu, 1975; Şengör et al., 1985; Muehlberger and Gordon, 1987; Şaroğlu et al., 1992; Duman and Emre 2013). A left-lateral fault separates from the East Anatolian Fault Zone southwest of Çelikhan and extends westward, toward Göksun. It is on this fault that the second Feb. 6 event, the magnitude-7.5 earthquake, occurred.
The main trace of the fault zone between Karlıova in the northeast and Türkoğlu in the southwest is generally agreed upon. However, the southwestern continuation beyond Türkoğlu is debated, as summarized in Yönlü et al. (2017), with three possible scenarios:
1. Near Türkoğlu, the Dead Sea Fault Zone could intersect the East Anatolian Fault Zone, which might cross the Amanos Mountains and extend to Iskenderun Bay (e.g., McKenzie, 1970, 1972; Dewey et al., 1973; Şengör, 1980; Hempton, 1987; Jackson and McKenzie, 1984; Barka and Kadinsky-Cade, 1988; Kempler and Garfunkel, 1991; Westaway and Arger, 1996; Koçyiğit and Erol, 2001, Yönlü et al. 2017).
2. The Dead Sea Fault Zone could connect with the East Anatolian Fault Zone via the Karasu Fault near Türkoğlu, but the East Anatolian Fault Zone might not extend further southwest, as it does scenario 1 (e.g. Lovelock, 1984; Muehlberger and Gordon, 1987; Perinçek and Çemen, 1990; Chorowicz et al., 1994; Yürür and Chorowicz, 1998).
3. The East Anatolian Fault Zone could extend along the Karasu Segment in the Karasu Valley to the south, eventually meeting the Dead Sea Fault Zone in the Amik Basin (e.g., Allen, 1969; Arpat and Şaroğlu, 1975; Kelling et al., 1987; Şaroğlu et al., 1992; Şengör et al., 1985; Över et al., 2004; Duman and Emre, 2013).
As stated in the first scenario, if the East Anatolian Fault Zone extends towards the Iskenderun Bay, the interaction between the two fault zones in the southwest may be important for stress transfer during large events.

Seismological characteristics
The source regions of the two earthquakes are clearly depicted by the aftershock distribution located by Kandilli Observatory and Earthquake Research Institute (KOERI). The pink and purple colors of the solid circles in Figure 3 show the source extent of the first and second major earthquakes, denoting approximately 400 kilometer- and 200 kilometer-long rupture lengths, respectively. In both cases, the rupture propagated bilaterally. The aftershock distribution of the magnitude-7.8 event toward the northeast terminated near the source area of the second magnitude-7.5 event that ruptured approximately nine hours later.

The curvature in the aftershock distribution associated with the magnitude-7.8 event suggests ruptures on different segments during that event. To the northeast, the rupture is oriented northeast-southwest, whereas in the southern section, toward Hatay, the strike shifts, and is oriented north-northeast to south-southwest.
Rupture complexity
The rupture complexity of the magnitude-7.8 event is also observed at the strong motion station located approximately 30 kilometers from the epicenter and from a slip distribution model obtained through modeling of the teleseismic body waves using the algorithm of Kikuchi et al. (1991), as shown in Figure 4b. One can see three distinct pulses, especially in the displacement seismogram (lower panel of Figure 4a, obtained by integrating the acceleration seismogram twice). The narrow nature of the first pulse suggests a rupture propagation toward the station while the second, wider pulse at 30 seconds suggests rupture propagation away from the station (Figure 4a), toward the southwest along a fault portrayed by the aftershock distributions (Figure 3).

A large pulse for the magnitude-7.8 event is noticeable in the later portion of the seismogram, as shown in Figure 5a. Such a late arrival could reflect either a fault rupture or a seismic phase generated at an unknown interface. Modeling this pulse as a fault rupture yields a long moment rate function denoting a rupture time of about 80 seconds.
The waveforms recorded at the Matsushiro station (MAJO) in Japan are selected to show the extraordinarily long rupture time (Figure 5). The MAJO station is nearly equidistant to the epicenters of both the magnitude-7.8 and magnitude-7.5 earthquakes. Therefore, the lack of the late phase arrival in the seismogram of the magnitude-7.5 event supports the hypothesis that the pulse in the magnitude-7.8 earthquake is associated with additional fault rupture.

Despite the two events being relatively close in size, the waveform modeling of the teleseismic body waves shows a rather simple rupture pattern for the magnitude-7.5 event (Figure 5b). The rake angles derived at each grid point denote strike-slip faulting. Slight compression and extension components are developed at the eastern and western sections of the source area. This fact is also observed from the focal mechanisms of the aftershocks reported by the European Mediterranean Seismological Center (EMSC).
Regional deformation and seismicity patterns
One way to examine regional deformation patterns is to use GPS data, which gives information about how tectonic plates are moving relative to one another. Palano et al. (2017) published a significant GPS dataset established by reprocessing the available GPS data acquired by Hessami et al. (2006), Reilinger et al. (2006), Walpersdorf et al. (2006, 2014), Masson et al. (2007), Tavakoli et al. (2008), Peyret et al. (2009), Djamour et al. (2011), Mousavi et al. (2013), Palano et al. (2013) and Zarifi et al. (2013).
Adopting the Shen et al. (2015) algorithm, we interpolated the GPS data from Palano et al. (2017) to get slip rates at equally spaced grid points. Then, we estimated a strain rate tensor at each grid point to understand the spatial deformation pattern surrounding the source region of the two major earthquakes. We assessed the second invariant strain rates in Figure 6, the instrumental period seismicity since 1900 shown in Figure 7, and the MTA (General Directorate of Mineral Research and Exploration) active faults (Emre et al., 2012) together. The second invariant strain rates in Figure 6 show us where deformation rates are high and where they are not.
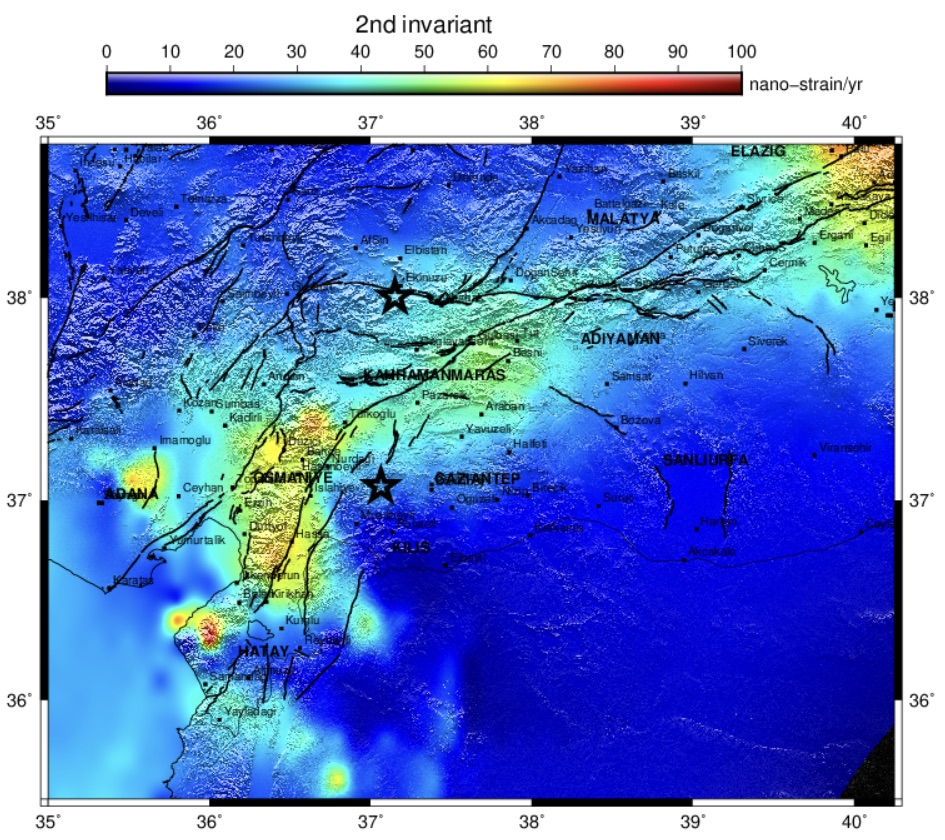
Relatively large strain rates are observed around Osmaniye, at the southwest section of the East Anatolian Fault Zone. This region is bordered by distinct faults to the east and west that trend north-northeast to south-southwest. These faults could be considered as locked, and therefore accumulating strain because both faults serve as boundaries between high and low-strain rate regions. Of these two border faults, the one east of Osmaniye lacks seismicity, and is noticeably portraying ongoing strain accumulation (Figure 6). This fault is one of the segments ruptured by the magnitude-7.8 earthquake of Feb. 6. On the western border fault, the seismicity may suggest that on this side, the fault may not be wholly locked (Figure 7).

Another finding derived from the seismicity and strain rate maps is observed along the fault ruptured by the second magnitude-7.5 event earthquake of Feb. 6, 2023. Between 1900 to March 2021 (the end time of the reviewed ISC catalog), no events of magnitude 4.0 or greater are observed along this fault. Similarly, the fault segment to the northeast of the epicenter of the magnitude-7.8 event lacks seismicity. This observation suggests that this fault segment experienced a major coseismic moment release, leading to its rupture during the first earthquake.
Assessing ground motion
The Turkish Accelerometric Database and Analysis System (TADAS) managed by AFAD (Disaster and Emergency Management Presidency) published all seismic records after the earthquakes. The magnitude-7.8 and magnitude-7.5 events were recorded by 291 and 267 stations, respectively. AFAD has updated the information on its web page several times since the earthquakes. The strong motion data used in the analysis is the current version as of Feb. 15, 2023.
The horizontal peak ground acceleration (PGA, in units of centimeters per second squared) and the peak ground velocity (PGV, in units of centimeters per second) associated with the magnitude-7.8 earthquake are shown in Figures 8 and 9. White lines in these figures indicate the fault rupture. The peak ground acceleration values and the peak ground velocity values are much higher in the Hatay Province to the southwest, likely a result of basin amplification effects, as well as directivity effects. Similar plots are given in Figures 10 and 11 for the magnitude-7.5 earthquake.


In Figures 8 and 9, the severity of the earthquake ground motion during the magnitude-7.8 event, particularly the peak ground velocity in long period ranges, probably exacerbated damage to tall buildings in Hatay due to the presence of the Amik Basin as indicated in Figure 12 (Karabacak et. al 2010). Hatay’s Amik Basin is a Holocene sediment-filled basin, bounded to both the east and west by two strands of the Dead Sea Fault System. The basin covers a surface area of 50 kilometers by 20 kilometers and reaches a depth of about 1 kilometer. This basin has probably been the site of several devastating earthquakes, such as the 526 Antioch (today, Antakya-Hatay in Türkiye) earthquake that may have caused the death of approximately 250,000 people.
The Amik Basin is instrumented by a strong motion network (Durukal et al, 2009), which provides data for an analysis of ground motion characteristics experienced in this earthquake. The transfer function, calculated by comparing records from stations located on different substrates (Figure 12), provides information about site amplification. We would expect sediment to amplify ground motion. In Figure 12, we show the transfer function between the ground motion observed in the Amik Basin (stations 3123 and 2124) versus the neighboring strong motion recording stations installed in stiff substrate (e.g., bedrock versus sediment, stations 3136 and 3140, respectively). The transfer function shows two to three times amplification of the long-period ground motion in the basin, which can be seen in the crucial 0.5-1.0 second band (Figure 12b).

Directivity pulses
Large strike-slip earthquakes are generally associated with near-fault effects, such as rupture directivity pulses (directivity refers to energy focused along the fault in the direction of rupture, which can result in a large pulse of motion), which can be identified from examining the velocity and displacement time histories from an earthquake (e.g., Figure 4). Such ground motions have the potential to cause severe damage, especially to long-period structures (Somerville and Graves, 1993). Long-period structures include tall buildings, bridges with long spans, seismically isolated structures and large liquid tanks, all of which need to be designed to withstand long-period ground motion. Understanding these pulses are important for long-period structure design (Erdik et al., 2023). The extraction of such pulses from strong motion records — their shape, period and amplitude — can help with codes and earthquake-resistant engineering.
For the magnitude-7.8 event, directivity pulses can be identified in seismic records from near-fault stations, like NAR and 4615, as illustrated in Figure 13. For the identification of these pulses, we used the procedure of Baker (2007). This procedure uses a wavelet-based signal decomposition to identify and extract the largest velocity pulse from a recording of ground motion. If the extracted signal is large relative to the remaining signal, the ground motion is classified as “pulse-like.” The pulses identified in Figure 13 are only a preliminary observation of the near-fault effects associated with these earthquakes and warrant further study.

Comparison between ground motion spectra and code-based spectra
The two destructive earthquakes were recorded by stations spanning a large region, which allows for comparison between measured ground motion spectra and the spectra used to create building codes.
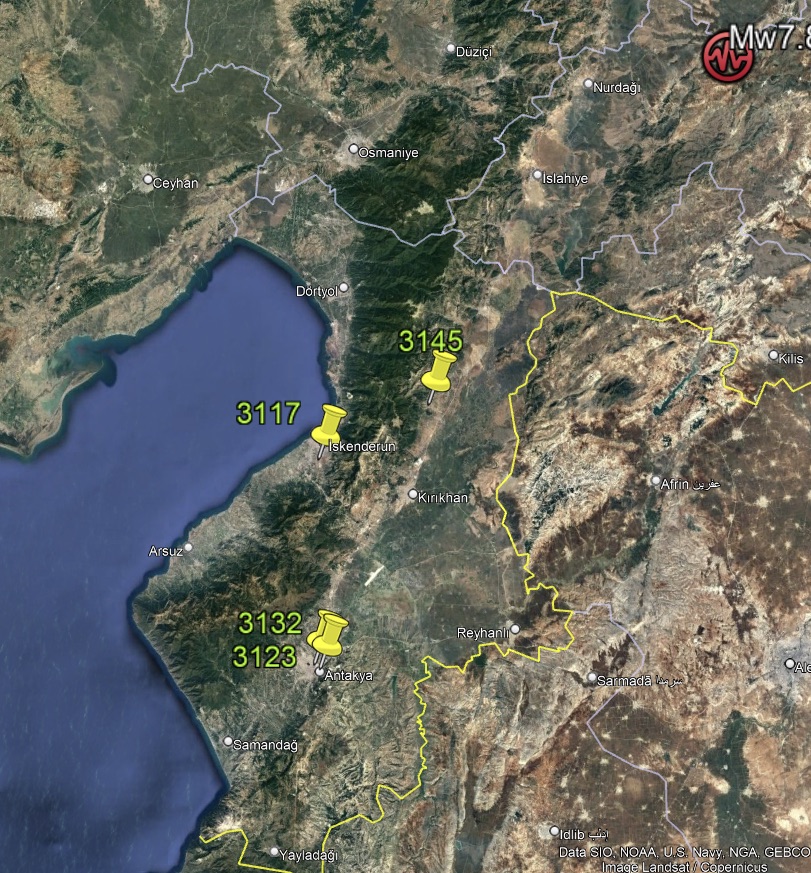
The 5% damping ratio provides the basis for designing earthquake-resistant buildings. To compare the recorded motion from the recent earthquakes with the spectra used to create the building codes, the recorded spectra must be converted to the 5%-damped horizontal response spectra. We did this for data from four stations — 3132, 3117, 3123, and 3145 — located at urban centers (Figure 14). This provides a comparison of the 5%-damped horizontal response spectra of the recorded motion during the earthquakes with the site-specific design basis spectra provided in the 2018 earthquake-resistant design code of Türkiye (TBDY, 2018). In other words, we can compare the movement at these four urban stations with the motion spectra upon which Türkiye’s building codes rely.
The building code-based spectra, hereafter called code-based spectra, are obtained through probabilistic seismic hazard assessment and are provided for average return periods of 2,475 years (DD-1), 475 years (DD-2), 72 years (DD-3), and 43 years (DD-4). Residential buildings are generally designed considering the 475-year return period spectrum.
Figure 15 provides these comparisons for the magnitude-7.8 earthquake. In Figure 15a and b, the empirical ground-based spectra associated with stations 3145 and 3123, located in Hatay Province, measured in excess of even the 2,475-year code-based spectra for periods larger than 0.5 seconds. In Figure 15c and d, the empirical ground-based spectra at stations 3132 and 3117, also located in Hatay Province, more closely resemble the code-based spectra. This implies that in some places, the shaking was more than the buildings were designed to withstand, even if they were built to code.

Building losses
Ten provinces, including the hard-hit Hatay, Kahramanmaraş, Gaziantep and Adıyaman provinces, were heavily affected by building damage. State Bureau of Statistics indicates there are about 3.9 million housing units in these 10 provinces, with 40% of them built prior to the earthquake-resistant design code change in 2000. These 10 provinces provide 10% of the GDP in Türkiye, largely related to agriculture, industry and service.
The number of heavily damaged and collapsed buildings in Hatay, Kahramanmaraş, Gaziantep and Adıyaman provinces are 10,911, 10,777, 11,922 and 6,108, respectively, which constitutes between 10%-20% of the total building stock. A substantial percentage of the collapsed buildings were reportedly constructed prior to 2000, when revised earthquake-resistant design code and design-construction controls were instituted.
The predominant structural system used for buildings in urban areas of the region consists of reinforced concrete frames with a symmetric floor plan and unreinforced masonry infill walls. For infill walls, typically, hollow clay tiles are used with inadequate mortar at the joints. Although not intended, these walls form the first line of resistance against an earthquake and, in many cases, control the lateral drift, which is the amount of sway between adjacent floors in a building. Once the infill walls fail, the lateral resistance comes from the reinforced concrete frames and, if available, from shear walls that can transfer lateral forces from a building’s exterior to its foundation.
According to field investigation reports, in buildings that were either heavily damaged or collapsed, these load-bearing structural elements had low concrete quality, inadequate reinforcement, and/or poor detailing. The extensive inelastic action at the critical junctions in the buildings’ structures caused the formation of a hinge at the connection of columns with the beams, thereby creating mechanisms that led to pancake-type collapses, where the floors pile up on each other (Figure 16). This is the worst type of collapse mechanism and has been documented in many images from the news media.

There are many reinforced concrete buildings in Türkiye designed to adhere to modern building codes, but there are also many other (generally older) buildings with non-ductile concrete framing that is brittle and prone to total collapse during strong earthquake shaking, as seen in these two earthquakes.
The buildings that conform to the codes likely sustained damage, but did not collapse, and likely did not cause fatalities. The non-conformity to earthquake-resistant design codes is clearly evident in the binary distribution of earthquake damage. Recall that comparatively few buildings sustained medium damage — most were either lightly damaged or heavily damaged/collapsed. Only about 7% of buildings sustained medium damage, whereas, for example, in the fragility functions provided in HAZUS 4.2 SP3 (2020) for Concrete Moment Frame buildings (the type generally used in Türkiye), this varied between 30% to 35% depending on the ground motion intensity level. If codes were followed, we would expect to see such a damage distribution.
Therefore, the poor earthquake performance of most buildings in these two earthquakes is due to non-compliance with Türkiye’s earthquake-resistant design codes. The contrasting performance between similar buildings that survived (mostly with some damage) and those that failed provides evidence that conformity with the design code and good construction practices can limit damage during strong earthquakes.
In addition to the code-conformity problems, the damage sustained by buildings built to code can be attributed to the severity of the earthquakes’ ground motions. As can be seen in Figures 15 and 16, at several locations of the earthquake-affected region, the design basis response spectrum (associated with 475-year, or DD-2, average return period ground motion) stays under the spectrum of the observed ground motion. In fact, the ground motion seems to resemble the 2,475-year (DD-1) average return period ground motion. The medium-to-long period ground motion, starting about 0.5 seconds to 1 second, stays above even the 2,475-year average return period ground motion (Figure 15). This period range coincides with structures of 6 to 12 stories and has certainly contributed to the damage of such buildings. Although the code-conforming buildings can have reserve capacity to accommodate such extra demand, the non-code-conforming buildings can certainly experience total collapse.
Moreover, the degree of earthquake damage (losses) was predictable. Basic earthquake insurance premium rates (TDV, 2018; TDV, 2010) use the loss ratio of buildings, which is the cost of retrofit relative to the cost of construction of the building prior to earthquake damage. The average building loss ratio under exposure to 475-year (DD-2) and 2,475-year (DD-1) ground motions in the four hardest-hit cities are 16% and 37%, respectively (TDV, 2018). In other words, the government expected to lose 16% of its buildings in earthquakes that occur about every 500 years, and 37% of its buildings in earthquakes that occur about every 2,500 years. With an approximately 20% loss of buildings in the Feb. 6 events, that is what happened.
The history of seismic design codes in Türkiye dates back to the 1940s, after which many revisions and updates have been published. It appears that most of the heavily damaged and collapsed buildings were designed using recommendations given in 1975. The buildings constructed between 1997 and 2007 were designed according to the 1997 code or the 2007 code. Only a few buildings in the region were likely designed according to the 2018 code, which, in most cases, follows the ASCE 7-16 requirements.
The 2018 code has sections on different structures (e.g., tall buildings, seismically isolated buildings, light steel buildings, timber buildings) and also introduces a performance‐based design approach. The recent code versions are more reliable than the previous ones, which have limited coverage of ductility, detailing, and capacity design principles. Nevertheless, the buildings constructed according to the 1975 code performed well in previous earthquakes, such as the 1999 magnitude-7.6 Kocaeli earthquake (sometimes called the İzmit earthquake).
In 2001, to control the code-conformance problems after the 1999 Kocaeli earthquake, the government instituted a building design and construction inspection system to ensure compliance. In this system, building owners were free to choose any inspection firm. In 2019, an amendment was made to assign building firms through an electronic system in order to avoid misconduct (i.e., illegal dealings between building inspection firms and building owners) created by this freedom. We expect that additional code-conformance problems need to be eliminated with additional measures. Such measures could include the institution of professional design engineering, and mandatory malpractice insurance both for the designer and the constructor.
Hospitals and infrastructure
Reportedly, some hospitals in the region, including Iskenderun State Hospital, a private hospital in Hatay, two private hospitals in Malatya, and another private hospital in Adıyaman, are non-functional or only partly functional due to earthquake damage. However, 9 seismically isolated (base-isolated) hospitals in the region are functional, including the world’s second-largest base-isolated 2000-bed Adana City Hospital.
The damage to major infrastructure in the earthquake-affected region is reportedly very limited. This indicates much better design and construction practices associated with infrastructure as compared to buildings.
Out of about 150 dams, only one of them, the 60-meter-high Sultansuyu embankment dam in Malatya Province, had some cracks that led to the controlled release of water through the spillway (İMO, 2023). Another dam in Syria, the 75-meter-high Afrin embankment dam, reportedly experienced similar damage.
The hydrocarbon pipelines, roads, and railways were damaged at the fault rupture crossings, landslides and liquefaction. These damages reportedly have been remedied and their functionality is mostly resumed as of Feb. 15.
Of about 1,000 bridges in the earthquake-affected region, 15 bridges had problems that could be remedied quickly, such as offsets at expansion joints and deck bearings. They were opened to normal traffic within two days. However, two bridges collapsed—one due to rockfalls and the other due to foundation liquefaction (per private communication with State Highway Department).
The port of Iskenderun sustained damage in the wharf area and experienced a significant fire the next day, making it unusable as an entry port for emergency supplies. As of Feb. 10, the fire was suppressed and the port was partially opened to service (İMO, 2023).
Hatay airport experienced some damage to its runway due to soil and foundation problems and was closed to air traffic in the first three days after the earthquakes. As of Feb. 15, all airports in the region (Kahramanmaraş Gaziantep, Şanlıurfa, Hatay, and Adana) are operational (İMO, 2023).
Two of the three major thermal power plants in the earthquake-affected region (1440 MW and 1360 MW Afşin-Elbistan A and B Power Plants) were damaged and their operations were suspended pending repairs. Afşin-Elbistan B is expected to resume service by Feb. 27, 2023.
Liquefaction
Soil liquefaction occurs when a saturated or partially saturated soil lacking cohesion substantially loses strength and stiffness in response to earthquake ground motion. In other words, soil behaves like a liquid. As such, liquefaction that occurs beneath buildings and other structures can cause major damage leading to severely tilted buildings, ground subsidence and lateral flow of soil during strong earthquakes. In the magnitude-7.8 earthquake, extensive liquefaction was observed at the shores of lakes in Gölbaşı (Adıyaman), in the İskenderun Port wharf area, and in Antakya near the Asi River. Effects of liquefaction are shown in Figure 17, depicting a tilted building and disfigured railroad track in in Gölbaşı, and the collapsed decks of the Karasu Bridge in Antakya.

Earthquake insurance
Insurable losses are hard to estimate as the situation is evolving, but they appear likely to exceed USD 2 billion and could reach USD 4 billion or more. However, insured losses could be much lower, perhaps around USD 1 billion, due to low insurance coverage in the affected regions. As of Feb. 14, Verisk (AIR) pegs Turkey quake economic loss at more than USD 20 billion.
The damage to about 55% of the buildings in the region is covered under the compulsory earthquake insurance system in Türkiye. Since 2000, earthquake insurance has been compulsory for private dwellings within municipal boundaries and is covered by the Turkish Catastrophe Insurance Pool (TCIP, DASK in Turkish). The pool covers sums up to a prescribed level, but insurance above this level is optional and is covered by private insurers. TCIP, together with its retention and reinsurance, has a claims-paying capacity approaching USD 5 billion.
Feasibility of earthquake early warning
Türkiye does not currently have a public earthquake early warning system in place. However, should such a system come into existence, it could save lives by giving some people time to take protective action before strong shaking begins.
In general, an on-site earthquake early warning signal is based on the analysis of a 3-second window following the first P-wave arrival at multiple seismic stations. The travel time of the P-waves to a station located about 30 kilometers from the epicenter is about 5 seconds, assuming a P-wave velocity of 6 kilometers per second. Earthquake early warning systems then calculate and send the alert to an alerting distribution system. This calculation and transfer of the alert can happen within milliseconds. The alerting distribution system then sends the alert to those who need it, typically via smartphones or apps over wireless or cellular networks. The issuance and receipt of the alert can occur within an additional number of seconds. Those who experience the strongest shaking are the least likely to receive a warning. Nevertheless, such a system could help people further from the epicenter, providing precious seconds to take protective action .
To determine whether to issue earthquake early warning alerts, such systems rapidly calculate parameters like τc, an estimate of earthquake magnitude, and Pd, a measure of how damaging incoming seismic waves are. The KOERI strong motion station in Kahramanmaraş is located about 30 kilometers from the epicenter of the magnitude-7.8 event. In the following figure (Figure 18), the initial portion of the seismogram is analyzed and 1.634 seconds and 2.894 centimeters are determined for the τc and Pd parameters, respectively. From this information, the estimated τc parameter yields a magnitude of 7.1 (± 0.4). The peak ground velocity determined from the estimated Pd is 106 centimeters per second. The estimations are based on the relations derived by Wu et al. (2007). Though the initial magnitude is underestimated, both the estimated magnitude and peak ground velocity are sufficient to have triggered an earthquake early warning alert, should such a system have been available.

Past events help future planning
The instrumental and historical earthquake activity of moderately-sized events in the region (Figure 2) is mainly summarized by Altunel et al. (2009) and Yönlü et al. (2017), and we briefly describe it here. Seismicity along the East Anatolian Fault Zone is characterized by moderate to large earthquakes (greater than or equal to magnitude-7) with focal mechanism solutions that show essentially pure left-lateral strike-slip motion. Some moderate-sized, recent earthquakes (e.g., 1905 magnitude-6.8 Malatya earthquake; 1971 magnitude-6.7 Bingöl earthquake; 1986 magnitude-6.0 Sürgü earthquake; 2003 magnitude-6.4 Bingöl earthquake; 2010 magnitude-6.0 Karakoçan–Elazığ earthquake; 2020 magnitude-6.8 Elazığ earthquake) have occurred on the East Anatolian Fault Zone (Tan et al., 2008), but for these events, no surface rupture was reported.
Several surface rupturing events reportedly took place on the East Anatolian Fault Zone in the 19th century (e.g., a magnitude-6.8 event in 1866, an event greater than magnitude 7.1 in 1874, a magnitude-6.7 event in 1874, and a magnitude-7.1 event in 1893). Ambraseys (1989) suggests that two-thirds of the fault zone was ruptured during these events. Earthquakes in 1114 and 1513 likely occurred in the southwestern part of the fault zone and caused great damage in northern Syria and eastern Anatolia (Calvi, 1941; Soysal et al., 1981; Ambraseys, 1989; 2004). Ambraseys (2009) reported that the 1114 earthquake, likely greater than magnitude 7.0, and its foreshocks were clearly associated with the East Anatolian Fault Zone. The shock likely occurred southwest of the magnitude-7.1 event 1893 (Ambraseys, 1989). According to Ambraseys (2009), the 1114 earthquake caused damage to Alexandretta (Iskenderun), but it could have been originated offshore; the most damaged area was around Maras (Kahramanmaras) and extended to Antioch (Hatay), Aleppo and Edessa (Şanlıurfa).
During the instrumental period in which seismic data can better constrain earthquake source details, the magnitude-6.2 Ceyhan earthquake that struck on June 27, 1998 is the largest event to affect the Adana Basin (Aktar et al., 2000; Ergin et al., 2004). The earthquake ruptured the Misis-Ceyhan Fault, and both the epicenter and source mechanism of the mainshock are well constrained by Aktar et al. (2000), providing clear evidence of left-lateral strike-slip motion. Similarly, the Jan. 3, 1994 Kurtkulağı event of magnitude 5.0, located near the Yumurtalık Fault, also shows strike-slip faulting (Aktar et al., 1994; Ergin et al., 2004).
The Dead Sea Fault Zone has also experienced several major events. In 1408, a magnitude-7.5 earthquake took place at the northern end of the Dead Sea Fault Zone and was associated with surface rupture about 20 kilometers in length (Ambraseys & Melville 1995; Sbeinati et al. 2005; Akyüz et al. 2006). On Aug. 13, 1822, a magnitude-7.4 event occurred in the Karasu Valley (Ambraseys 1989). Ambraseys (1989) reports that a magnitude-7.2 earthquake occurred in the Amik Basin on April 3, 1872, and generated heavy damage around the former Amik Lake. A destructive earthquake also took place in 1269 in the Adana Basin (Arvanitakis, 1903; Calvi, 1941; Guidoboni and Comastri, 2005); however, there is insufficient information in the literature to attribute this event to a specific fault segment. Paleoseismic studies in southwest of Türkoğlu, (Yönlü et al., 2017) reveal that there was a large earthquake after 425–570 AD that could be attributed to the 1269 historical event (Figure 2b).
This discussion of past earthquakes highlights that along all the faults in this region, catastrophe has struck throughout history. We know that earthquakes will continue in the future, though we do not know when or how big they will be. We must learn from the past to prepare for the future.
Science editor: Dr. Alka Tripathy-Lang, Ph.D.
Reviewer: Dr. Ross S. Stein, Ph.D.
References
Aktar, M., Ergin, M., Özalaybey, S., Tapirdamaz, C., 2000. A lower-crustal event in the northeastern Mediterranean: the 1998 Adana Earthquake (Mw:6.2) and its aftershocks. Geophys. Res. Lett.27, 2361–2364.
Aktar, M.T., Yörük, A., Kaplan, H., 1994. Kurtkulağı events in the Cilician Basin and its aftershocks. In: XXIV General Assembly of the European Seismological Commission, Proceedings and Activity Report, Athens, vol. 1, pp.74–80.
Akyüz, S.H., Altunel, E., Karabacak, V., Yalçıner, C.C., 2006. Historical earthquake activity of the northern part of the Dead Sea Fault Zone, southern Turkey. Tectono-physics426, 281–293.
Allen, C.R., 1969. Active Faulting in Northern Turkey. Contr. 1577. Div. Geol. Sciences, Calif. Inst. Tech., p.32.
Altunel, E., Meghraoui, M., Karabacak, V., Akyüz, S., Ferry, M., Yalçıner, Ç., Munschy, M., 2009. Archaeological sites (Tell and Road) offset by the Dead Sea Fault in the Amik Basin, Southern Turkey. Geophys. J. Int.179, 1313–1329. http://dx.doi.org/10.1111/j.1365-246X.2009.04388.x.
Ambraseys, N.N., 1989. Temporary seismic, quiescence: SE Turkey. Geophys. J.96, 311–331.
Ambraseys, N.N. and Melville, C.P., 1995. Historical evidence of faulting in eastern Anatolia and northern Syria, Ann. Geophys. 38(3–4), 337–343.
Ambraseys, N.N., 2004. The 12th century seismic paroxysm in the Middle East: a historical perspective. Annals of Geophysics, Vol. 47, N. 2, 1-26.Arpat, E., ¸Saroğlu, F., 1975. Türkiye’deki bazı önemli genç tektonik olaylar. TJK Bül.18, 91–101.
Ambraseys N.N., 2009. “Earthquakes in the Eastern Mediterranean and the Middle East: a multidisciplinary study of 2000 years of seismicity”, Cambridge, Cambridge, UK, p 968 (ISBN: 9780521872928).
Arpat, E., ¸Saroğlu, F., 1975. Türkiye’deki bazı önemli genç tektonik olaylar. TJK Bül.18, 91–101.Arvanitakis, G.L., 1903. Essai d’une statistique des templements de terre en Palestineet Syrie. Bull. Inst. Egypte4 (4), 178–183.
Baker J.W., 2007. Quantitative classification of near-fault ground motions using wavelet analysis. Bulletin of the Seismological Society of America. 97 (5), 1486-1501.
Barka, A., Kadinsky-Cade, K., 1988. Strike-slip fault geometry in Turkey and its influence on earthquake activity. Tectonics7 (3), 663–684.
Barka, A., Reilinger, R., 1997. Active tectonics of the Mediterranean region: deduced from GPS, neotectonic and seismicity data. Ann. Geofis.XI (3), 587–609.
Calvi, S., 1941. Türkiye ve bazı kom¸su ülkelerin deprem katalo˘gu, Çeviren: Erdo˘gan Kumcu, 1979. ˙Istanbul.
Chorowicz, J., Luxey, P., Lyberis, N., Carvalho, J., Pairot, J.F., Yürür, T., Gündo˘gdu, N., 1994. The Mara¸s Triple junction (Southern Turkey) based on digital elevation model and satellite imagery interpretation. J. Geophys. Res.99 (B10), 20225–20242.
Dewey, J.F., Pitman, W.C. III, Ryan, W.B.F., Bonnin, J., 1973. Plate tectonics and the evolution of the Alpine System. Geol. Soc. Am. Bull.84, 3137–3180.
Djamour, Y., Vernant, P., Nankali, H.R. and Tavakoli, F., 2011. NW Iraneastern Turkey present-day kinematics: results from the Iranian permanent GPS network, Earth planet. Sci. Lett., 307(1–2), 27–34.
Duman, T.Y., Emre, Ö., 2013. The East Anatolian Fault: geometry, segmentation and jog characteristics. Geol. Soc. (Lond.) Spec. Publ.372.
Durukal, E,, O. Özel, M. Bikce, M.C. Geneş, S. Kaçın, M. Erdik, E. Safak and S. Över, 2009. Establishment of Antakya Basin Strong Ground Motion Monitoring System, Geophysical Research Abstracts, Vol. 11, EGU2009-4326-1, EGU General Assembly 2009.
Erdik, M., Şadan, B., Tüzün, C., Demircioglu-Tumsa, M.B., Ülker, Ö., Harmandar, E., 2023. Near-Fault Earthquake Ground Motion and Seismic Isolation Design. In: Cimellaro, G.P. (eds) Seismic Isolation, Energy Dissipation and Active Vibration Control of Structures. WCSI 2022. Lecture Notes in Civil Engineering, vol 309. Springer, Cham. https://doi.org/10.1007/978-3-031-21187-4_9
Ergin, M., Aktar, M., Eyido˘gan, H., 2004. Present-day seismicity and seismotectonic of the Cilician Basin: Eastern Mediterranean Region of Turkey. Bull. Seismol. Soc. Am.94, 930–939. http://dx.doi.org/10.1785/0120020153.
Guidoboni, E., Comastri, A., 2005. Catalogue of Earthquakes and Tsunamis in the Mediterranean Area from the 11th to the 15th Century. Istituto Nazionale di Geofisica e Vulcanologia.
HAZUS 4.3 SP3, 2020. https://www.fema.gov/sites/default/files/2020-10/fema_hazus_earthquake_technical_manual_4-2.pdf
Hancılar, U., C.Tüzün, C.Yenidoğan, M.Erdik, 2010. ELER Software-A new tool for urban loss assessment, Natural Hazards and Earth System Sciences, December 2010
Hempton, M.R., 1987. Constraints on Arabian plate motion and extensional history of the Red Sea. Tectonics6, 687–705.
Hessami, K., Nilforoushan, F. And Talbot, C.J., 2006. Active deformation within the Zagros Mountains deduced from GPS measurements, J. Geol. Soc., 163(1), 143–148.
İMO-İnşaat Mühendisleri Odası, 2023. Kahramanmaraş Pazarcik Ve Elbistan Depremleri ön Değerlendirme Raporu, 14 Şubat 2023
Jackson, J., McKenzie, D., 1984. Active tectonics of the Alpine–Himalayan belt between western Turkey and Pakistan. Geophys. J. R. Astron. Soc.77, 185–264.
Jörg, W., 1986. Türkei: Die Südküste von Kaunos bis Issos. München Artemis-Verlag, Zürih. ISBN3-7608-0791-7.
Kelling, G., Gökçen, S.L., Floyd, P.A., Gökçen, N., 1987. Neogene tectonics and plate convergence in the Eastern Mediterranean: new data from southern Turkey. Geology15, 425–429.
Kempler, D., Garfunkel, Z., 1991. Northeast Mediterranean triple junction from a plate kinematics point of view. Bull. Tech. Univ. Istanb.44, 425–454. Spec. Issue.
Kikuchi, M., and Kanamori, H., 1991. Inversion of complex body waves-III, Bull. Seism. Soc.Am., 81, 2335-2350.
Koçyiğit, A., Erol, O., 2001. A tectonic escape structure: Erciyes pull-apart basin, Kay-seri, central Anatolia, Turkey. Geodin. Acta, 14, 133–145.
Lovelock, P.E.R., 1984. A review of the tectonics of the northern Middle East region. Geol. Mag.121 (6), 577–587.
Lyberis, N., Tekin, Y., Chorowicz, J., Kasapoğlu, E., Gündoğdu, N., 1992. The East Anatolian Fault: an oblique collisional belt. Tectonophysics 204, 1–15.
Masson, F., Anvari, M., Djamour, Y., Walpersdorf, A., Tavakoli, F., Daignieres, M., Nankali, H. & Van Gorp, S., 2007. Large-scale velocity field and strain tensor in Iran inferred from GPS measurements: new insight for the present-day deformation pattern within NE Iran, Geophys. J. Int., 170(1), 436–440.
McClusky, S.C., Balassanian, S., Barka, A., Ergintav, S., Georgie, I., Gurkan, O.,Hamburger, M., Hurst, K., Kahle, H., Kastens, K., Kekelidse, G., King, R., Kotzev, V., Lenk, .,Mahmout, S., Mishin, A., Nadaria, M., Ouzounis, A., Paradisissis, D., Peter, Y., Pirilepin, M., Reilinger, R.E., Sanli, I., Seeger, H., Teableb, A., Toksöz, N., Veis, V., 2000. Global Positioning System constraints on plate kinematics and dynamics in the eastern Mediterranean Caucasus. Journal of Geophysical Research 105, 5695–5719.
McKenzie, D.P., 1970. Plate tectonics of the Mediterranean region. Nature, 220, 239–343.
McKenzie, D.P., 1972. Active tectonics of Mediterranean region. Geophys. J. R. Astron. Soc.30, 109–185.
McKenzie, D.P., 1976. The East Anatolian fault: a major structure in eastern Turkey. Earth Planet. Sci. Lett.29, 189–193.
Mousavi, Z.,Walpersdorf, A.,Walker,R.T., Tavakoli, F., Pathier, E., Nankali, H., Nilfouroushan, F. & Djamour, Y., 2013. Global Positioning System constraints on the active tectonics of NE Iran and the South Caspian region, Earth Planet. Sci. Lett., 377–378, 287–298.
Muehlberger, R.W., Gordon, M.B., 1987. Observations on the complexity of the East Anatolian Fault, Turkey. J. Struct. Geol.9, 899–903.
Över, S., Özden, S., Yılmaz, H., 2004. Late Cenozoic stress evolution along the Karasu Valley, SE Turkey. Tectonophysics, 380, 43–68.
Palano, M., 2015. On the present-day crustal stress, strain-rate fields and mantle anisotropy pattern of Italy, Geophys. J. Int., 200(2), 969–985.
Palano, M., Imprescia, P., Agnon, A., and Gresta, S., 2017. An improved evaluation of the seismic/geodetic deformation-rate ratio for the Zagros Fold-and-Thrust collisional belt, Geophys. J. Int. (2018) 213, 194–209, doi: 10.1093/gji/ggx524
Perinçek, D., Çemen, ˙I., 1990. The structural relationship between the East Anatolian and Dead Sea fault zones in southeastern Turkey. Tectonophysics172, 331–340.
Peyret, M. et al., 2009. Present-day strain distribution across the Minab-Zendan-Palami fault system from dense GPS transects, Geophys. J. Int., 179(2), 751–762.
Reilinger, R., McClusky, S., Vernant, P., Lawrence, S., Ergintav, S., Cakmak, R., Ozener, H., Kadirov, F., Guliev, I., Stepanyan, R., Nadariya, M., Hahubia, G., Mahmoud, S., Sakr, K., ArRajehi, A., Paradissis, D., Al-Aydrus, A., Prilepin, M., Guseva, T., Evren, E., Dmitrotsa, A., Filikov, S.V., Gomez, F., Al-Ghazzi, R., Karam, G., 2006. GPS constraints on continental deformation in the Africa–Arabia–Eurasia conti-nental collision zone and implications for the dynamics of plate interactions. J. Geophys. Res., Solid Earth111 (B5), B05411. 52 p.
Şaroğlu, F., Emre, Ö., Kuşçu, I., 1992. The East Anatolian fault zone of Turkey. Ann. Tecton.6, 99–125.
Sbeinati, M.R., Darawcheh, R. and Mouty, M., 2005. The historical earthquakes of Syria; an analysis of large and moderate earthquakes from 1365 B.C. to 1900 A.D., Ann. Geophys., 48(3), 347–435.
Şeşetyan K., Stucchi M., Castelli V., Gomez Capera A.A., 2023, “ Kahramanmaraş – Gaziantep Türkiye M7.7 Earthquake, 6 February 2023 (04:17 GMT+03:00) – Large historical earthquakes of the earthquake-affected region: a preliminary report”, B.U. KOERI report
Shen, Z.-K.,Wang, M., Zeng, Y., and Wang, F., 2015. Optimal interpolation of spatially discretized geodetic data, Bull. seism. Soc. Am., 105(4), 2117–2127.
Şengör, A.M.C., 1980. Türkiye’nin neotektoni˘ginin esasları, Türkiye Jeoloji Kurumu. Konf Ser., 40(2).
Şengör, A.M.C., Görür, N., ¸Saroğlu, F., 1985. Strike-slip faulting and related basin formation in zone of tectonic escape: Turkey as a case study. In: Biddle, K.T., Christie-Blick, N. (Eds.), Strike-Slip Deformation, Basin Deformation and Sedi-mentation. In: Spec. Publ., Soc. Econ. Paleontol. Mineral., vol.37, pp.227–264.
Sieberg, A., 1932. Erdbebengeographie. In: Gutenberg, B. (Ed.), Handbuch der Geo-physik, vol. 4, pp.775–812. Berlin.
Somerville P, Robert Graves (1993). Conditions that give rise to unusually large long period ground motions The Structural Design of Tall Buildings Volume 2, Issue 3 p. 211-232.
Soysal, H., Sipahioğlu, S., Kolçak, D., Altınok, Y., 1981. Türkiye ve Çevresinin Deprem Katalogu, MÖ 2100-MS 1900 (Earthquake Catalogue of Turkey and Surroundings, BC 2100-AD 1900). TÜB˙ITAK Project (No. TBAG 341), 99 s.
Tan, O., Tapırdamaz, M.C., Yörük, A., 2008. The Earthquake Catalogues for Turkey. Turk. J. Earth Sci.17, 405–418.
Tavakoli, F. et al., 2008. Distribution of the right-lateral strike-slip motion from the Main Recent Fault to the Kazerun Fault System (Zagros, Iran):evidence from present-day GPS velocities, Earth planet. Sci. Lett., 275(3–4), 342–347.
Taymaz, T., Westaway, R., Reilinger, R. (Eds.), 2004. Active Faulting and Crustal De-formation in the Eastern Mediterranean Region. Tectonophysics 391, 1–374.
TDV-DASK, 2015. “Güncellenmiş Türkiye Deprem Tehlikesi, Haritasina Göre Dask Deprem Sigortasi Primlerinin Güncellenmesi”.
TDV-DASK, 2018. “Güncellenmiş Türkiye Deprem Tehlikesi, Haritasina Göre Dask Deprem Sigortasi Primlerinin Güncellenmesi”.
WB, 2011. “Consultancy Services for Prioritization of High Seismic Risk Provinces and Public Buildings PO7156140 Prioritization of Provinces with Respect to Vulnerability by PROTA ENGINEERING, April 2011”
Westaway, R., Arger, J., 1996. The Gölba¸sı basin, southeastern Turkey: a complex discontinuity in a major strike-slip fault zone. J. Geol. Soc.153, 729–743.
Wu, Y. M., Kanamori, H., Allen R. M., and Hauksson, E., 2007. Determination of earthquake early warning parameters, τc and Pd, for southern California, Geophys. J. Int. (2007) 170, 711–717, doi: 10.1111/j.1365-246X.2007.03430.x
Yönlü, Ö., Altunel, E. and Karabacak, V., 2017. Geological and geomorphological evidence for the southwestern extension of the East Anatolian Fault Zone, Turkey. Earth and Planetary Science Letters, 469, 1-14.
Yürür, M.T., Chorowicz, J., 1998. Recent volcanism, tectonics and plate kinematics near the junction of the African, Arabian and Anatolian plates in the Eastern Mediterranean. J. Volcanol. Geotherm. Res.85, 1–15.
Zarifi, Z., Nilfouroushan, F. & Raeesi, M., 2014. Crustal Stress Map of Iran:insight from seismic and geodetic computations, Pure Appl. Geophys., 171(7), 1219–1236.
Walpersdorf, A., et al., 2006. Difference in the GPS deformation pattern of North and Central Zagros (Iran), Geophys. J. Int., 167(3), 1077–1088.
Walpersdorf, A. et al., 2014. Present-day kinematics and fault slip rates in Eastern Iran, derived from 11 years of GPS data, J. Geophys. Res., 119(2), 1359–1383
- Venezuela’s doublet leaned toward Caracas - June 30, 2026
- Is Southern California’s Cajon Pass an ‘earthquake gate’ ready to open? - June 29, 2026
- Philippines magnitude 7.8 shock may have loaded the central Cotabato subduction zone - June 11, 2026