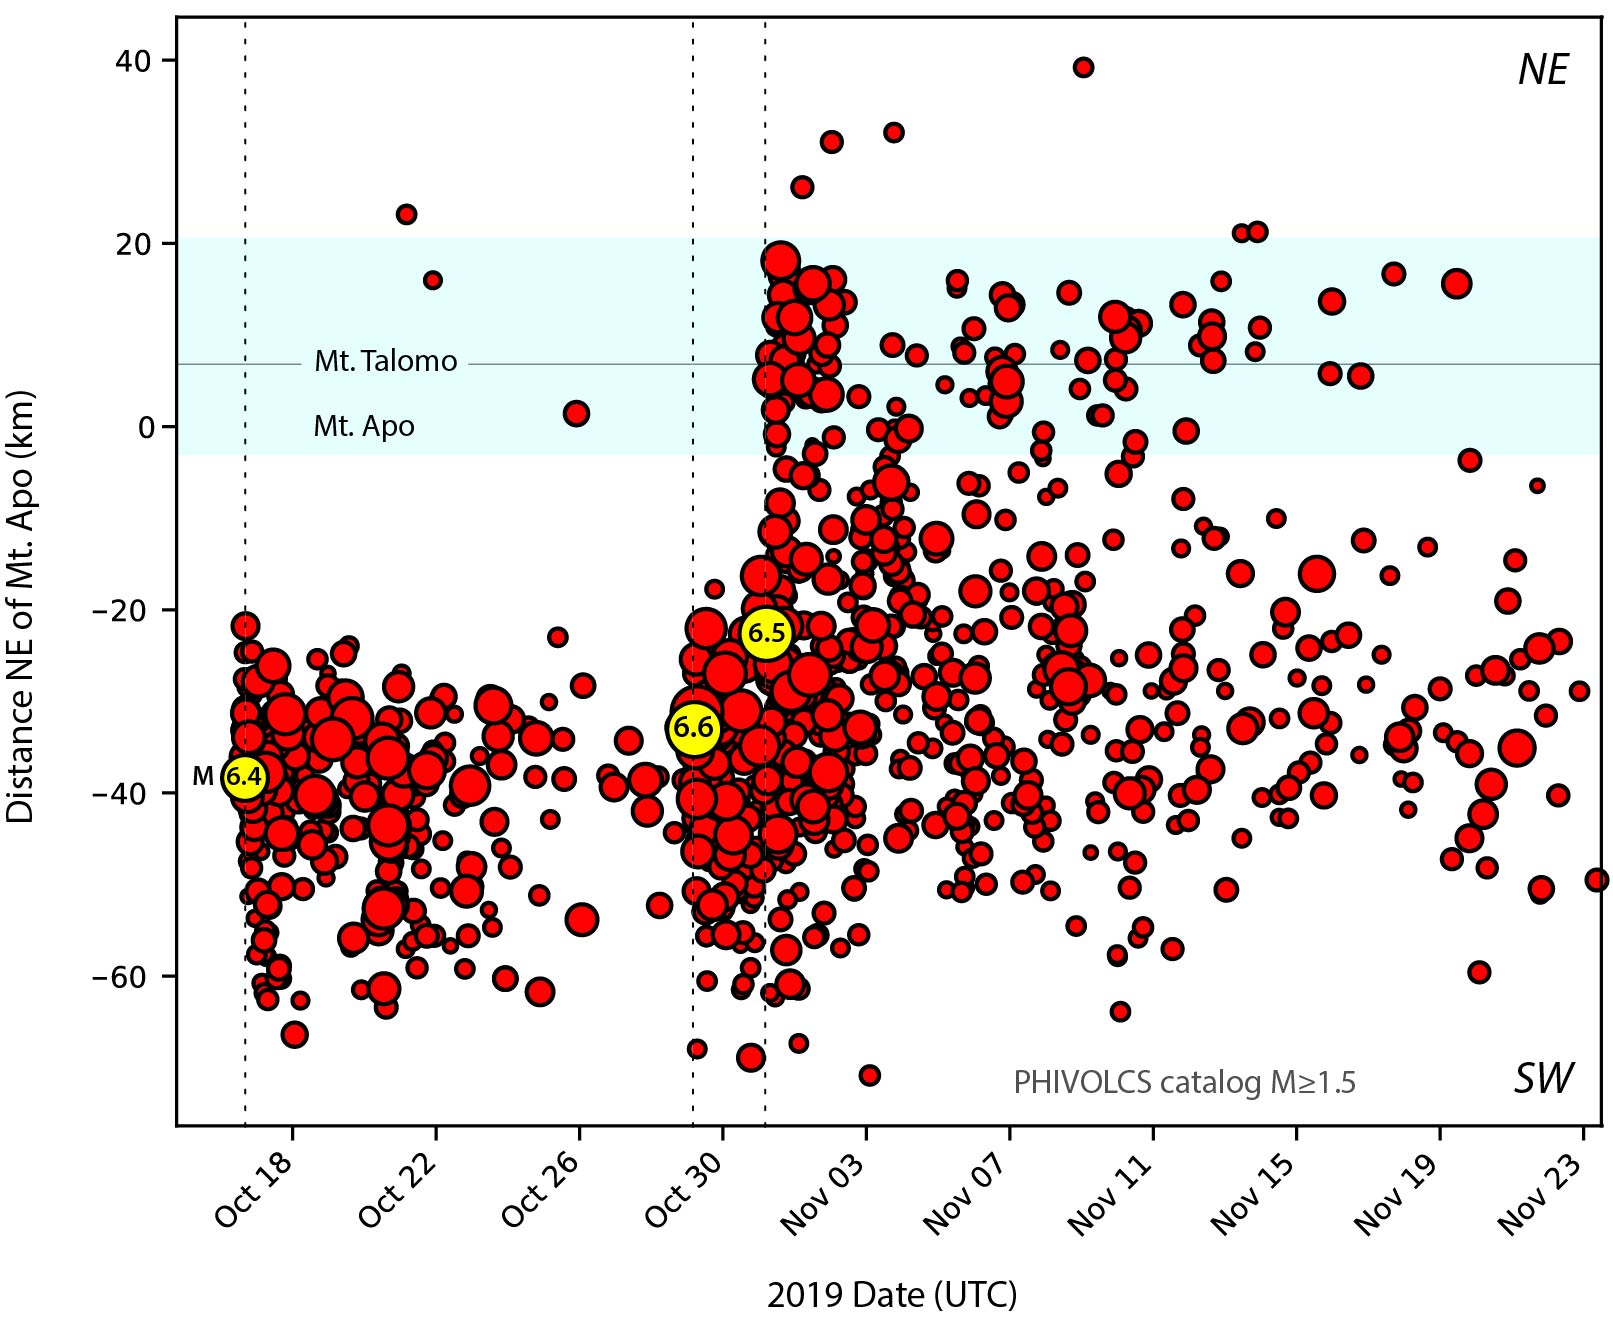
In this 30-day time series, the x-axis shows time, starting with the first large earthquake (magnitude-6.4) on Oct. 16. The y-axis shows distance from Mount Apo, with both volcanoes labeled. The light blue band shows the region around Mount Apo and Mount Talomo. The initiation of seismicity below these volcanoes after the magnitude-6.5 earthquake is evident. Credit: Geoffrey Ely, Temblor
Alka Tripathy-Lang is a freelance science writer based in Chandler, Arizona, and holds a Ph.D. in geoscience.
Latest posts by Alka Tripathy-Lang, Ph.D. (see all)
- Living through the Loma Prieta earthquake - October 21, 2021
- The Great Quake Debate: an interview with seismologist and author Susan Hough - August 27, 2020
- Salton Sea Swarm quiets down - August 12, 2020