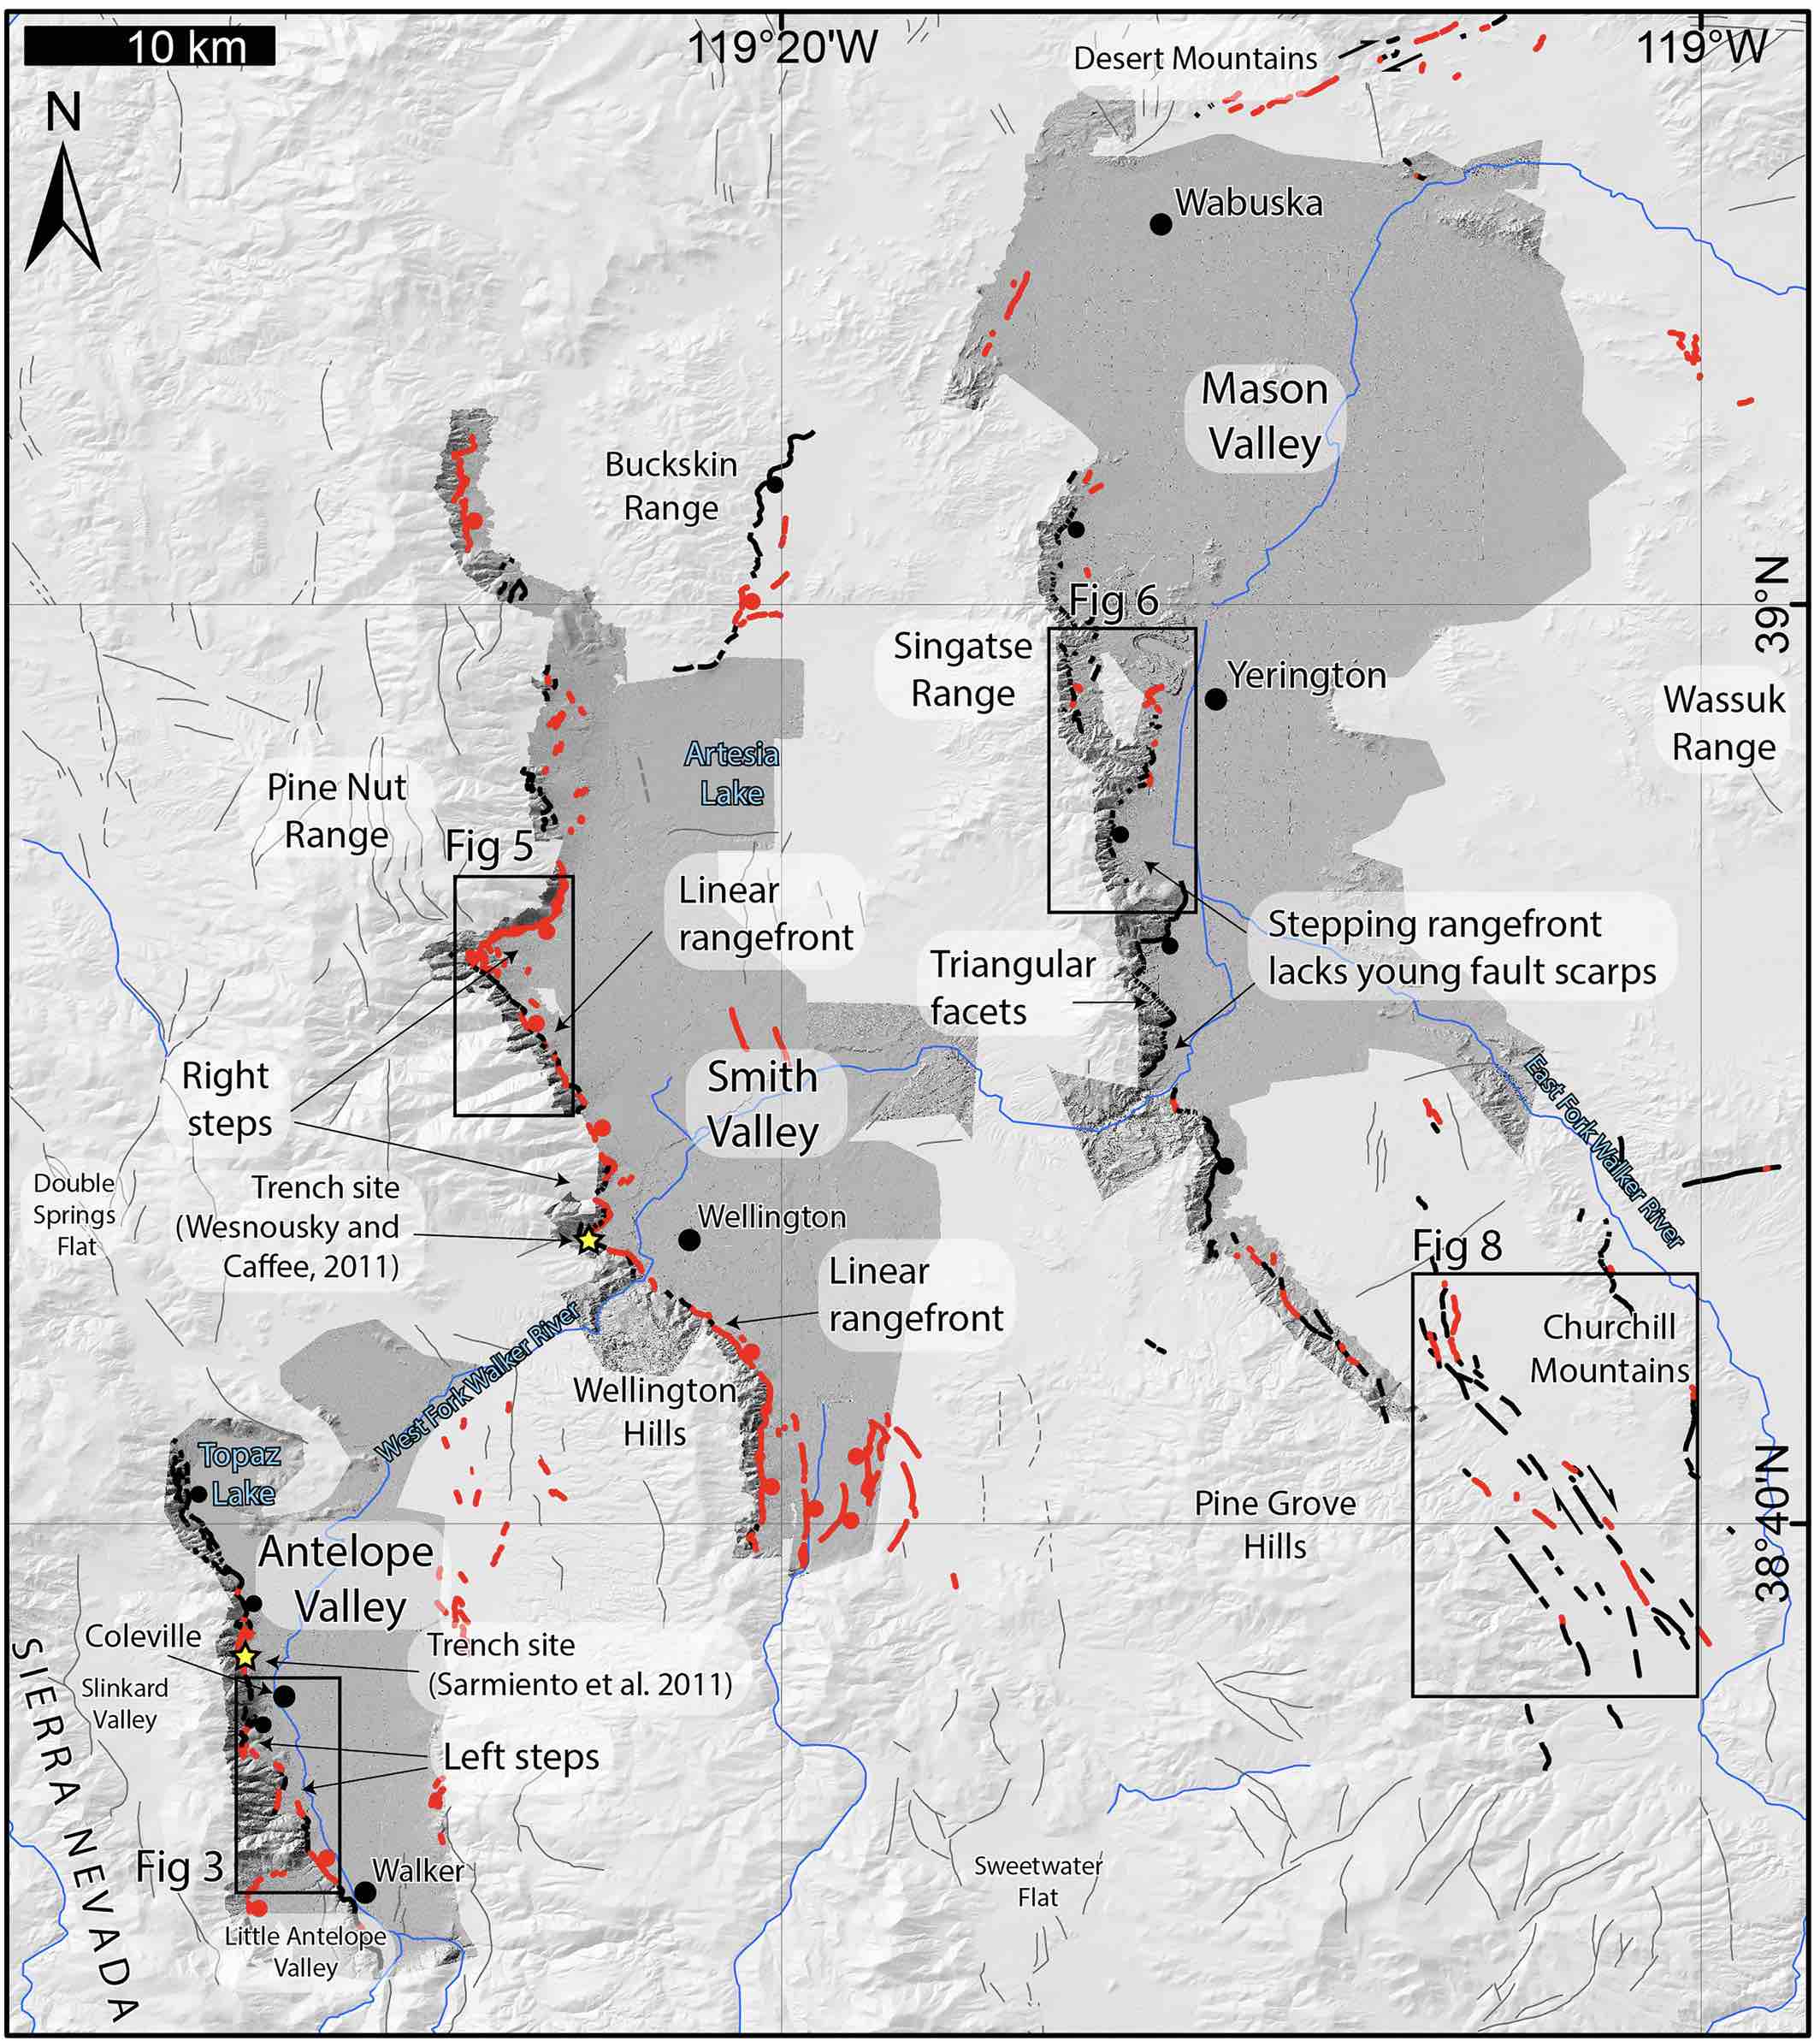
Overview of study area of Pierce et al., 2020, that includes Antelope Valley. Dark gray hillshades indicate lidar data. Red lines show mapped faults. Bold black lines show fault contacts between bedrock and alluvial sediments. Thin black lines come from the USGS Quaternary fault and fold database. Credit: Pierce et al., 2020, CC BY 4.0
Alka Tripathy-Lang is a freelance science writer based in Chandler, Arizona, and holds a Ph.D. in geoscience.
Latest posts by Alka Tripathy-Lang, Ph.D. (see all)
- Living through the Loma Prieta earthquake - October 21, 2021
- The Great Quake Debate: an interview with seismologist and author Susan Hough - August 27, 2020
- Salton Sea Swarm quiets down - August 12, 2020