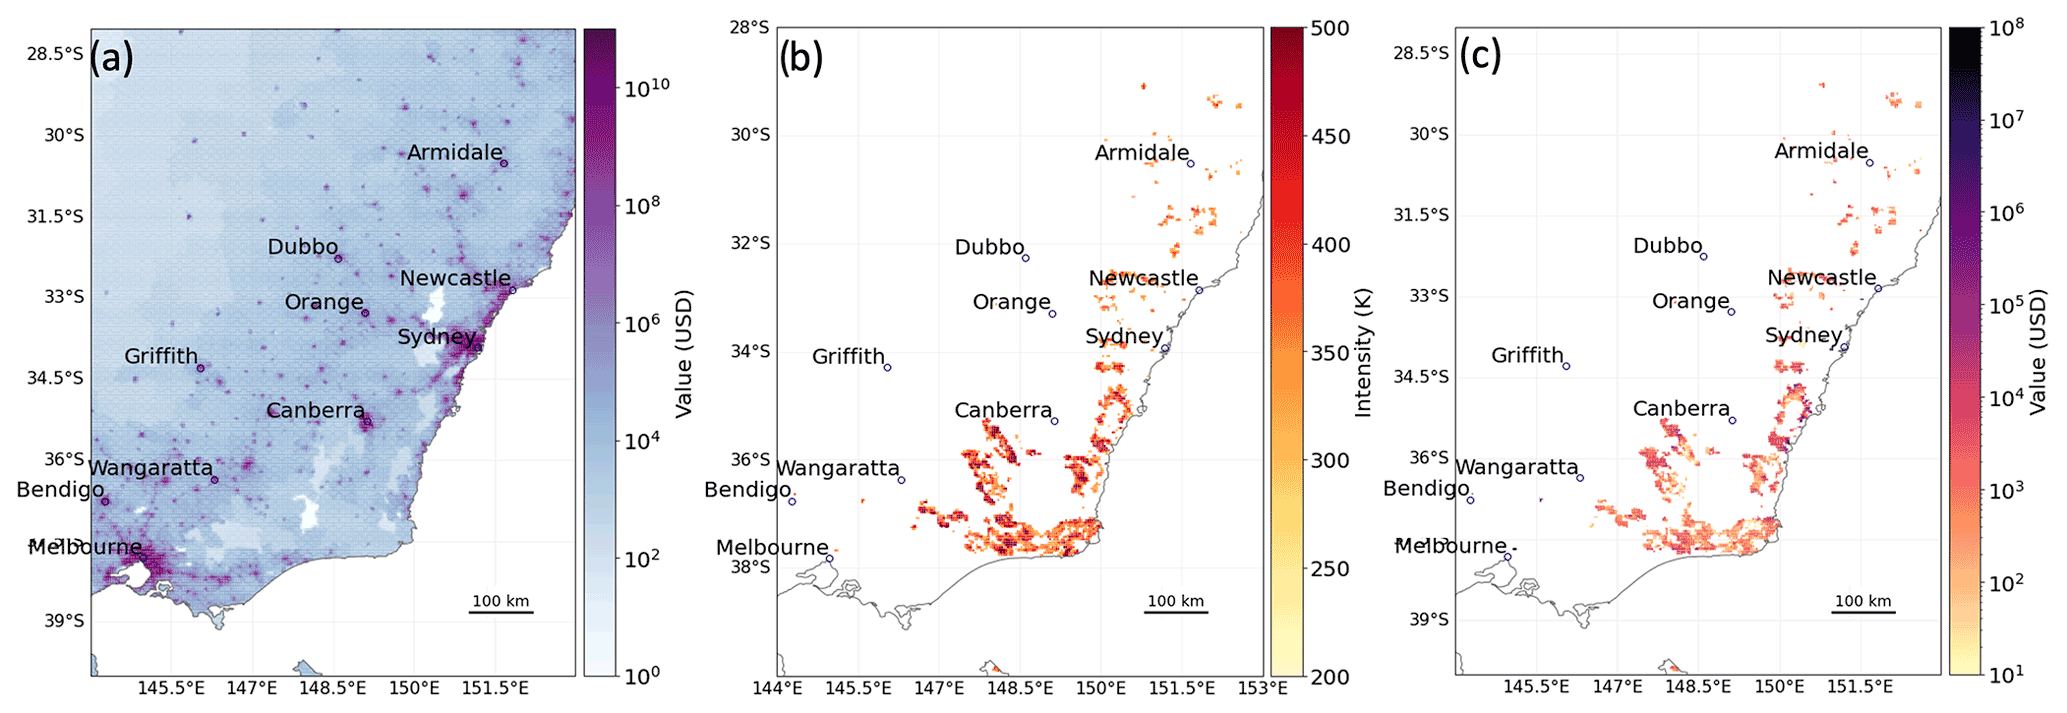
Maps of southeastern Australia showing (a) the spatial distribution of asset exposure value, (b) wildfires active between 29 December 2019 and 6 January 2020, and (c) the resulting damage estimated by CLIMADA. Credit: Lüthi et al., 2021
Alka Tripathy-Lang is a freelance science writer based in Chandler, Arizona, and holds a Ph.D. in geoscience.
Latest posts by Alka Tripathy-Lang, Ph.D. (see all)
- Living through the Loma Prieta earthquake - October 21, 2021
- The Great Quake Debate: an interview with seismologist and author Susan Hough - August 27, 2020
- Salton Sea Swarm quiets down - August 12, 2020