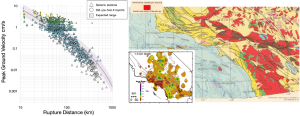
Figure 3. Recorded and reported peak ground velocities produced by the Julian earthquake appear higher than expected, likely as a result of local geology. Left: USGS peak ground velocity comparison between observations and predictions based on empirical ground motion models for the magnitude 5.2 Julian earthquake. Warm and cool colors represent high and low velocities, respectively. Right: Geological map illustrating the granitic bedrock (red) between Julian, San Diego, and Los Angeles, from USGS and California Division of Mines and Geology, 1966, Geologic map of California: U.S. Geological Survey, Miscellaneous Geologic Investigations Map I-512, scale 1:2,500,000. Inset: Seismic wave attenuation model (QS) showing less damping of seismic energy (cooler colors) in the same region of the southern California crust (Hauksson & Shearer, 2006). Credit: Kilb et al., 2025, CC BY-ND-NC 4.0
Figure 3. Recorded and reported peak ground velocities produced by the Julian earthquake appear higher than expected, likely as a result of local geology. Left: USGS peak ground velocity comparison between observations and predictions based on empirical ground motion models for the magnitude 5.2 Julian earthquake. Warm and cool colors represent high and low velocities, respectively. Right: Geological map illustrating the granitic bedrock (red) between Julian, San Diego, and Los Angeles, from USGS and California Division of Mines and Geology, 1966, Geologic map of California: U.S. Geological Survey, Miscellaneous Geologic Investigations Map I-512, scale 1:2,500,000. Inset: Seismic wave attenuation model (QS) showing less damping of seismic energy (cooler colors) in the same region of the southern California crust (Hauksson & Shearer, 2006). Credit: Kilb et al., 2025, CC BY-ND-NC 4.0
Latest posts by Rachel Crowell (see all)

