By: Ross S. Stein, Ph.D. (Temblor, Inc., CEO)
Shinji Toda, Ph.D. (International Research Institute for Disaster Science, Tohoku University)
Volkan Sevilgen, M.Sc. (Temblor, Inc., CTO)
The magnitude-6.5 quake provides yet another indication of the shortcomings of fault-driven hazard models, and the strength of models that use strain instead, particularly for global consistency. To assess what could happen next, we calculate how the rupture transferred stress to nearby faults; the newly stressed faults should now be monitored.
Citation: Stein, R. S., Toda, S., Sevilgen, V., 2020, Implications of the Tonopah magnitude-6.5 earthquake for worldwide seismic hazard assessment, Temblor, http://doi.org/10.32858/temblor.091

A magnitude-6.5 quake struck approximately 35 miles (56 kilometers) west of Tonopah, Nevada early in the morning on May 15th, 2020. The quake was felt throughout the western United States and as far as the San Francisco Bay Area. No major damage occurred but reports emerged showing surface cracking along roadways and other landforms. Scientists are now working out the details about which fault ruptured during the event.
With the closest seismic station 20 miles (35 kilometers) away, the shaking intensity was not well recorded. At that distance the peak was about 10% the force of gravity, well below that typically associated with damage. Near the epicenter, the shaking was likely much higher.
It packed a wallop but left barely a trace
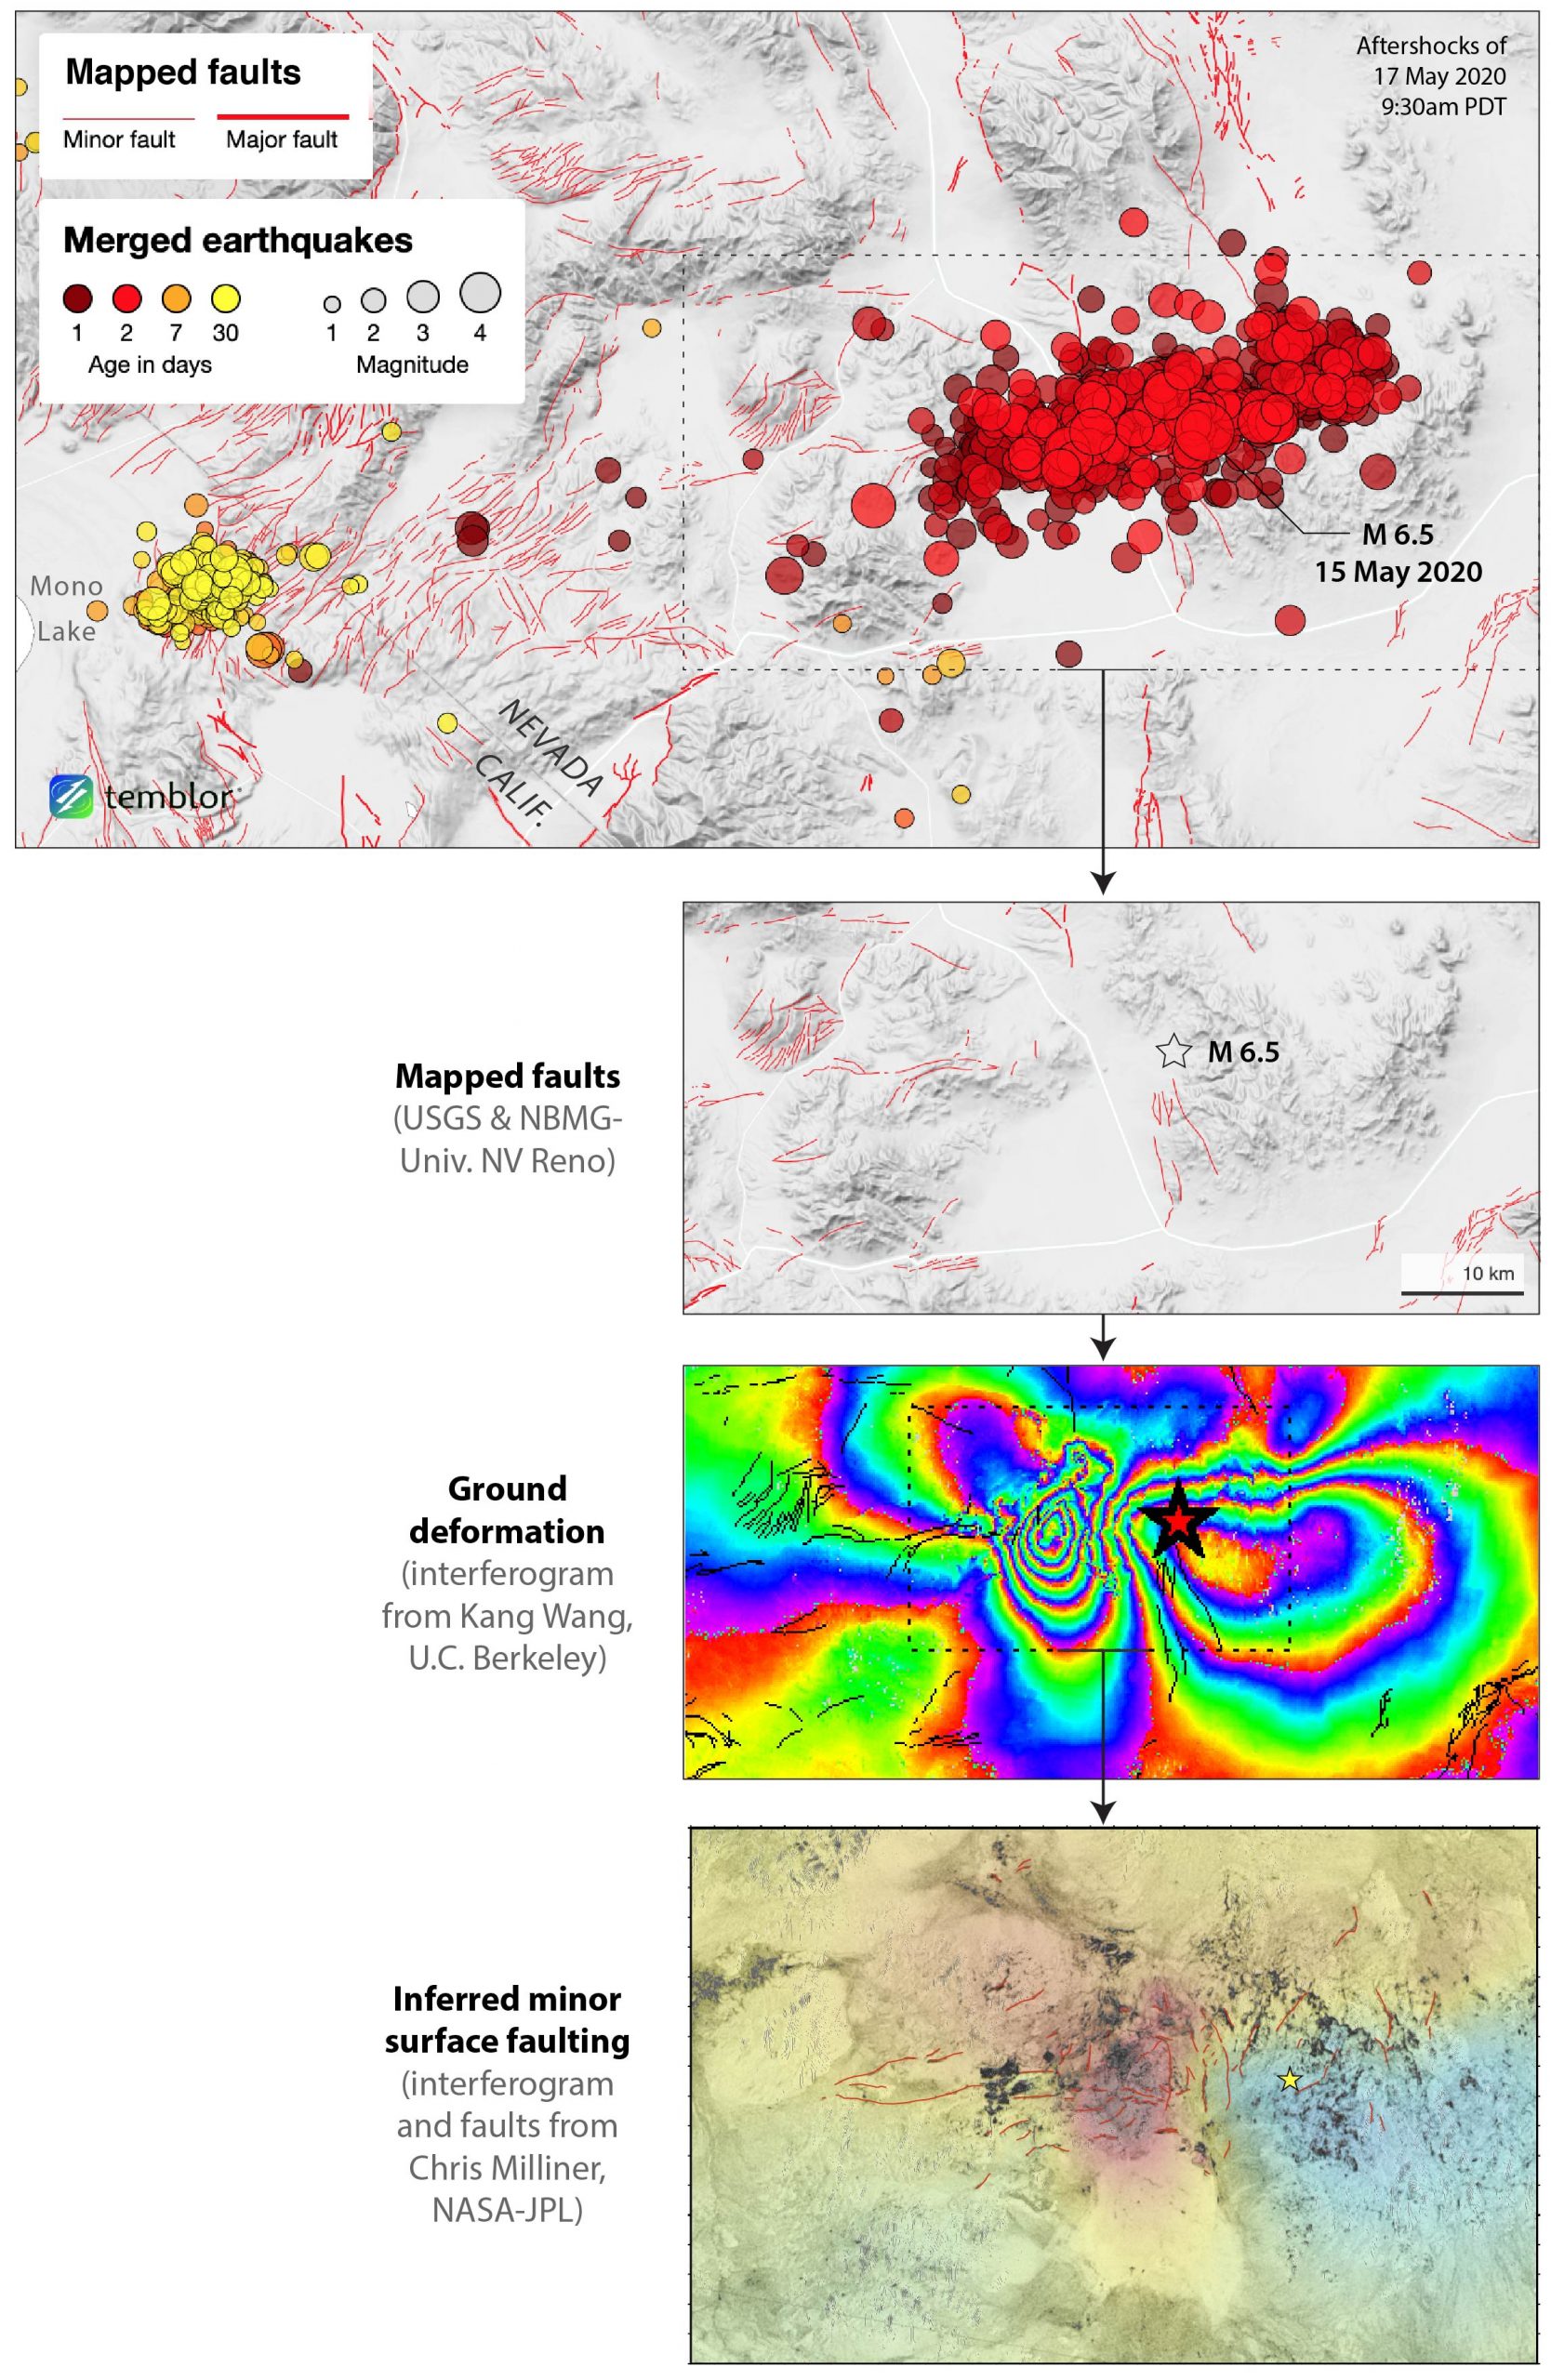
To the surprise of many, the earthquake produced no continuous surface rupture. Rather, the cracks seen in roadbeds and dirt tracks seem to be caused by shaking, or as suggested by the work of Chris Milliner, a scientist at NASA/JPL, represent a mesh of short, widely distributed faults. The absence of a clear linear surface rupture is borne out by radar satellite imagery, which shows a series of distributed surface cracks, with no tears along a discrete fault zone, as would be seen if the fault had broken the surface.
So far, aftershocks have occurred along a 15.5 mile (25 kilometer) long band, striking WSW, suggesting that the fault that ruptured has roughly the same orientation and length at depth. There are some small north-striking and west-striking faults within 1.2–6.2 miles (2–10 kilometers) of the epicenter, but no continuous faults.
Strike-slip earthquakes around magnitude-6.5, like the one near Tonopah, typically produce at least 8 inches (20 centimeters) of slip at the surface, along a length of at least 9 miles (15 kilometers; Wells and Coppersmith, 1994). The July 4, 2019 magnitude-6.4 Ridgecrest quake produced up to 3.3 feet (1 meter) of slip over a length of 12.4 miles (20 kilometers). The Tonopah quake produced none. So, this event — which occurred in a similar tectonic environment — is an outlier.
We cannot depend on mapped faults to forecast hazard
Because of its aridity and accessibility, central Nevada is one of the best mapped regions on Earth. Generations of geologists have scoured the landscape and mapped a cornucopia of faults. And in the past few days, many dozens of geologists have searched for the one that ruptured in the magnitude 6.5 quake, to no avail.
Because this region is so well mapped and a continuous fault along the aftershock trend has not been identified, and because the earthquake did not generate a continuous surface rupture, it is clear that at least for quakes up to magnitude-6.5, we cannot depend on fault mapping anywhere to accurately forecast earthquake hazard. Compounding this, in so many regions, vegetation or urbanization hides faults.
But do we care about earthquakes of this size, or is damage driven by much larger shocks, say magntitude-7.5?
Because there will generally be ten M 6.5 shocks for every M 7.5 shock, the small shocks do matter because there are so many more of them, and near their epicenters, shaking will be strong and damage likely. In fact, a magnitude 6.5 in an urban area can be catastrophic, as occurred in Christchurch, New Zealand, in 2010.
This in no way is meant to diminish the critical and demanding work of fault mapping. Each fault mapped is a seismic source better understood. But we must recognize that worldwide fault inventories are incomplete, and will likely remain so for decades, and so we must build testable models that acknowledge and accommodate this lack of knowledge.
Temblor’s PUSH model performs well in these situations
As are most earthquake models, the USGS hazard model (Petersen et al, 2014) is fault-based. This means that it uses the major active faults in a region to make an assessment of the future seismic hazard in the area. Here, the USGS model includes the Coaldale Fault, which is inferred to lie 12.4 miles (20 kilometers) south of the Tonopah epicenter. Between faults, these models include ‘area sources’ that fill in the potential for smaller shocks, such as a magnitude-6.5.
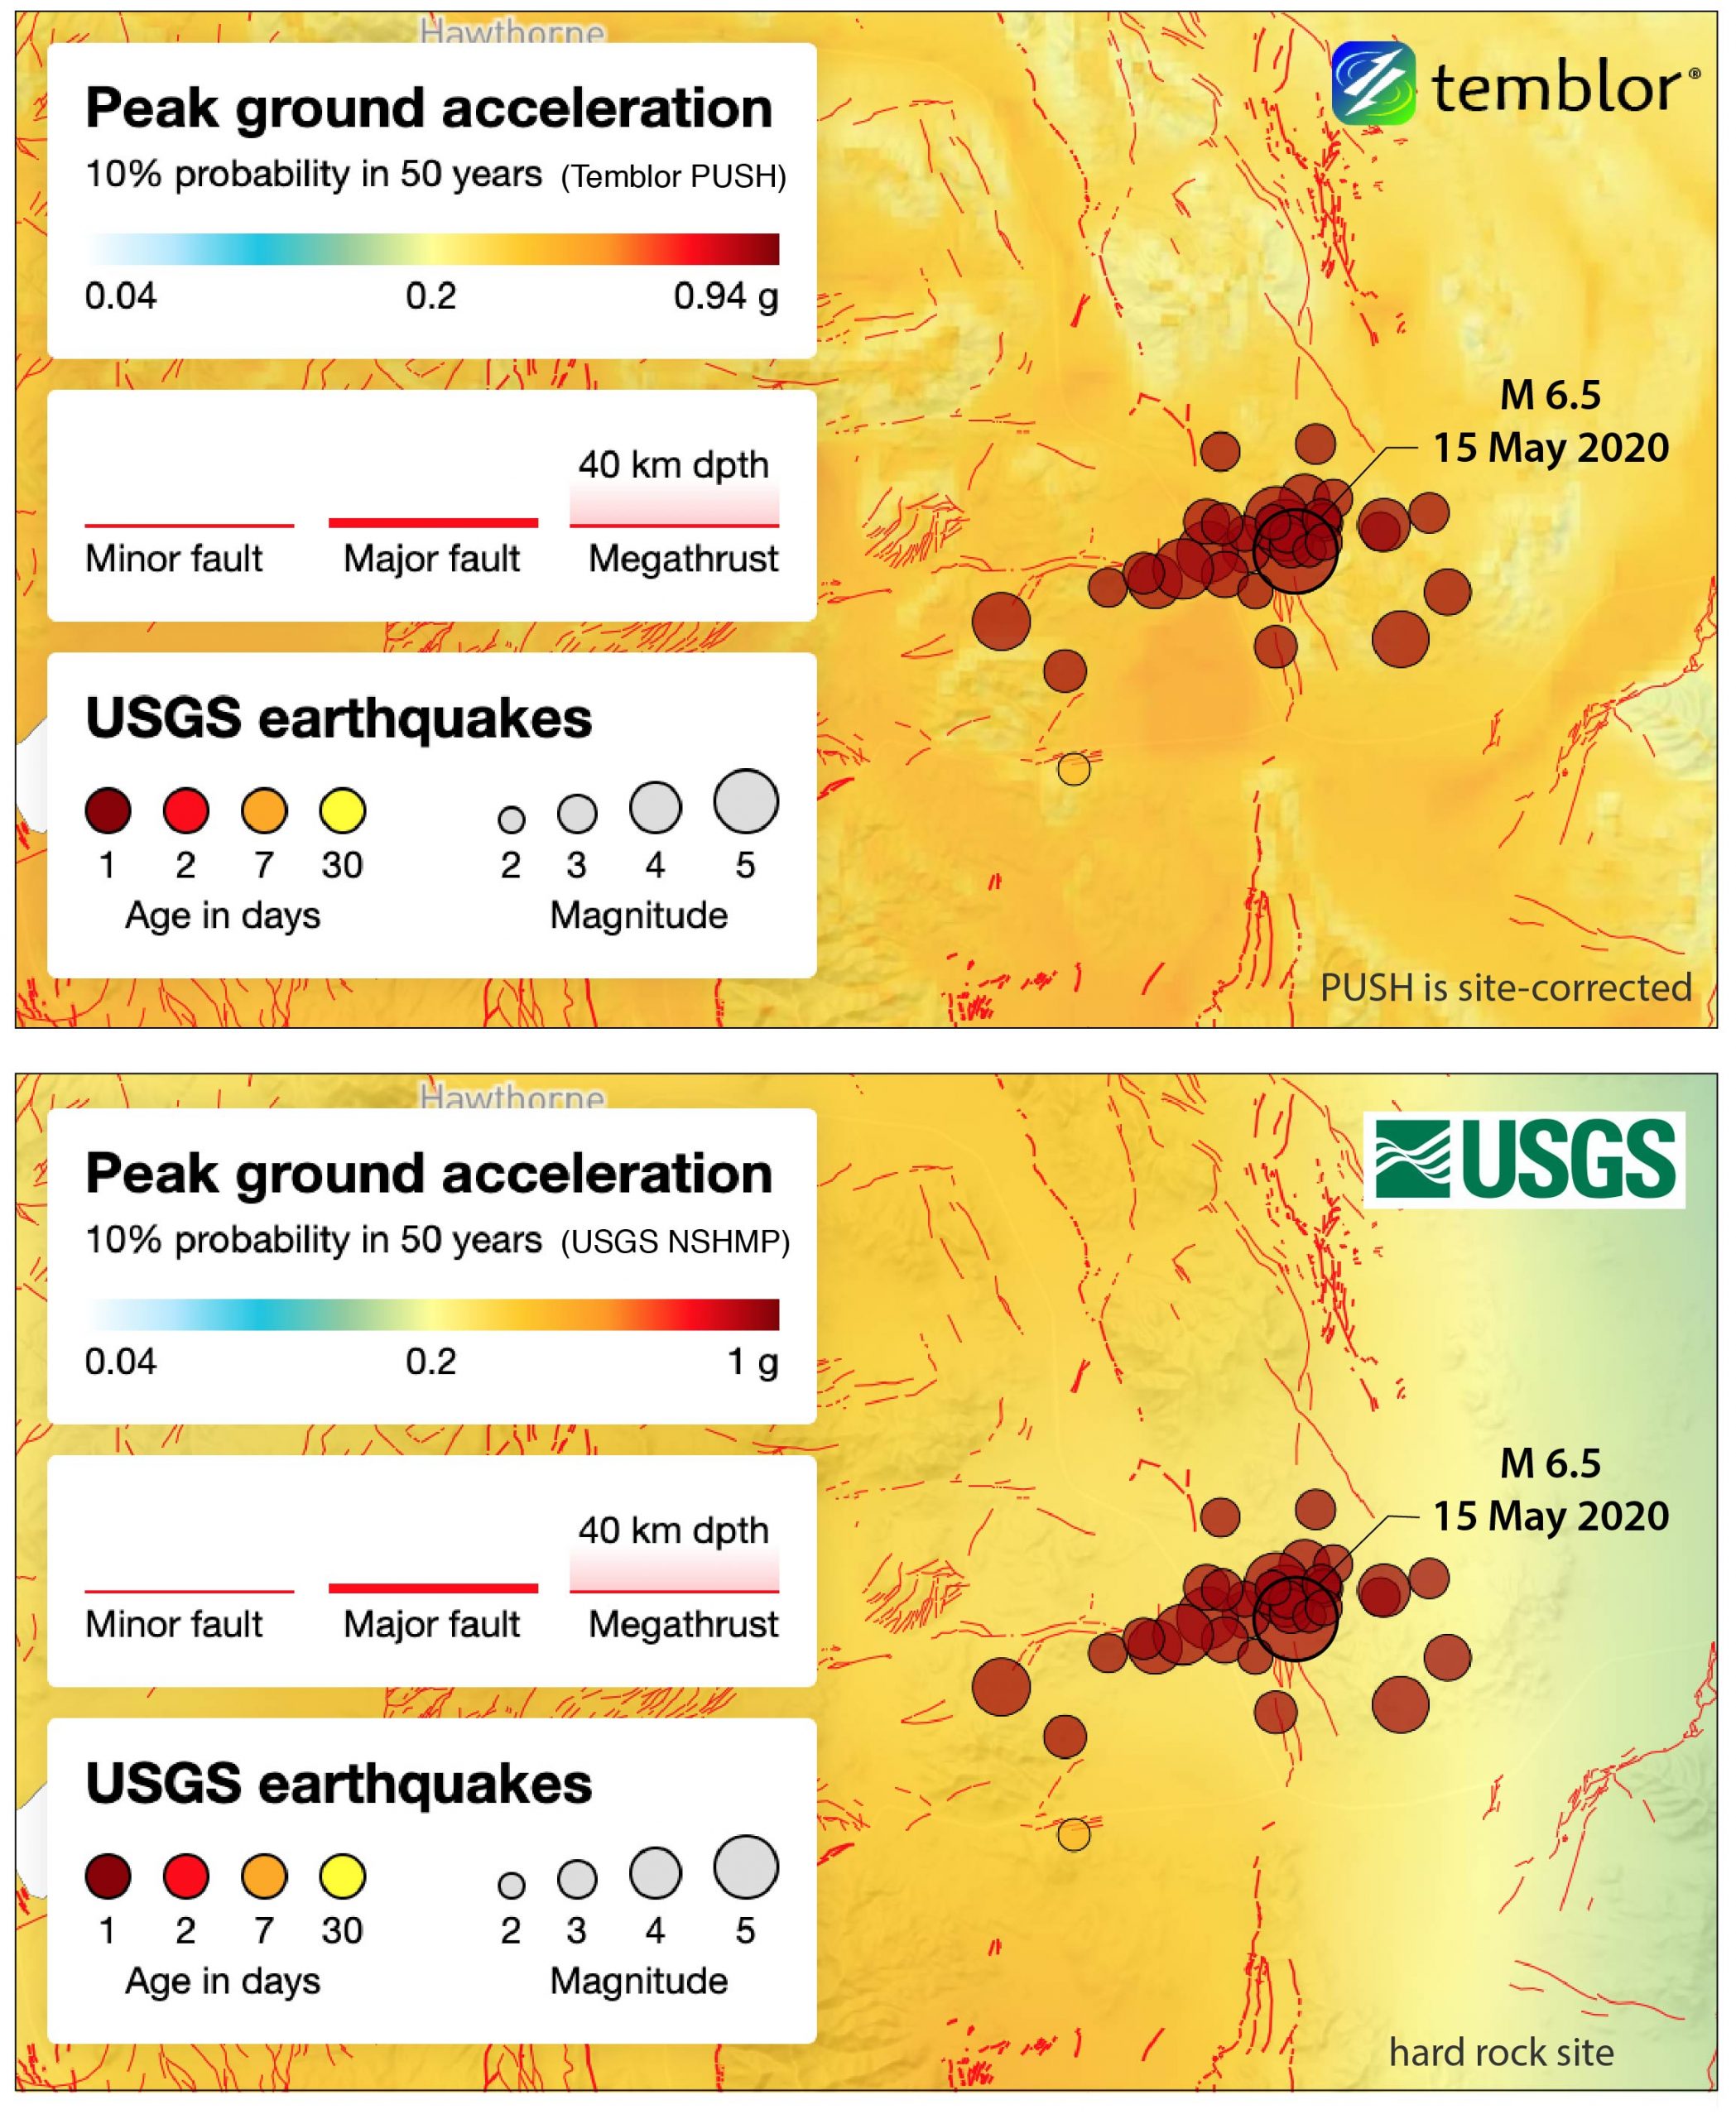
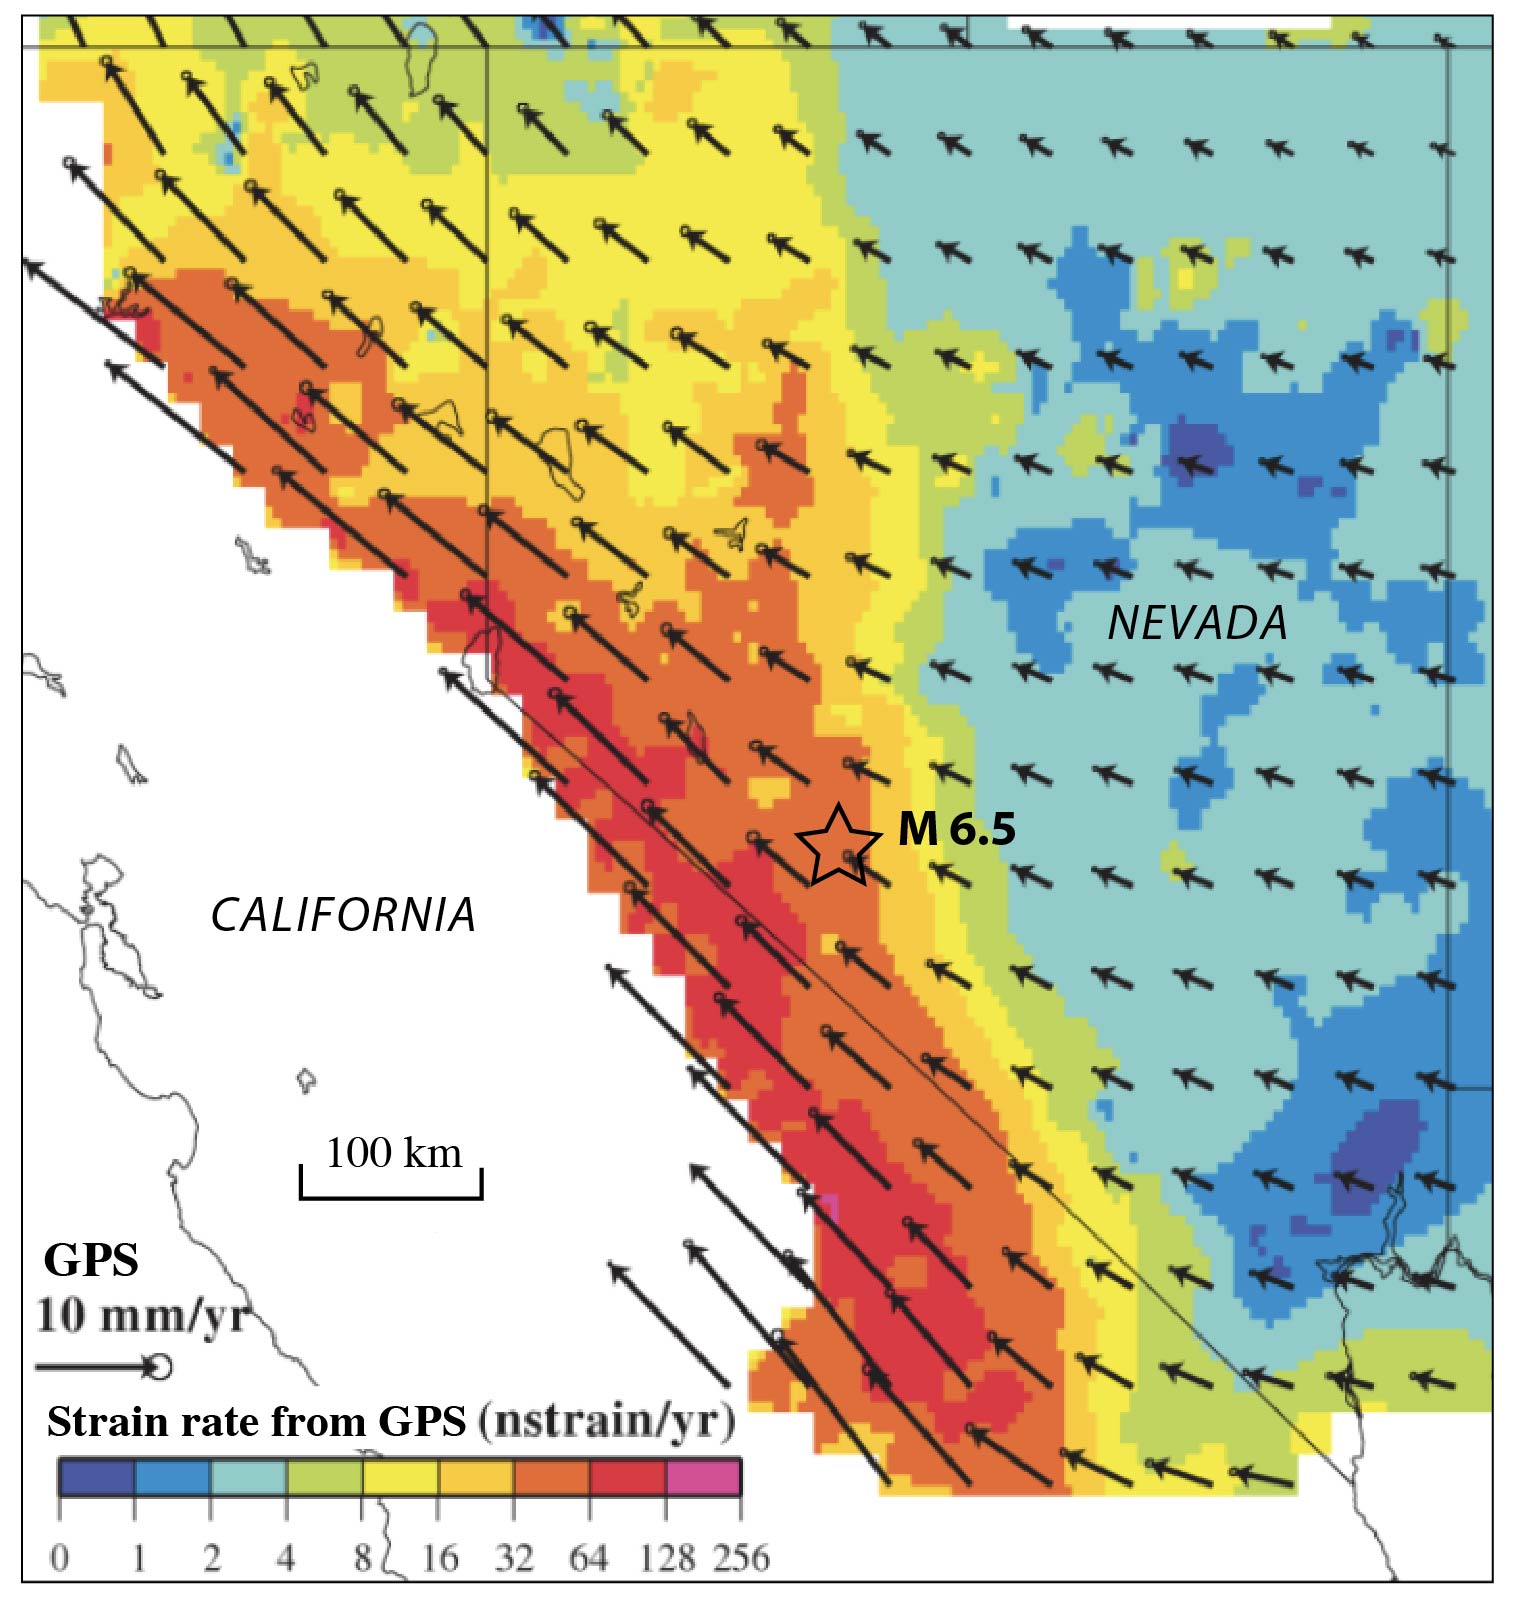
In contrast, Temblor’s worldwide PUSH (Probabilistic Uniform Seismic Hazard) model is not based on faults. Instead, it uses a blend of past quakes and geodetically measured surface strain, because faults strain the surface, and the strain is measured by GPS receivers. So, strain is a stand-in for faults. For the Tonopah quake, the shaking likelihood is similar, or a bit higher, in PUSH than in the USGS model. So, in our judgment, one does not need faults to forecast hazard. Because in most places around the world, the fault inventory is vastly inferior to that of Nevada, and so a fault-driven model can suffer.
Could the Tonopah event trigger a larger earthquake?
There is always a small chance that a mainshock will produce an aftershock larger than itself. So, it is important to determine which faults and areas have been brought closer to failure, meaning an earthquake is more imminent, and which have been inhibited by Friday’s magnitude-6.5 quake. For this, we performed a Coulomb analysis, which calculates how surrounding faults are sheared and unclamped by the mainshock, which promote failure.

Strike-slip faults located to the north, south, east and west and tensional (‘normal’) faults to the southwest and northeast have been brought closer to failure. There are some long, major faults in the red lobes, and so these are the strongest candidates for triggered events. But fortunately, none are in populated areas.
Bottom Line
If we can’t find all the faults capable rupturing strong shocks in Nevada, arguably the most well-mapped region in the world, then we are woefully uninformed about fault locations in most areas of the globe. So, models that blend past earthquakes with current strain give us a powerful, globally consistent alternative.
Want to know your earthquake risk? Check it at Temblor.
Acknowledgements
We thank Kang Wang (U.C. Berkeley) and Chris Milliner (NASA JPL) for posting their preliminary findings on twitter, Ben Brooks (USGS) for reporting on field mapping, and Alka Tripathy-Lang for scouring the interferograms.
Further Reading
Kreemer, C., Blewitt, G., and Hammond, W.C., 2009, Geodetic constraints on contemporary deformation in the northern Walker Lane: 2. Velocity and strain rate tensor analysis, in Oldow, J.S., and Cashman, P.H., eds., Late Cenozoic Structure and Evolution of the Great Basin–Sierra Nevada Transition: Geological Society of America Special Paper 447, p. 17–31, doi: 10.1130/2009.2447(02).
Petersen, M. D., Moschetti, M. P., Powers, M. P., Mueller, C. S., Haller, K. M., Frankel, A. D, et al. (2015). The 2014 United States National Seismic Hazard Model, Earthquake Spectra, 31, S1-S30, doi: 10.1193/120814EQS210M.
Wells, D. L., and K. J. Coppersmith (1994). New empirical relationships among magnitude, rupture length, rupture width, rupture area, and surface displacement, Bull. Seismol. Soc. Am. 84, 974–1002.
- Philippines magnitude 7.8 shock may have loaded the central Cotabato subduction zone - June 11, 2026
- Remembering Geoffrey C.P. King (1943-2026) - June 9, 2026
- Magnitude 6.0 earthquake strikes the Big Island of Hawai’i - May 26, 2026