By Gabriel Lotto, Temblor
The Louisiana floods, which have killed 13 people and damaged 40,000 homes, were the result of severe rainfall that drenched the Baton Rouge area. As much as 25 inches of rain fell in a two day period, according to the National Weather Service. Even in rainy Louisiana, the odds of so much water falling over such a short period of time in a given year are less than 1 in 1000, or 0.1%.
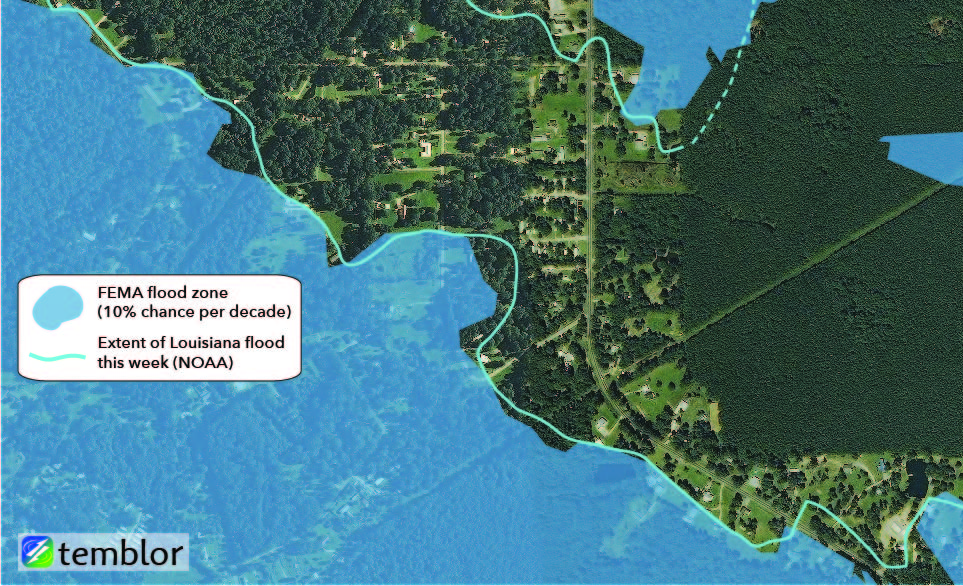
How well do those extreme rainfall totals map to flood levels? FEMA, which creates flood hazard maps for most of the United States, does not map a 1 chance in 1000 flood zone. But FEMA does map a 1% per year (~10% per decade) flood zone. These are places where, every year, you have at least a 1% chance of a flood.
It’s important to understand that flood events happen independently of one another. In other words, having a major flood this year doesn’t decrease the odds of having a major flood next year. Likewise, going 100 years without a major flood doesn’t increase your odds of seeing one tomorrow.
Louisiana flooding vs. FEMA flood zone
Here, we take a look at three Temblor flood zone maps from the region hit hardest in Louisiana. All three show that the actual floods (data from NOAA aerial images) matched or exceeded the 1% annual flood zone.
This first map, from Denham Springs near Port Vincent, shows just how accurately FEMA’s 1% annual flood zone predicted the area inundated by floods. However, the actual flood (light blue line) slightly surpassed the flood zone, meaning that a flood like this had less than a 1% chance of occurring this (or any) year.

This map, from East Baton Rouge, again shows how well the 1% chance per year (10% chance per decade) flood zone performed against the wiles of nature.

This final map of the French Settlement in Livingston Parish shows the starkest difference between the 1% per year flood zone and the actual flooding that took place. In this region, several more roads and buildings were flooded than would have been expected in a 1% per year flood.
Ultimately, we don’t know exactly how rare the Louisiana floods were. But these maps show that the odds of seeing such extreme flooding in this part of Louisiana in a given decade are less than 10%.
You can discover your flood risk anywhere in the US with Temblor’s flood maps. Go to app.temblor.net, find the layers icon in the top-right, and select the “Flood” layer.
Sources
FEMA
NOAA
National Weather Service
- Beware quiet segments of the Philippine Fault - May 16, 2025
-
ډیری عوامل افغاني ټولنې د زلزلې پر وړاندې زیانمنوي
- August 11, 2022 - What’s happening this week in Humboldt County, California: The squeeze - February 6, 2019