By David Jacobson, Temblor
On Monday, we posted a blog about how we just added faults for approximately 50 countries. Now, that number has grown even more, with the addition of several countries in northwest South America, including Colombia, Ecuador, Peru, and many more. The source, known as the Active Tectonics of the Andes (ATA) database, comes from a group of researchers at the University of Kansas, and the Instituto del Petroleo in Colombia. Fault locations are from literature, field mapping, digital elevation models, earthquakes, and the regional velocity field that was obtained from GPS studies.
Because we just added these countries, we thought we’d take a look at some of the data and how it stacks up to earthquakes in the region. In the map below, M=4.5+ earthquakes with a depth less than 70 km are shown. First, it can be seen that the region has multiple sources of seismicity, including the offshore subduction zone, and complex networks of shallow crustal faults.
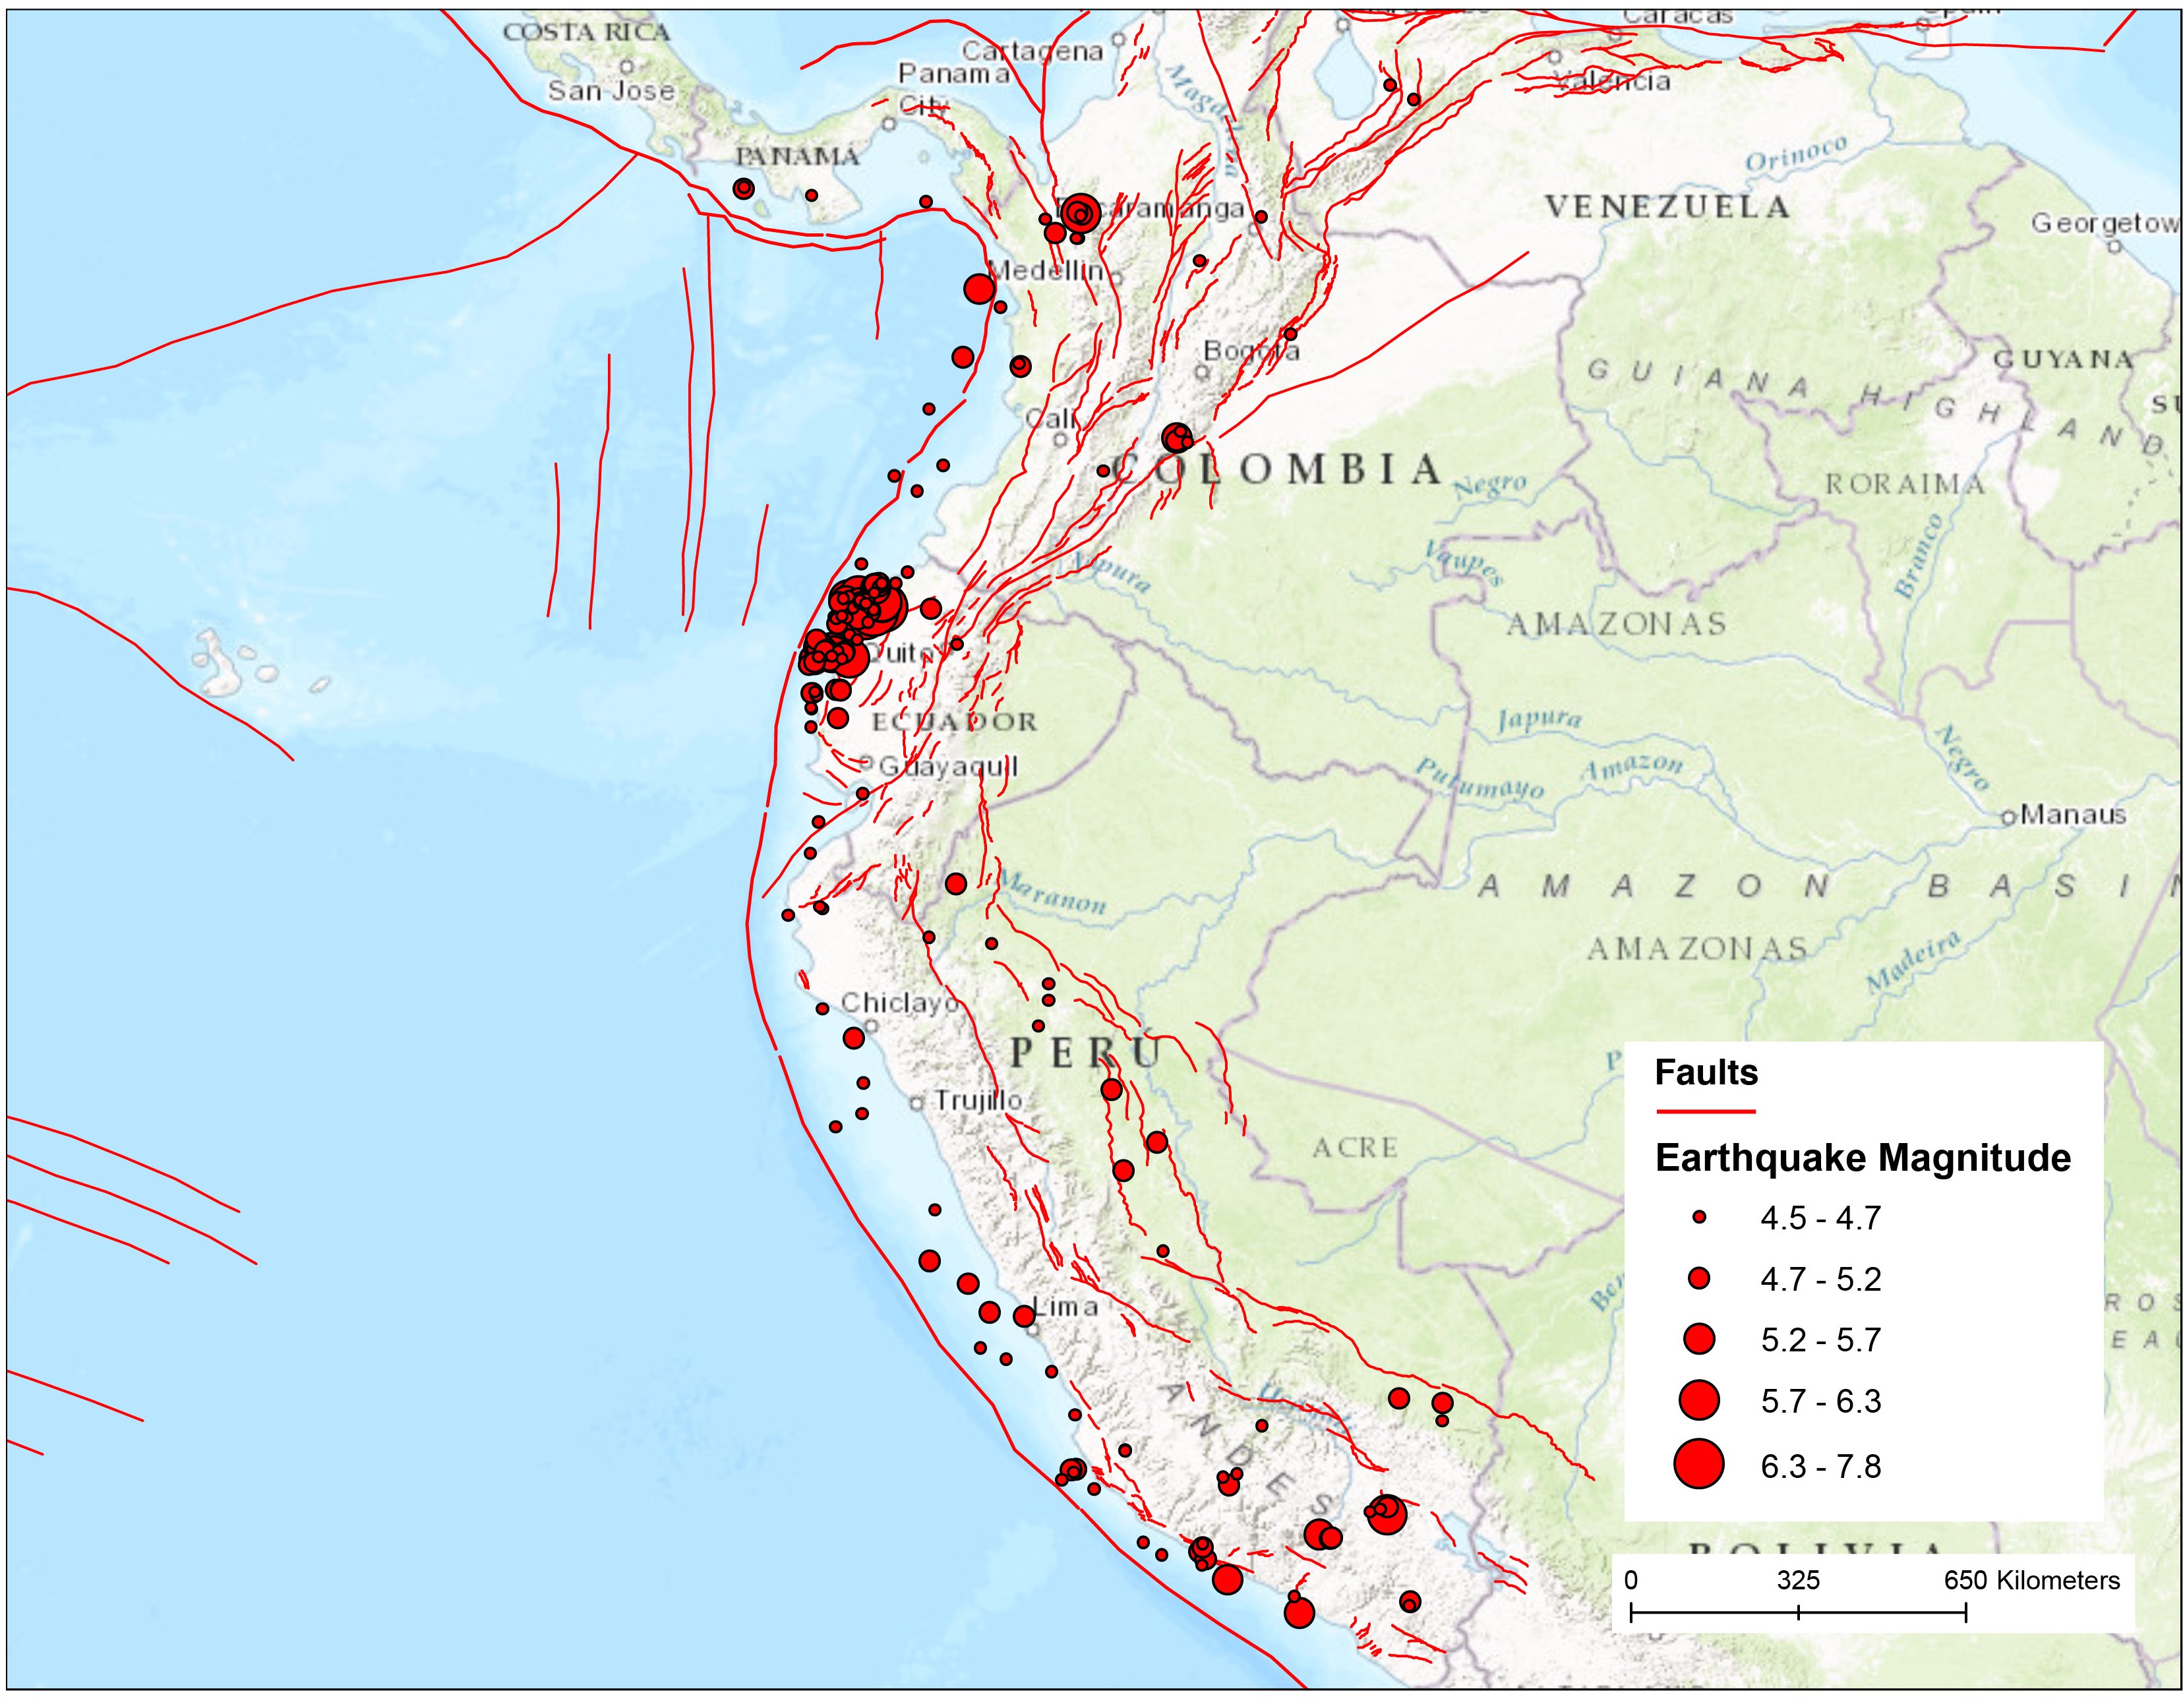
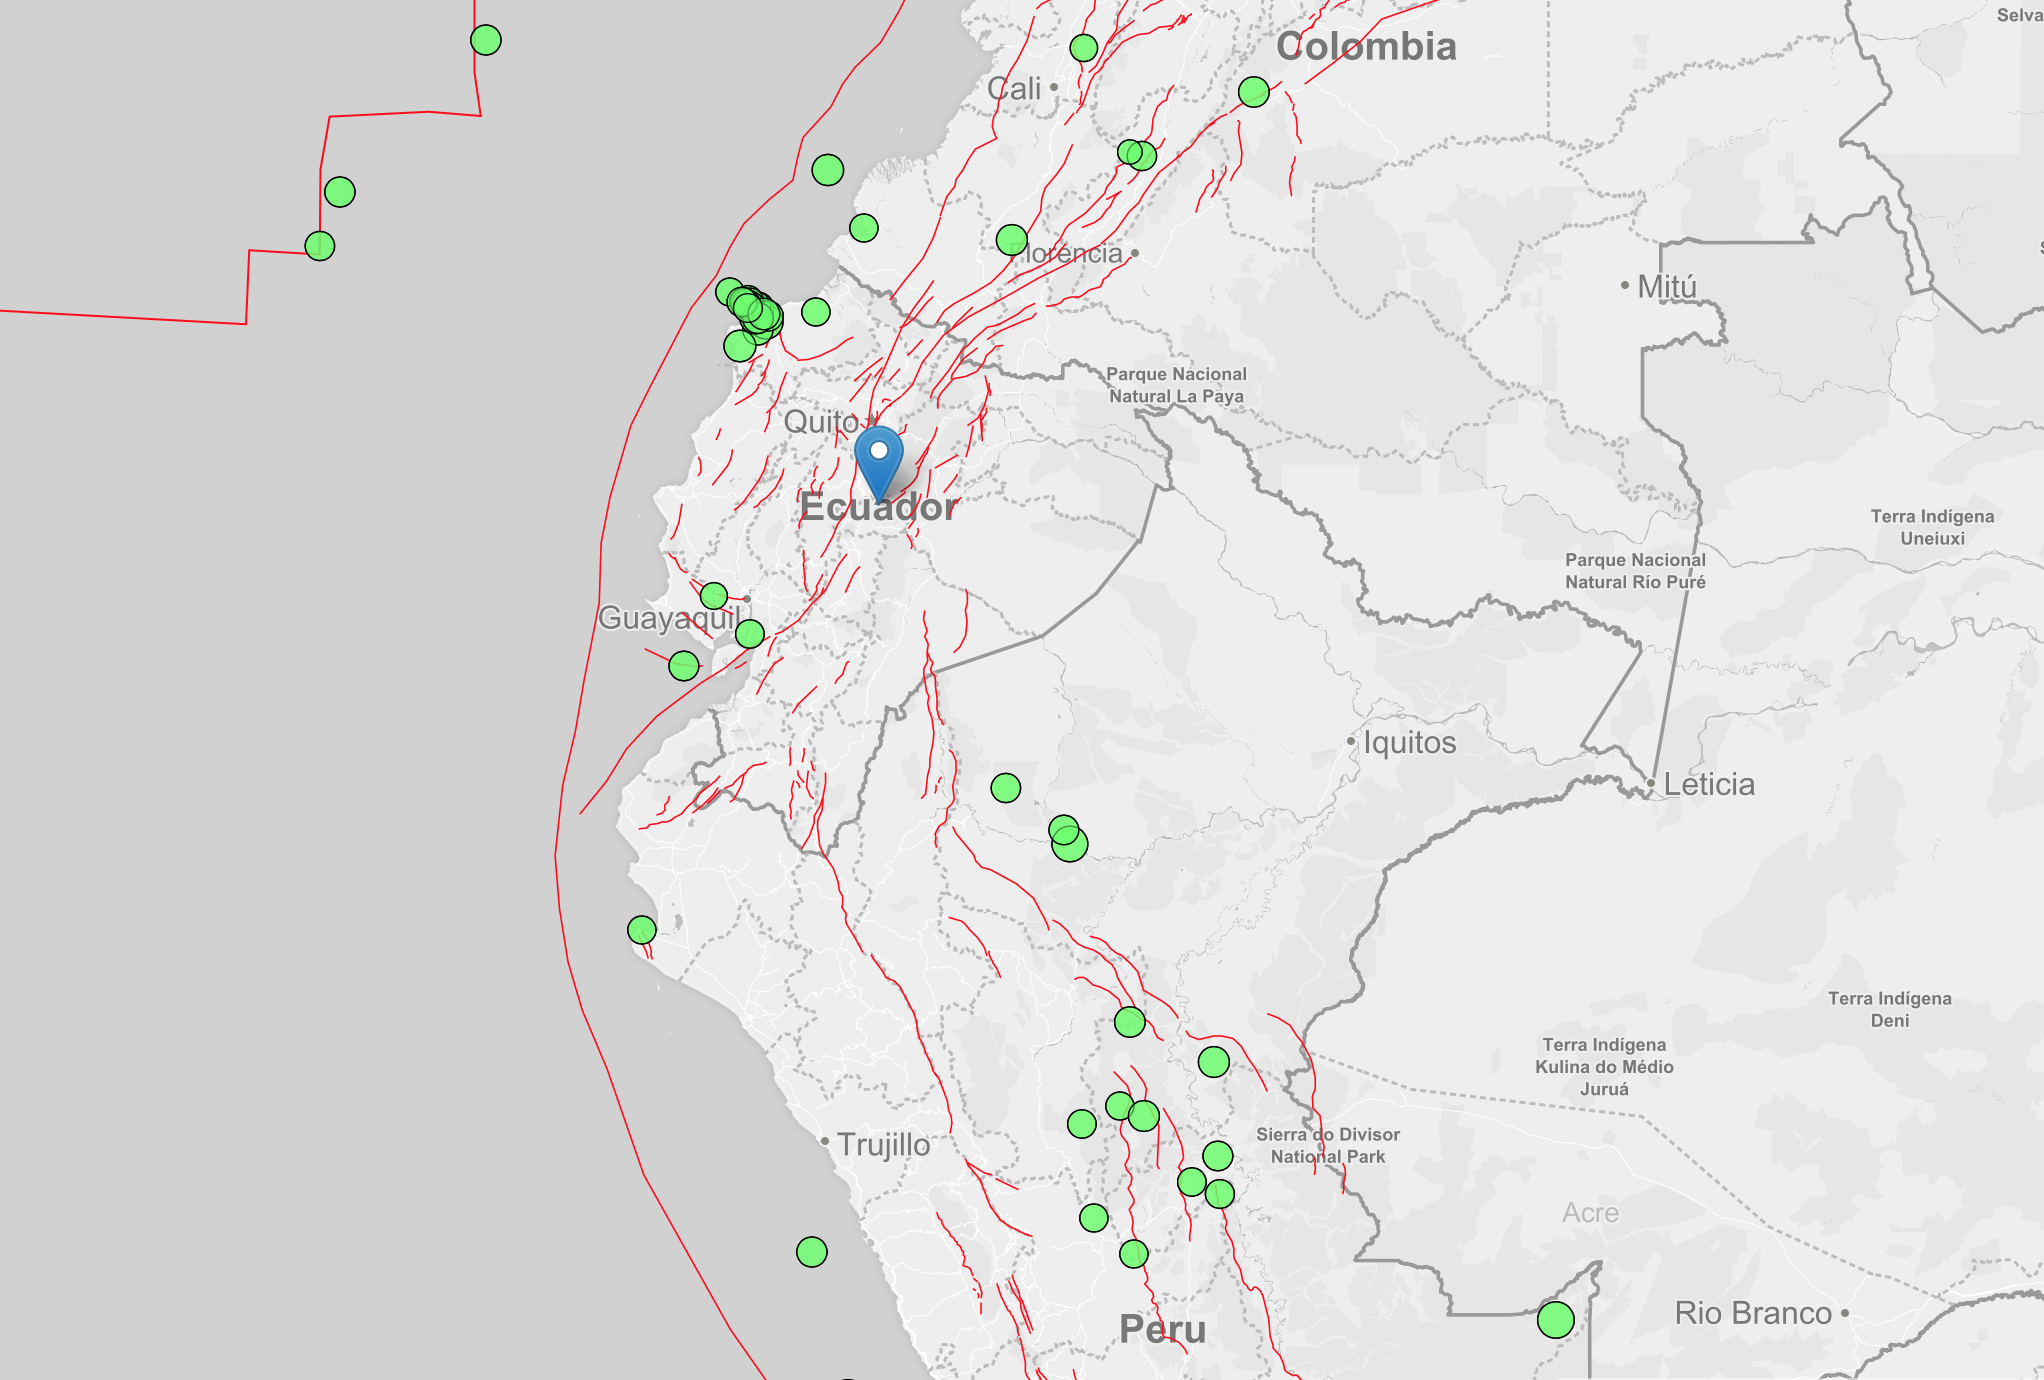
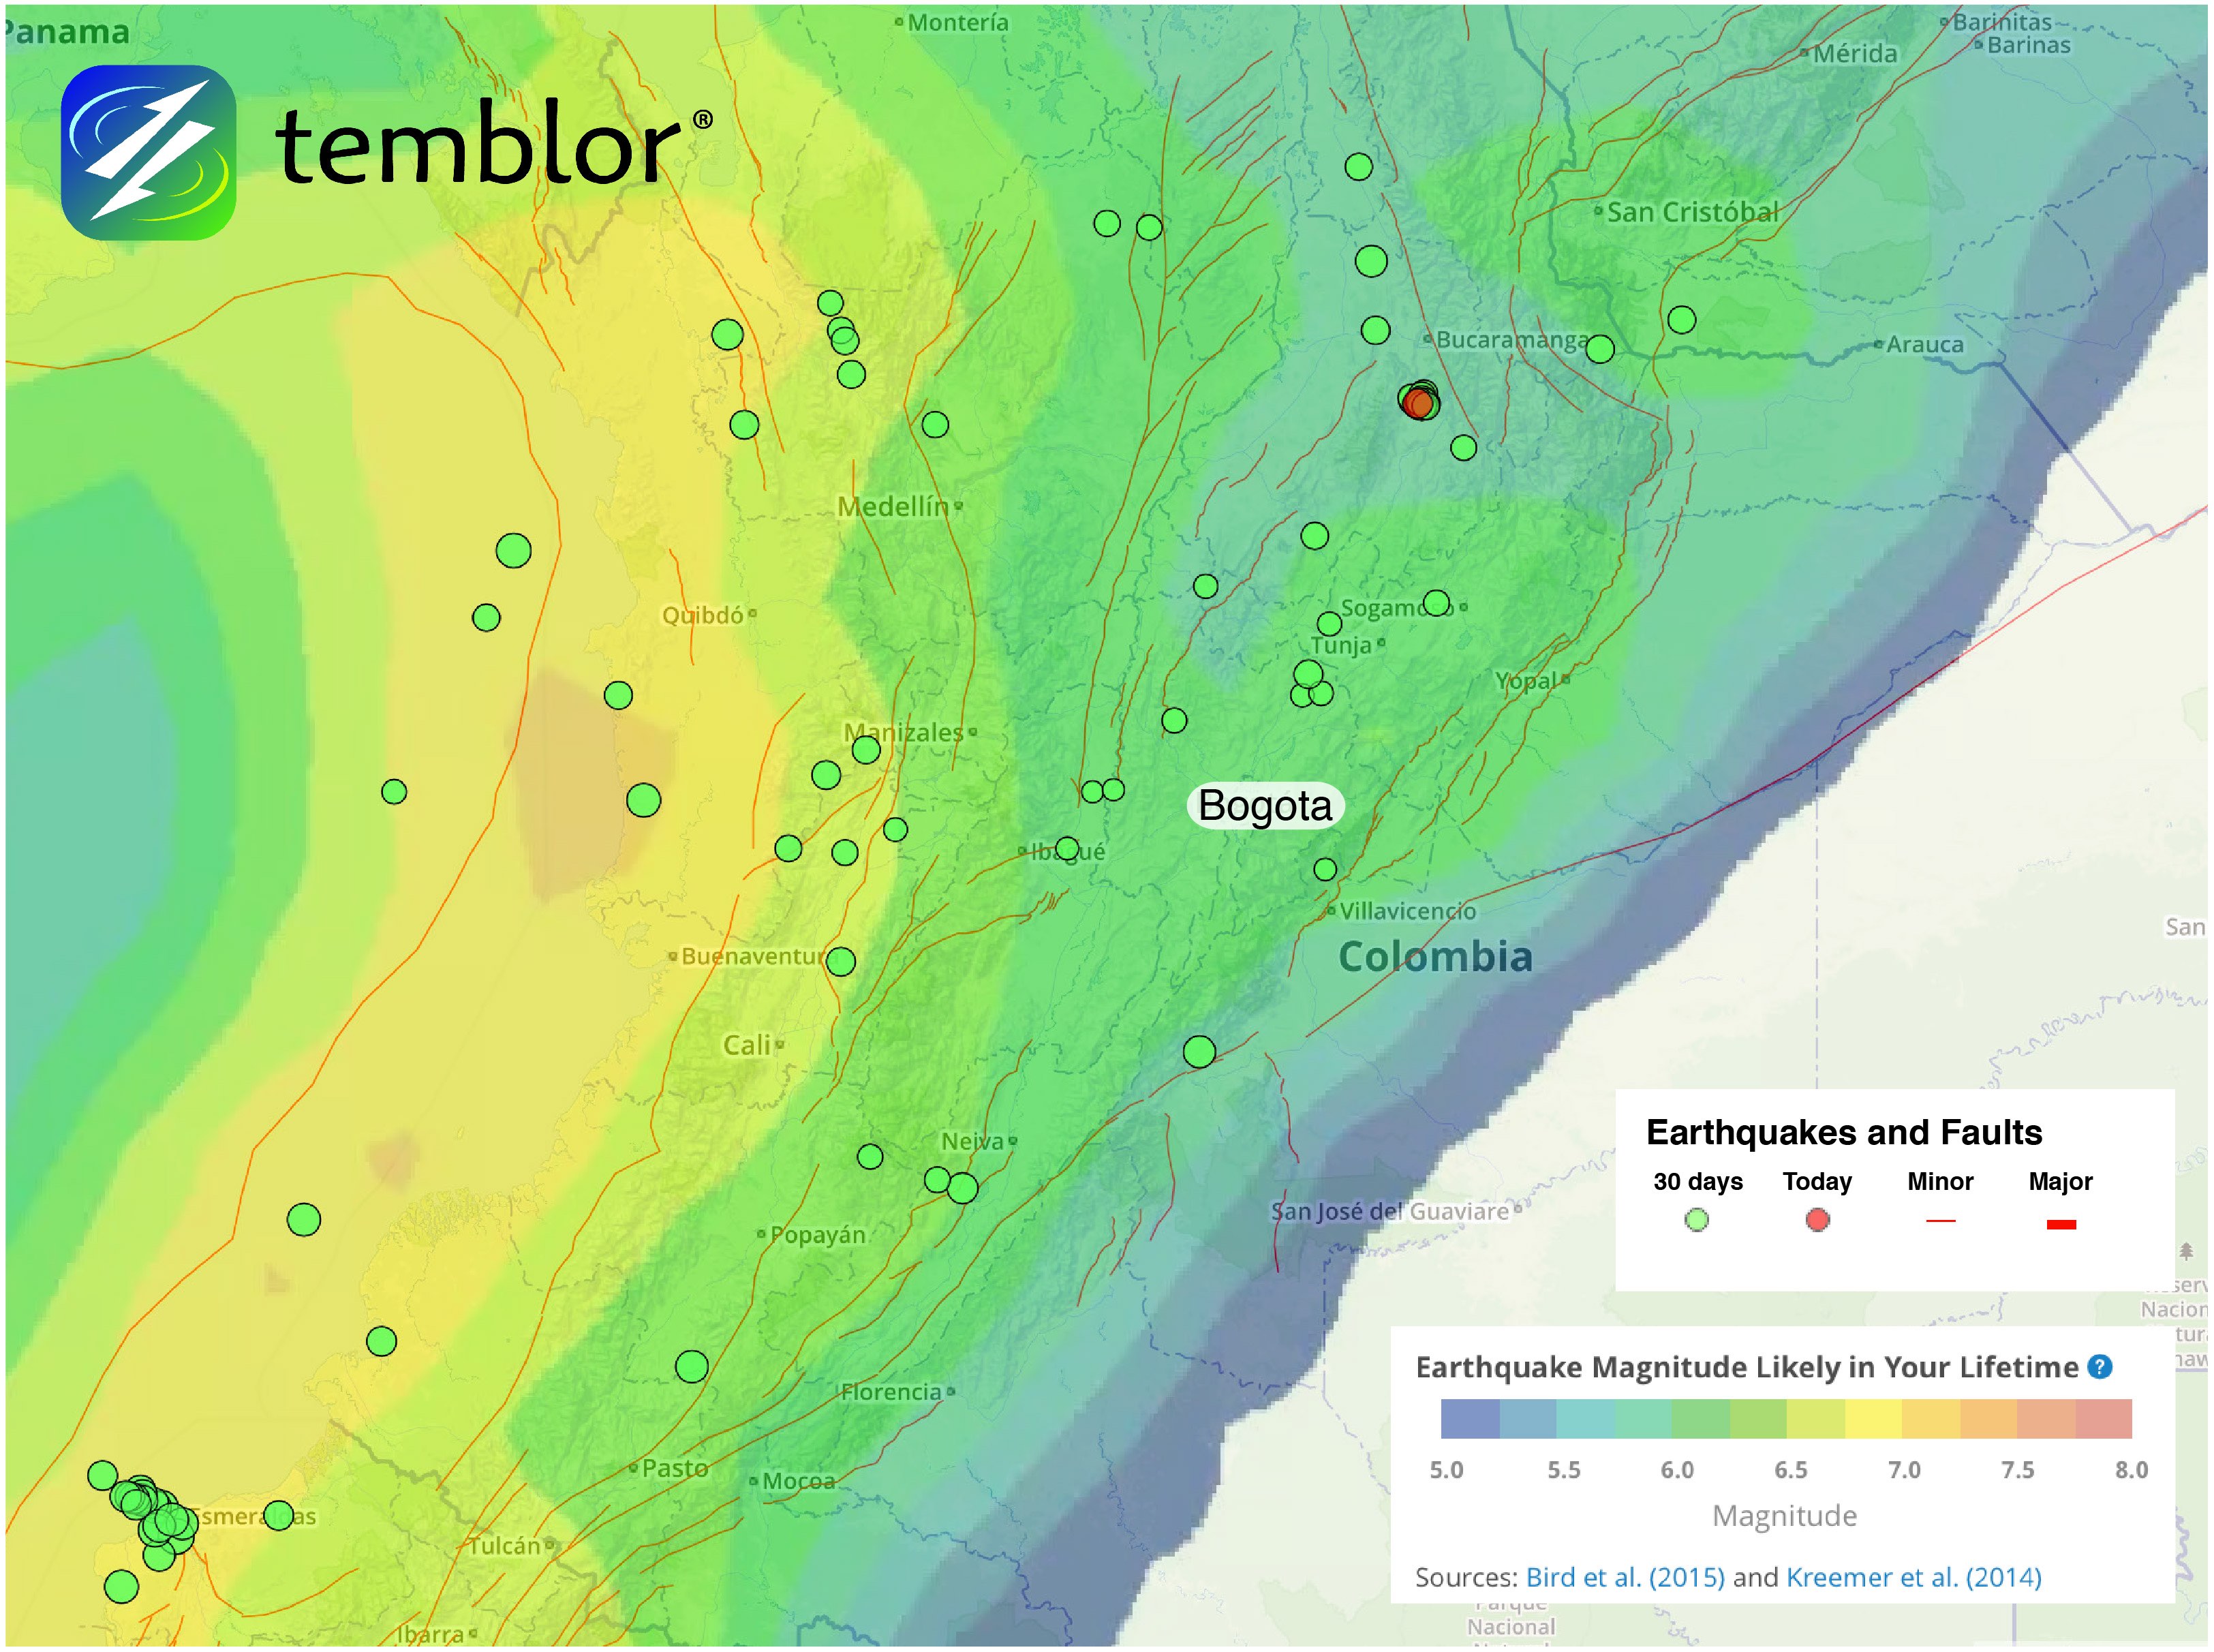
Several things can be seen from this map. First, the inland earthquakes tend fall on or close to faults in the our new database on on Temblor. Secondly, in Ecuador, nearly all of the larger magnitude earthquakes in the last year occurred in the northwest corner of the country, away from the main network of inland faults. Many of these earthquakes were along the offshore subduction zone. The main exception to this is a single M=4.7 earthquake near the capital city of Quito on September 5, 2016. While this earthquake is not as large as many of those felt in the region, light to moderate shaking was felt in the capital, in which over 1.5 million people live. In the figure below, you can see a Temblor map of Ecuador with the faults shown. Additionally, the Global Earthquake Activity Rate (GEAR) model is turned on, which shows the likely earthquake magnitude in your lifetime anywhere on earth.

Being able to see where faults are is extremely important to earthquake-prone regions like this for the simple reason that earthquakes occur on faults, and large earthquakes occur on large faults. So, being able to identify the faults around you allows you to understand where earthquakes could occur.
While we have just posted this database, if any local organizations have more updated maps, we would gladly amend our website to better reflect the active tectonics of the region.
Sources
Veloza et al., 2012 GSA Today (ATA Database)
USGS
- Earthquake science illuminates landslide behavior - June 13, 2025
- Destruction and Transformation: Lessons learned from the 2015 Gorkha, Nepal, earthquake - April 25, 2025
- Knock, knock, knocking on your door – the Julian earthquake in southern California issues reminder to be prepared - April 24, 2025