By Ross Stein and David Jacobson, Temblor
Check your hazard rank in Temblor
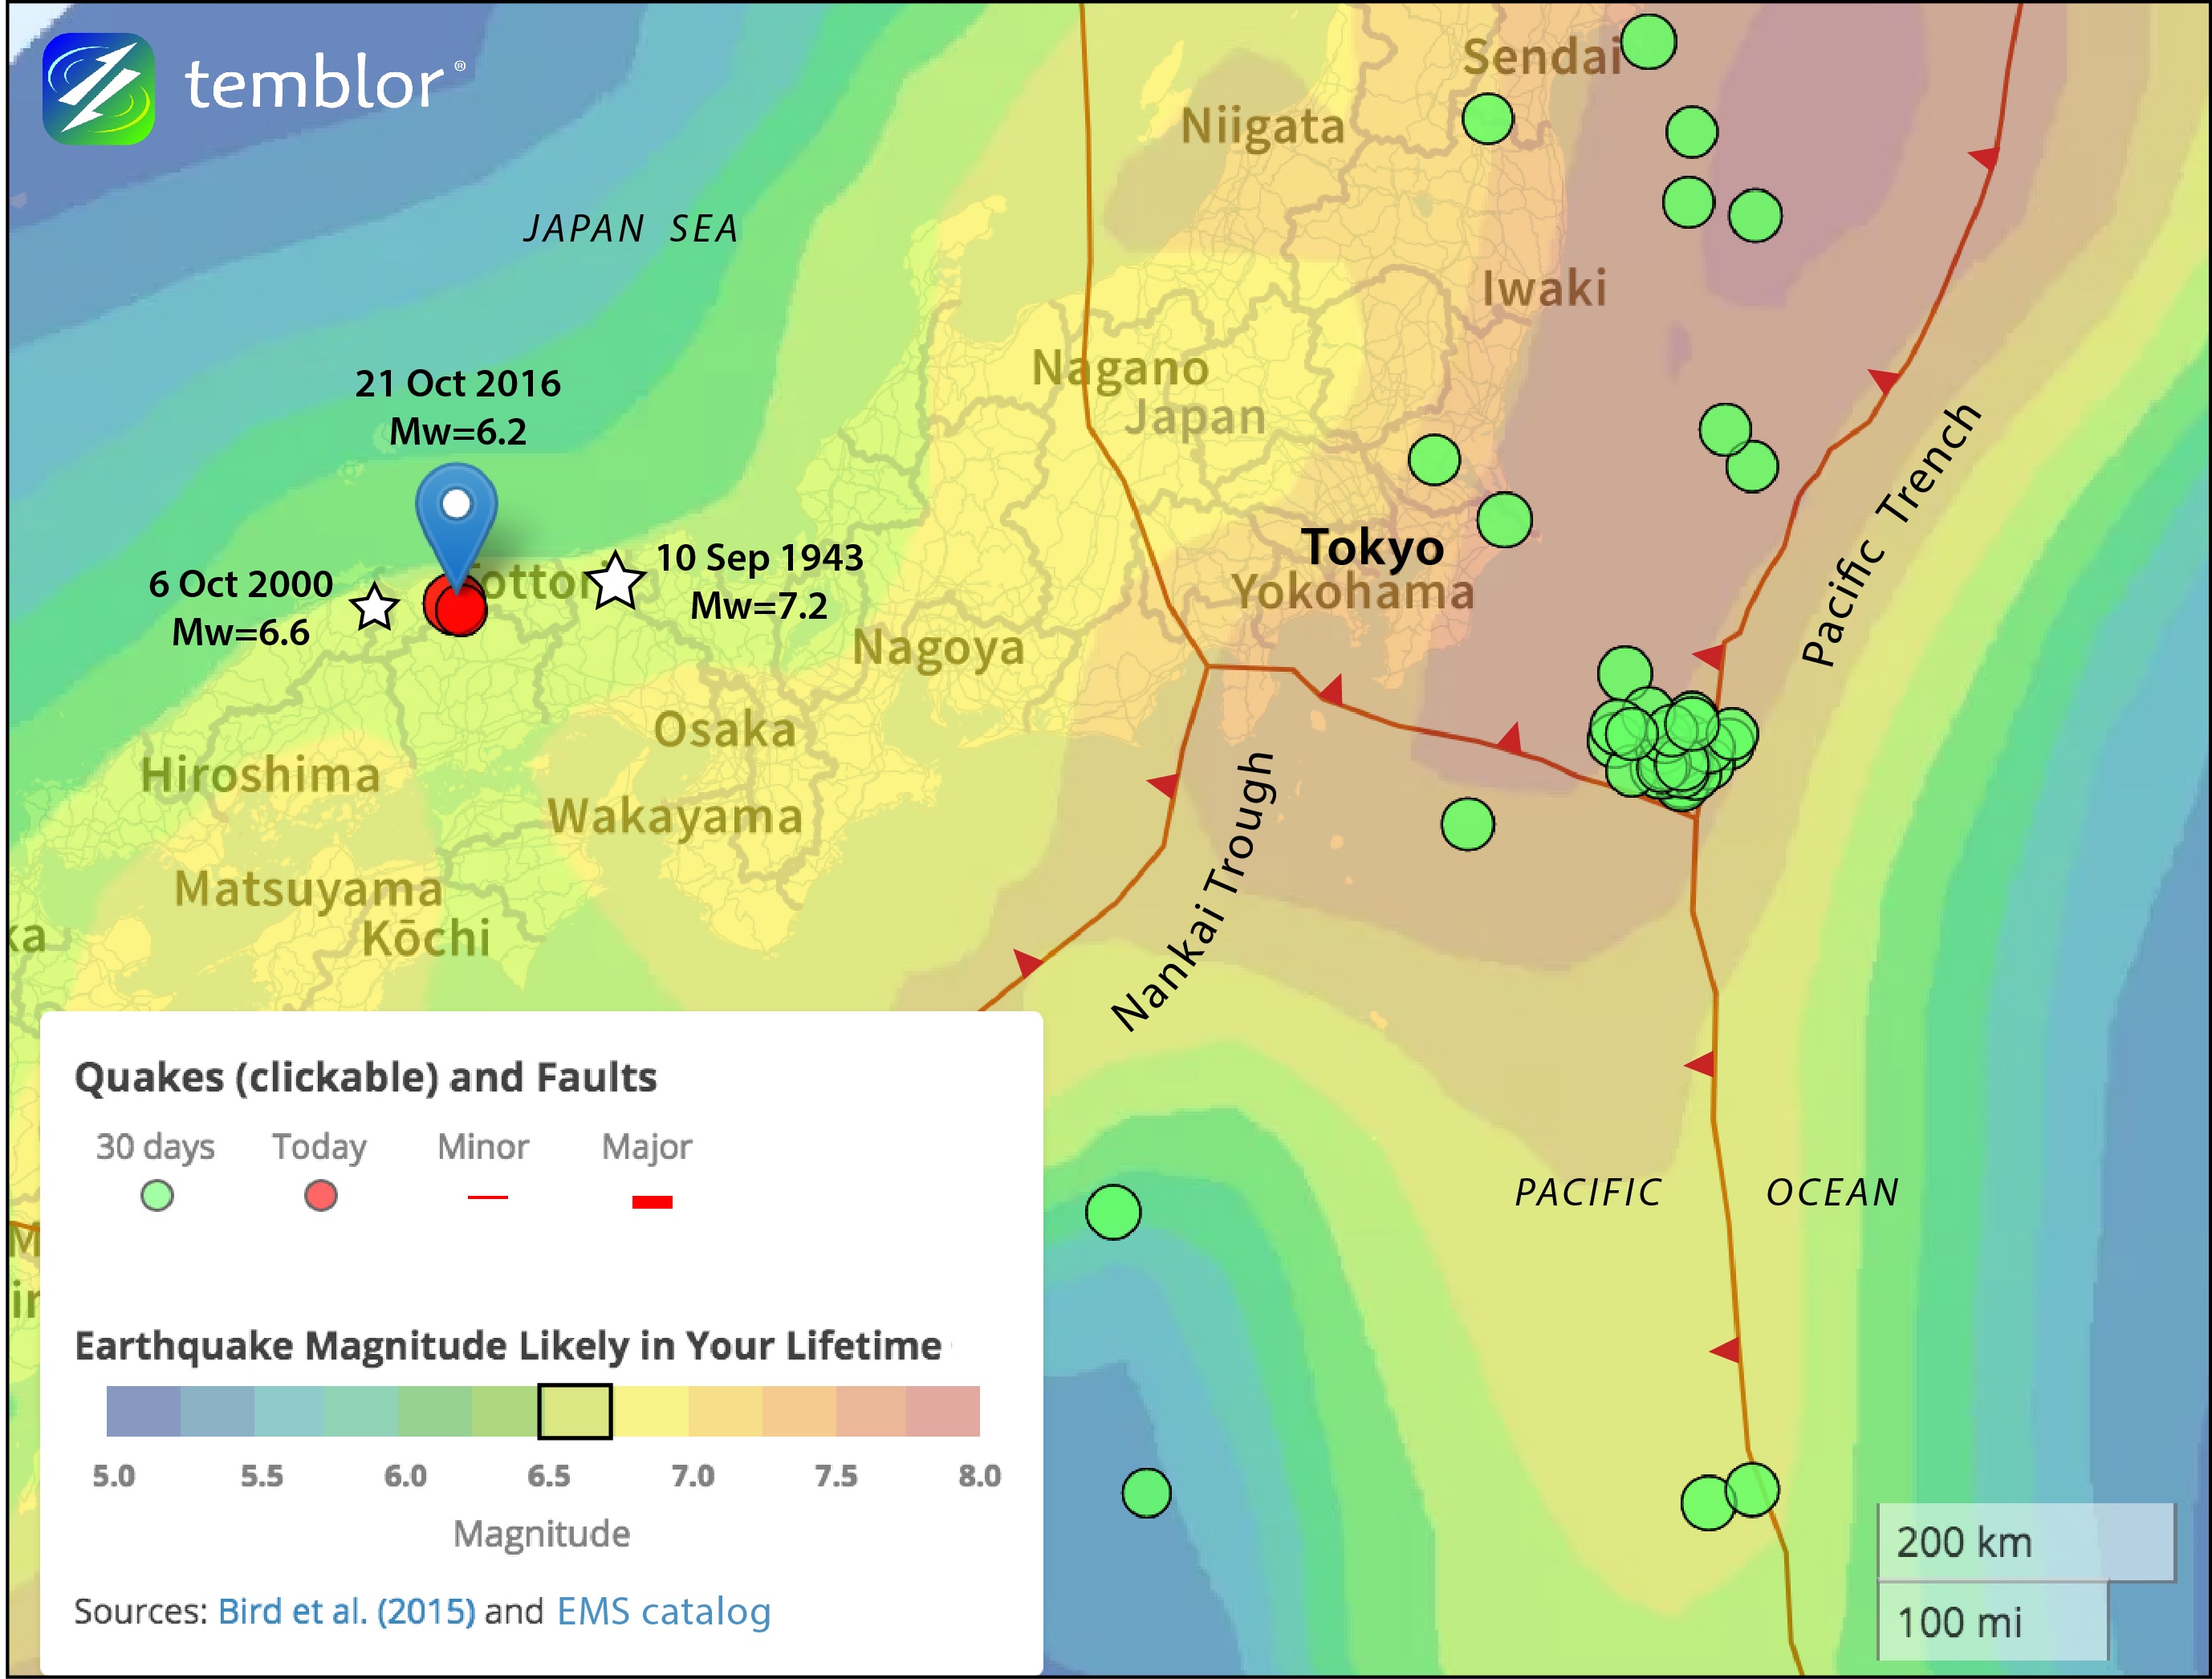
Today’s M=6.2 earthquake lies 25 km east of where the 2000 Mw=6.2 Tottori shock (which struck on a north-oriented left-lateral strike-slip fault), and 30 km west of the 1943 Mw=7.2-7.4 Tottori quake (which struck on one or more east-oriented right-lateral faults).
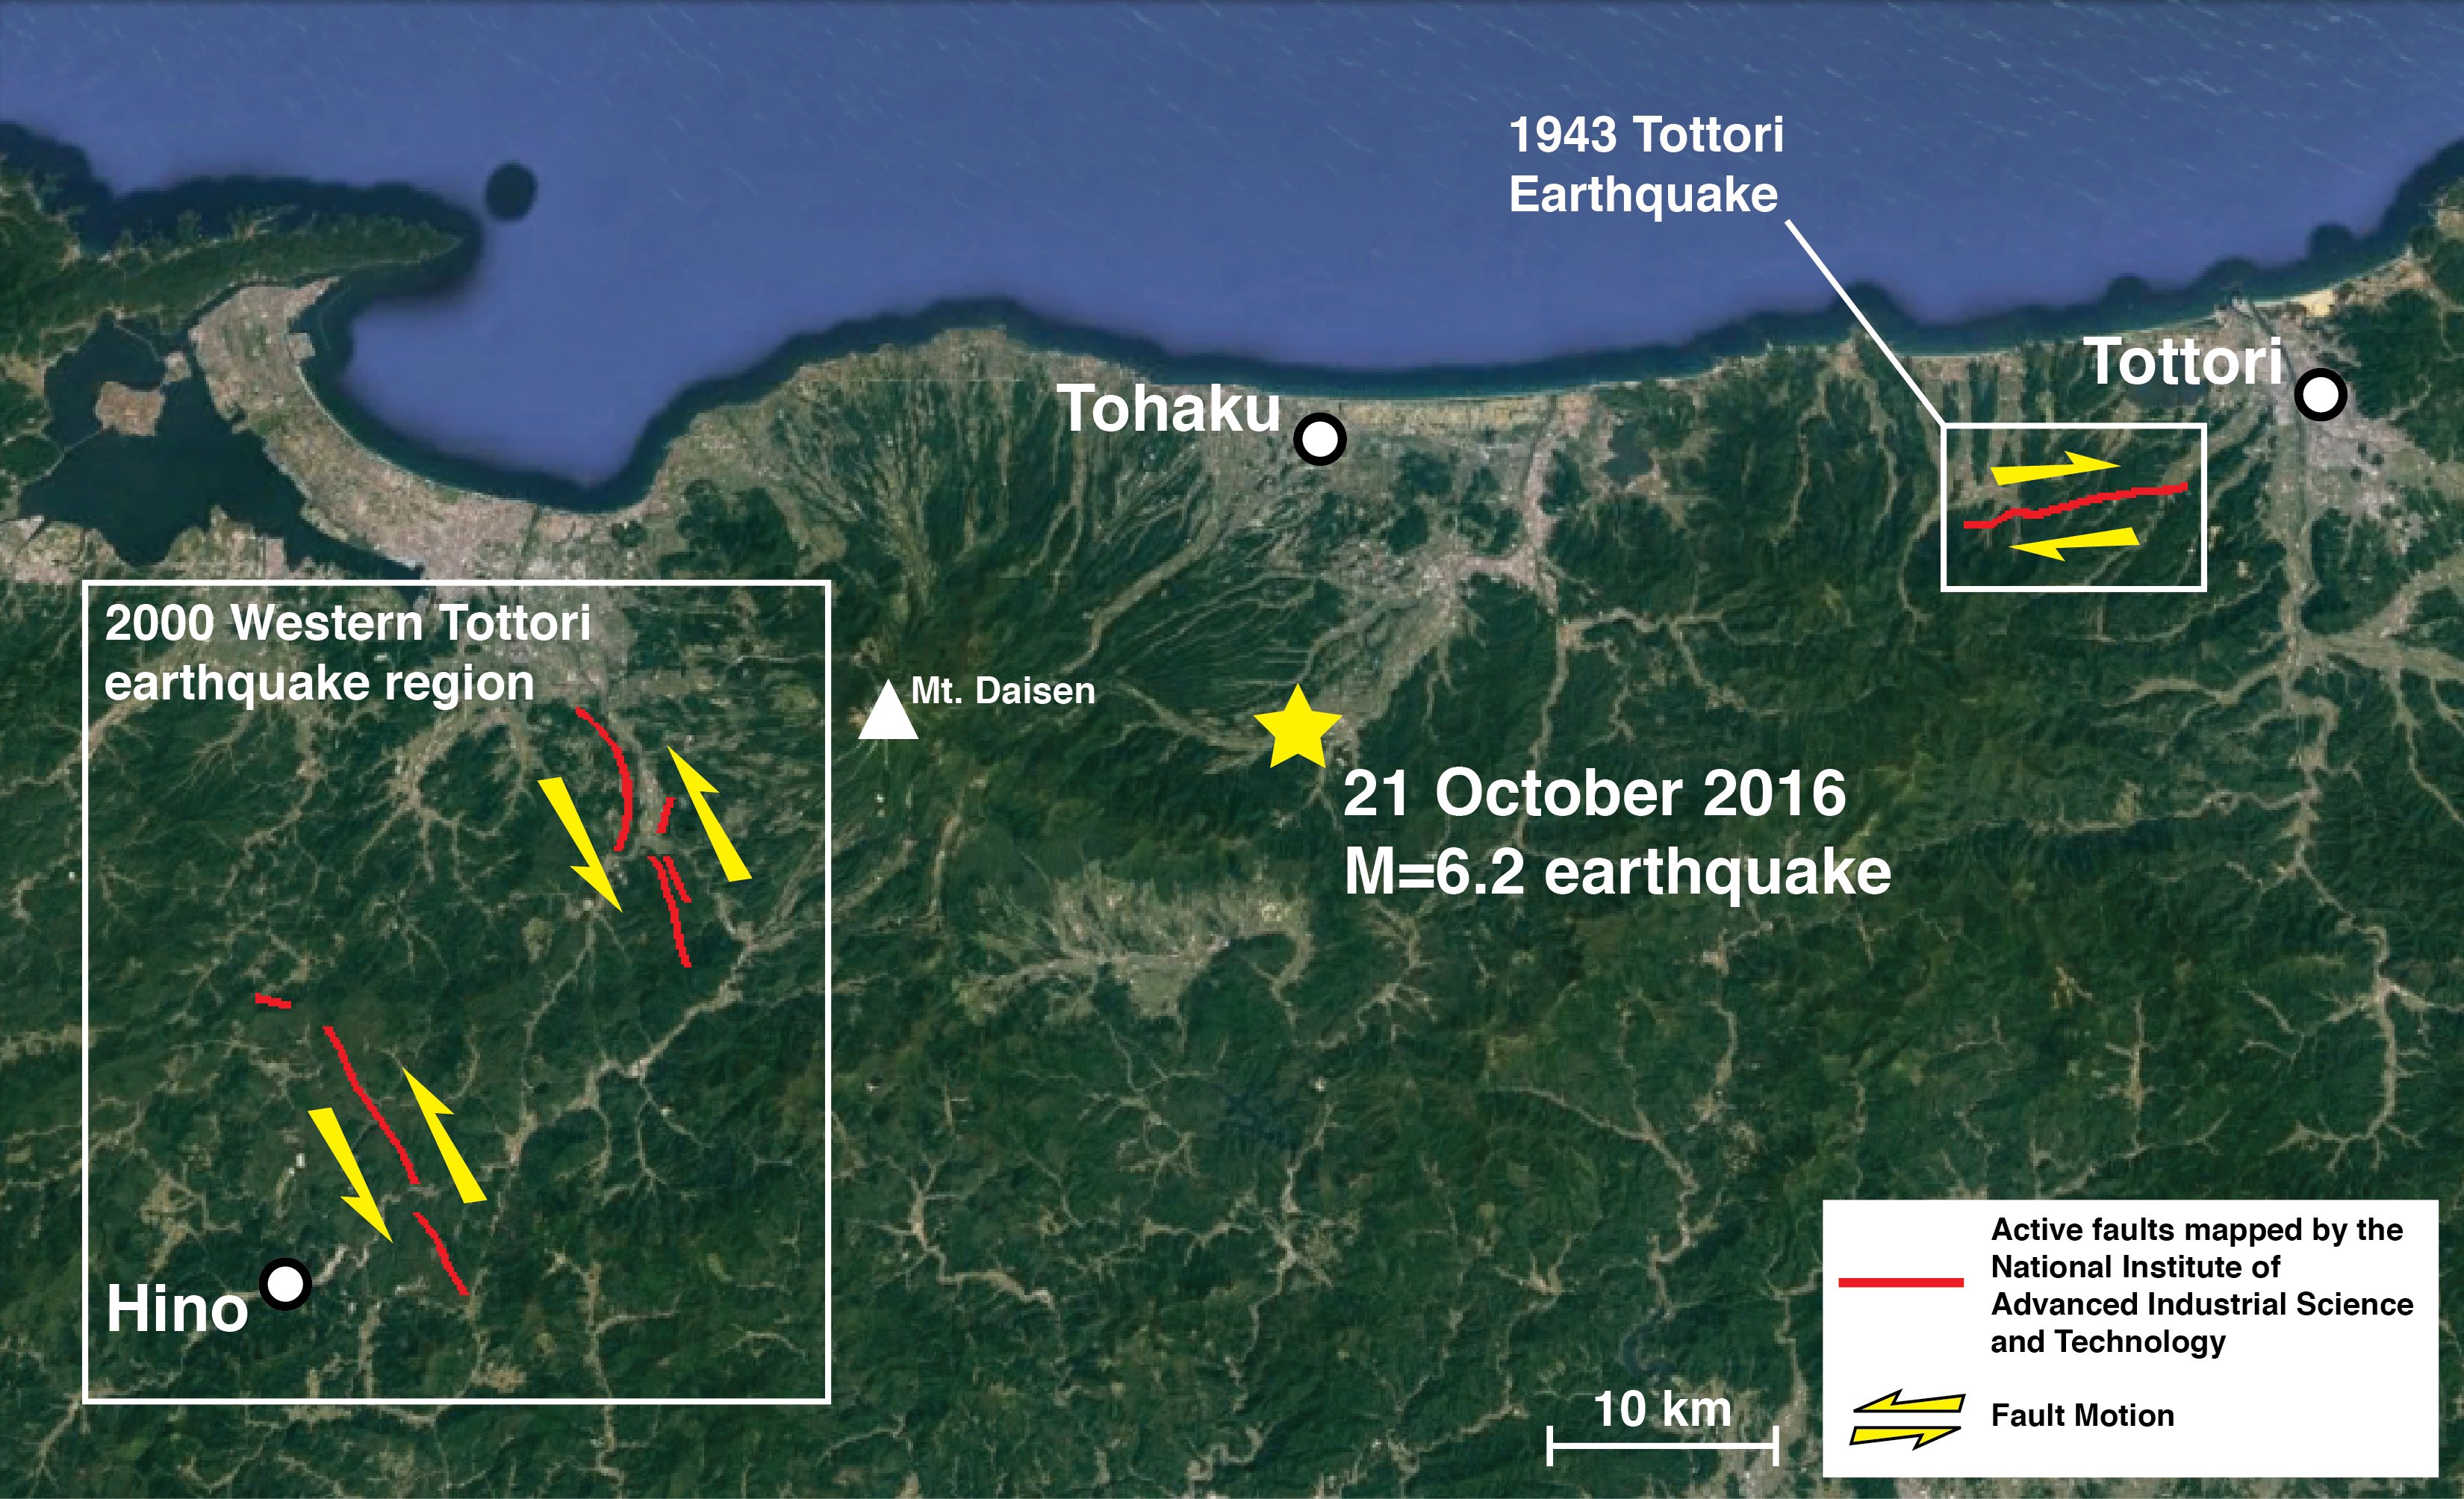
It is likely that both the 1943 and 2000 earthquakes contributed stress that brought the intervening faults, which ruptured today, closer to failure. However, at this point it is speculation as we know too little about the fault that just slipped. A 2011 study by Shinji Toda and Bogdan Enescu attempted to account for these stresses in an earthquake forecast for all of Japan. Focusing on the Tottori Prefecture, it is intriguing to see that the site of the 21 October 2016 shock lies in a zone of elevated (red) earthquake potential.

The Earthquake Forecast layer in Temblor, which is based on the Global Earthquake Activity Rate (GEAR) model of Bird et al. (2015), reveals that an earthquake of M~6.5 has an occurrence rate of about 1% per year, which translates to about 57% in a typical lifetime (the color band in which the quake fell is boxed in the legend in the map below). So this quake cannot be considered unexpected, and has a rate of about once a generation. So we all need to be ready for quakes like this one, too. Fortunately, no country is more prepared than Japan, an accomplishment the rest of us should envy and admire. Thus far, the damage does not appear to be widespread, a stark contrast to the heavy toll of the 24 August 2016 M=6.2 Amatrice, Italy, quake, an earthquake of the same size and depth.
This slowly-deforming part of Honshu along the Japan Sea coast, has experienced a half-dozen moderate to large earthquakes over the past 16 years. These are perhaps under-represented in the Japan national seismic hazard model (J-SHIS), as they all fall in areas with a chance of strong shaking less than below 1% in 30 years. Most of these shocks are nevertheless generally associated with isolated active faults and folds that have been mapped by Japanese geologists (Toda and Awata, 2007). While the GEAR model also forecasts smaller earthquakes on the Japan Sea side of Honshu, the difference is not nearly as pronounced as in the Japan National Hazard Model.

Sources:
Bird, P., D.D. Jackson, Y.Y. Kagan, C. Kreemer, and R.S. Stein (2015), GEAR1: A Global Earthquake Activity Rate Model Constructed from Geodetic Strain Rates and Smoothed Seismicity, Bull. Seismol. Soc. Amer., 105, 2538–2554, doi: 10.1785/0120150058.
Shinji Toda and Yasuo Awata (2008), Does the 2007 Noto Hanto earthquake reveal a weakness in the Japanese national seismic hazard map that could be remedied with geological data? Earth Planet Space, 60, 1047. doi:10.1186/BF03352867
Shinji Toda and Bogdan Enescu (2011), Rate/state Coulomb stress transfer model for the CSEP Japan seismicity forecast, Earth Planets Space, 63, 171–185.
- Earthquake science illuminates landslide behavior - June 13, 2025
- Destruction and Transformation: Lessons learned from the 2015 Gorkha, Nepal, earthquake - April 25, 2025
- Knock, knock, knocking on your door – the Julian earthquake in southern California issues reminder to be prepared - April 24, 2025