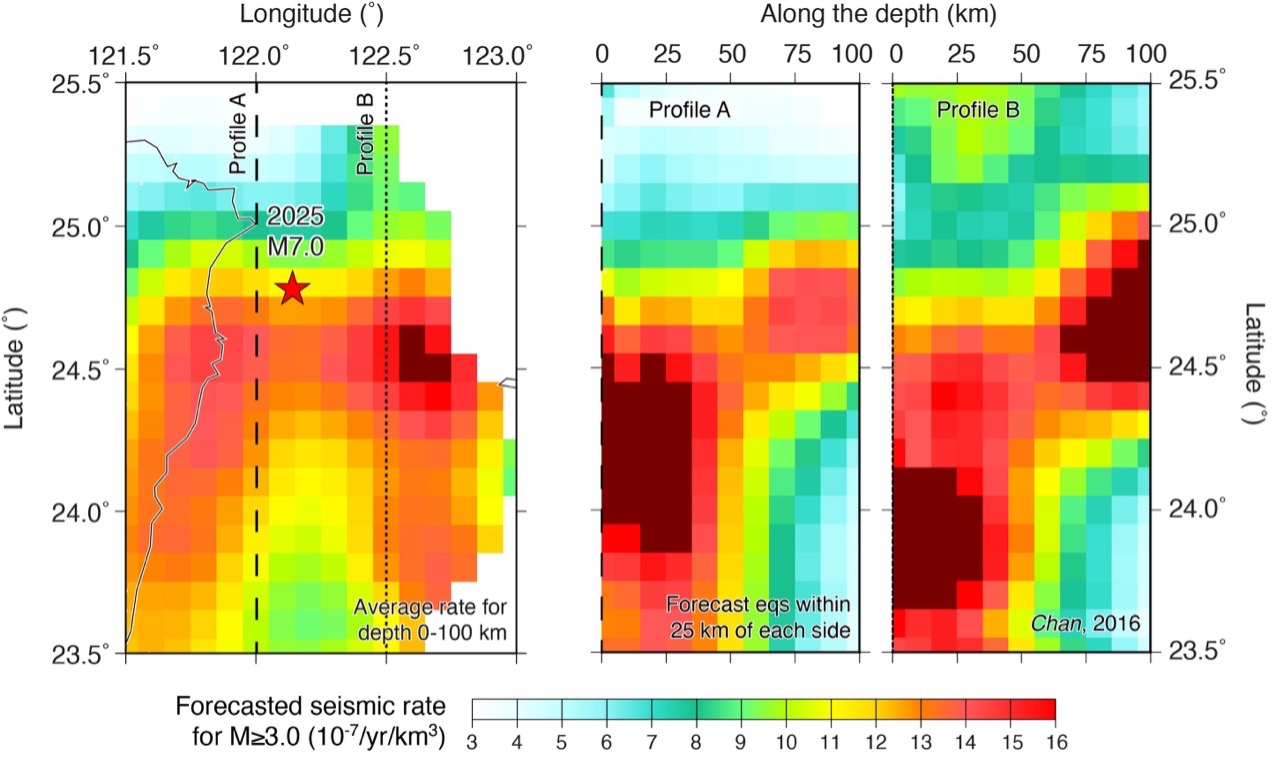
Figure 2. Spatial distribution of forecasted seismicity associated with the Ryukyu subduction system, based on the three-dimensional seismicity model of Chan (2016). Colors indicate the predicted annual occurrence rate of earthquakes with magnitude greater than or equal to 3 (events per km³ per year), integrated over depths from 0 to 100 kilometers. The star marks the epicenter of the 2025 magnitude 7.0 earthquake offshore eastern Taiwan. Vertical profiles (A and B) illustrate cross sections of seismicity along the subduction zone, highlighting concentrated seismic activity within the downgoing Philippine Sea Plate. The results emphasize that the 2025 event occurred within a region of persistently high seismic potential, consistent with long-term earthquake clustering along the Ryukyu subduction interface. Credit: Chan, 2026, CC BY-NC-ND 4.0
Latest posts by Rachel Crowell (see all)

