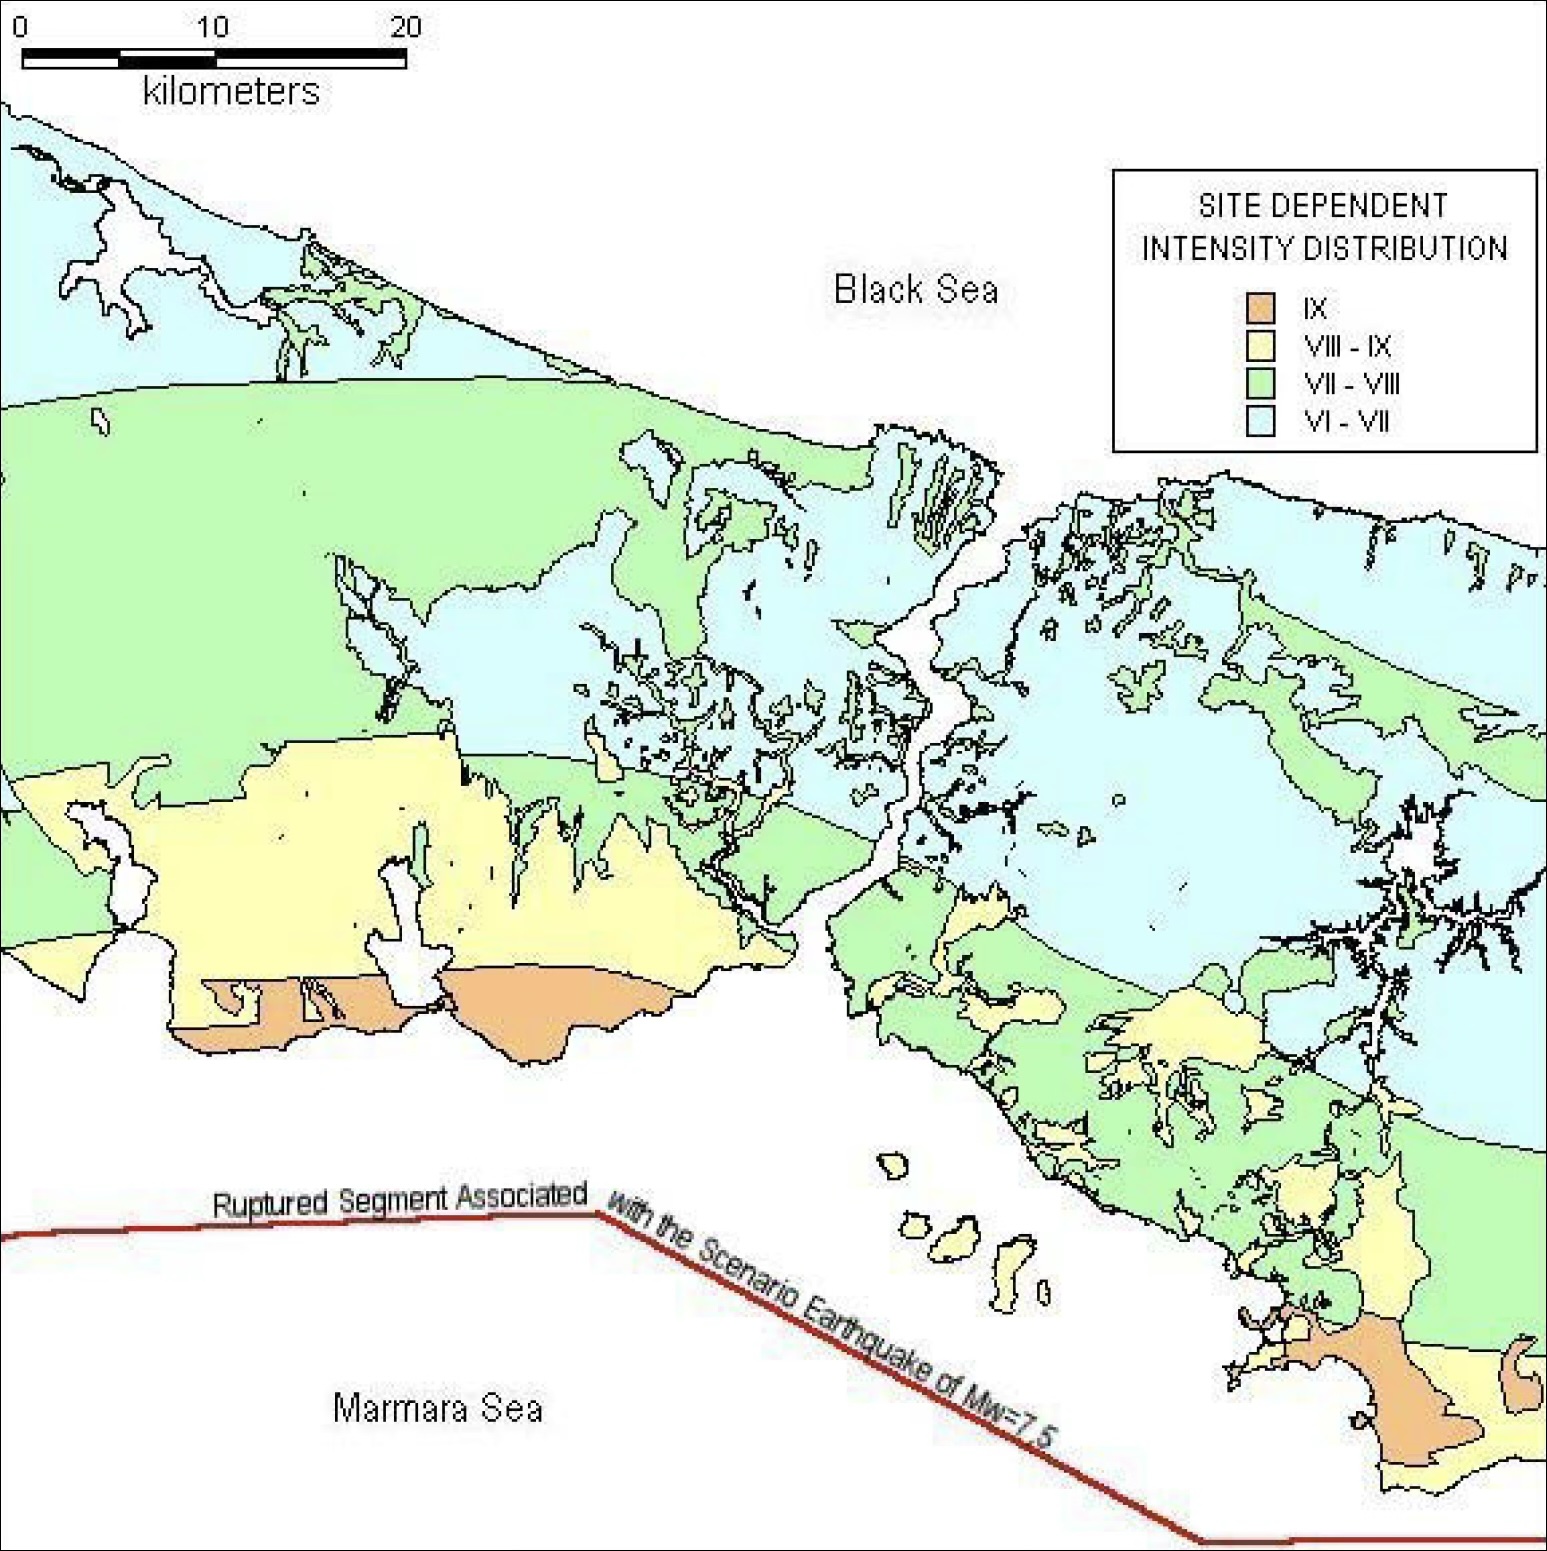
Figure 8. Site-specific intensity distribution that would be caused by a magnitude 7.5 earthquake. The red line represents the approximate trace of the Main Marmara Fault. Credit: IBB, 2009
Alka Tripathy-Lang is a freelance science writer based in Chandler, Arizona, and holds a Ph.D. in geoscience.
Latest posts by Alka Tripathy-Lang, Ph.D. (see all)
- Living through the Loma Prieta earthquake - October 21, 2021
- The Great Quake Debate: an interview with seismologist and author Susan Hough - August 27, 2020
- Salton Sea Swarm quiets down - August 12, 2020