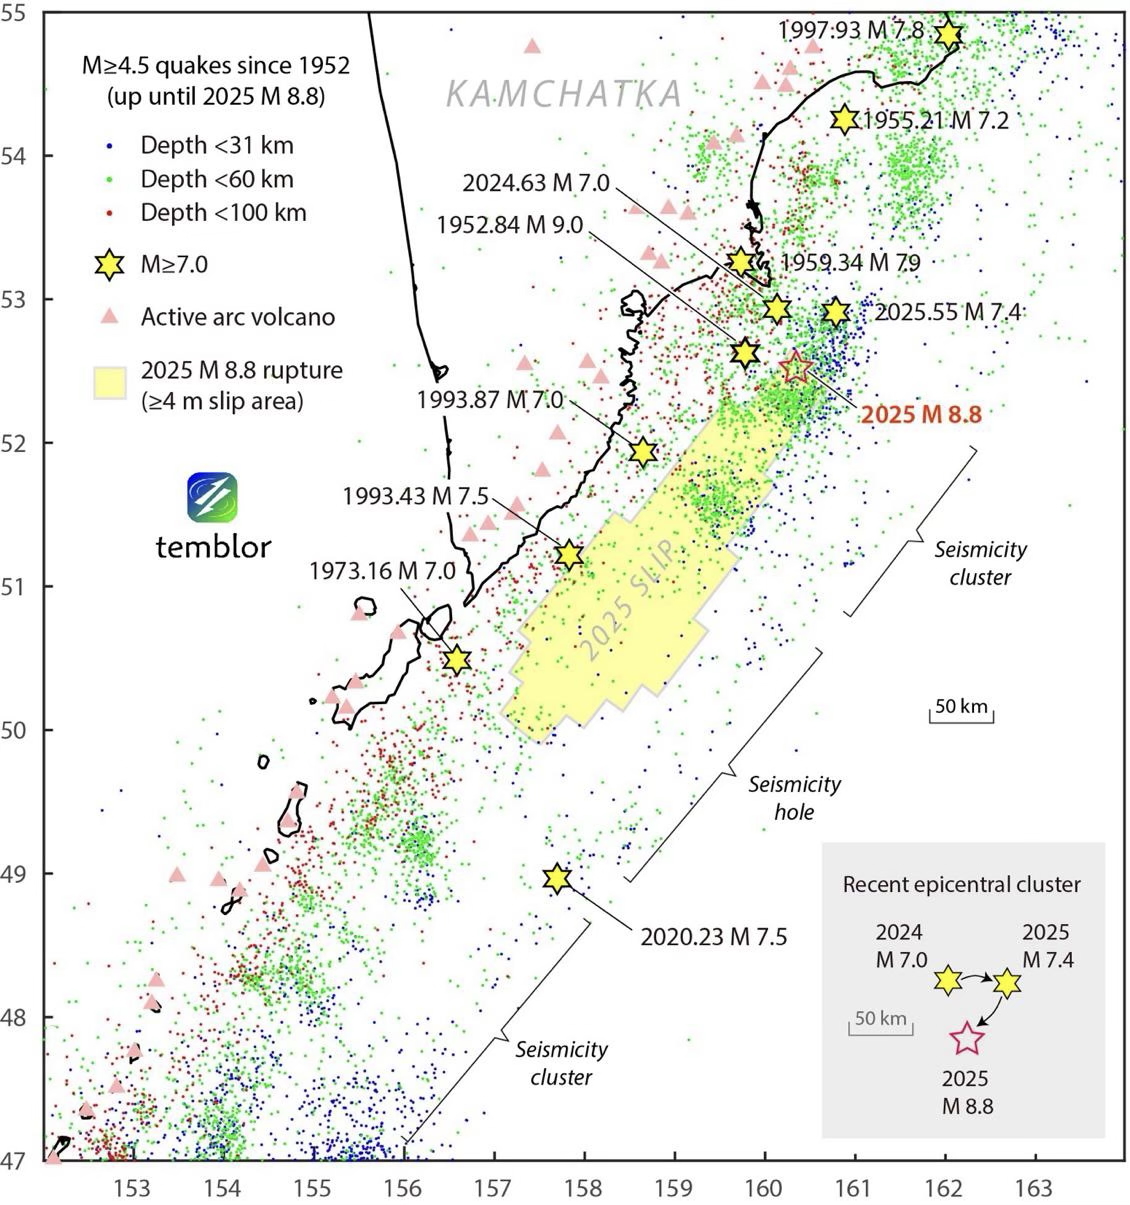
Figure 6. Seismicity spanning the time between the 1952 and 2025 earthquakes reveals clusters and holes, with the hole corresponding to the largest area of 2025 slip. The shocks greater than or equal to magnitude 7.0 appear to strike along the lower edge of the seismic portion of the interface, with a foreshock cluster concentrated near the epicenter of both magnitude 8.8 events. We use all shocks available from the ANSS catalog. Credit: Temblor, CC BY-NC-ND 4.0
Alka Tripathy-Lang is a freelance science writer based in Chandler, Arizona, and holds a Ph.D. in geoscience.
Latest posts by Alka Tripathy-Lang, Ph.D. (see all)
- Living through the Loma Prieta earthquake - October 21, 2021
- The Great Quake Debate: an interview with seismologist and author Susan Hough - August 27, 2020
- Salton Sea Swarm quiets down - August 12, 2020