Jason R. Patton, Ph.D., Ross Stein, Ph.D., Volkan Sevilgen, M.Sc.

Citation: Patton J.R., Stein R.S., Sevilgen V., 2019, Seismic swarm hits Hayward Fault: What does it portend?, Temblor, http://doi.org/10.32858/temblor.011
The San Francisco Bay area is earthquake country. Historic and prehistoric evidence for earthquakes here informs us about the possibility of future shakers. On the Hayward Fault, we have an idea about their upper limit on size, but we don’t know when they will occur. The swarm in progress, with an M=3.4 quake on January 16 and today’s M=3.5 quake near Piedmont and Berkeley, are but one way to peer into an uncertain future. Ultimately, they remind us to be prepared to confront potential disaster.
Earthquake swarm highlights our earthquake history and our earthquake future
People in northern California have been in the midst of an earthquake swarm along the Hayward fault. Over 6,000 people reported observations of an M=3.4 quake and so far, over 4,000 have reported to the USGS “Did You Feel It?” website for the M=3.5 morning quake today.
One may think that these quakes are small, so why do they matter? Why should I care?
Prior to the 1906 San Francisco earthquake, the 1868 event was called the Great San Francisco Earthquake as the damage was widespread across the entire region. According to the USGS, the Hayward fault has the highest chance of rupture for all faults in the bay area, which is why Temblor’s Earthquake Scores for homes near the fault are among the highest anywhere in the U.S.
The USGS, California Geological Survey, and other stakeholders like the California Earthquake Authority (earthquake insurance) have teamed up to help people learn about a probable repeat of the 1868 earthquake. Learn more about the “HayWired Scenario” on this website.
Below is a map that shows how the shaking intensity may be across the region in a scenario M=7 quake, similar to the 1868 event. (Hudnut et al., 2018).
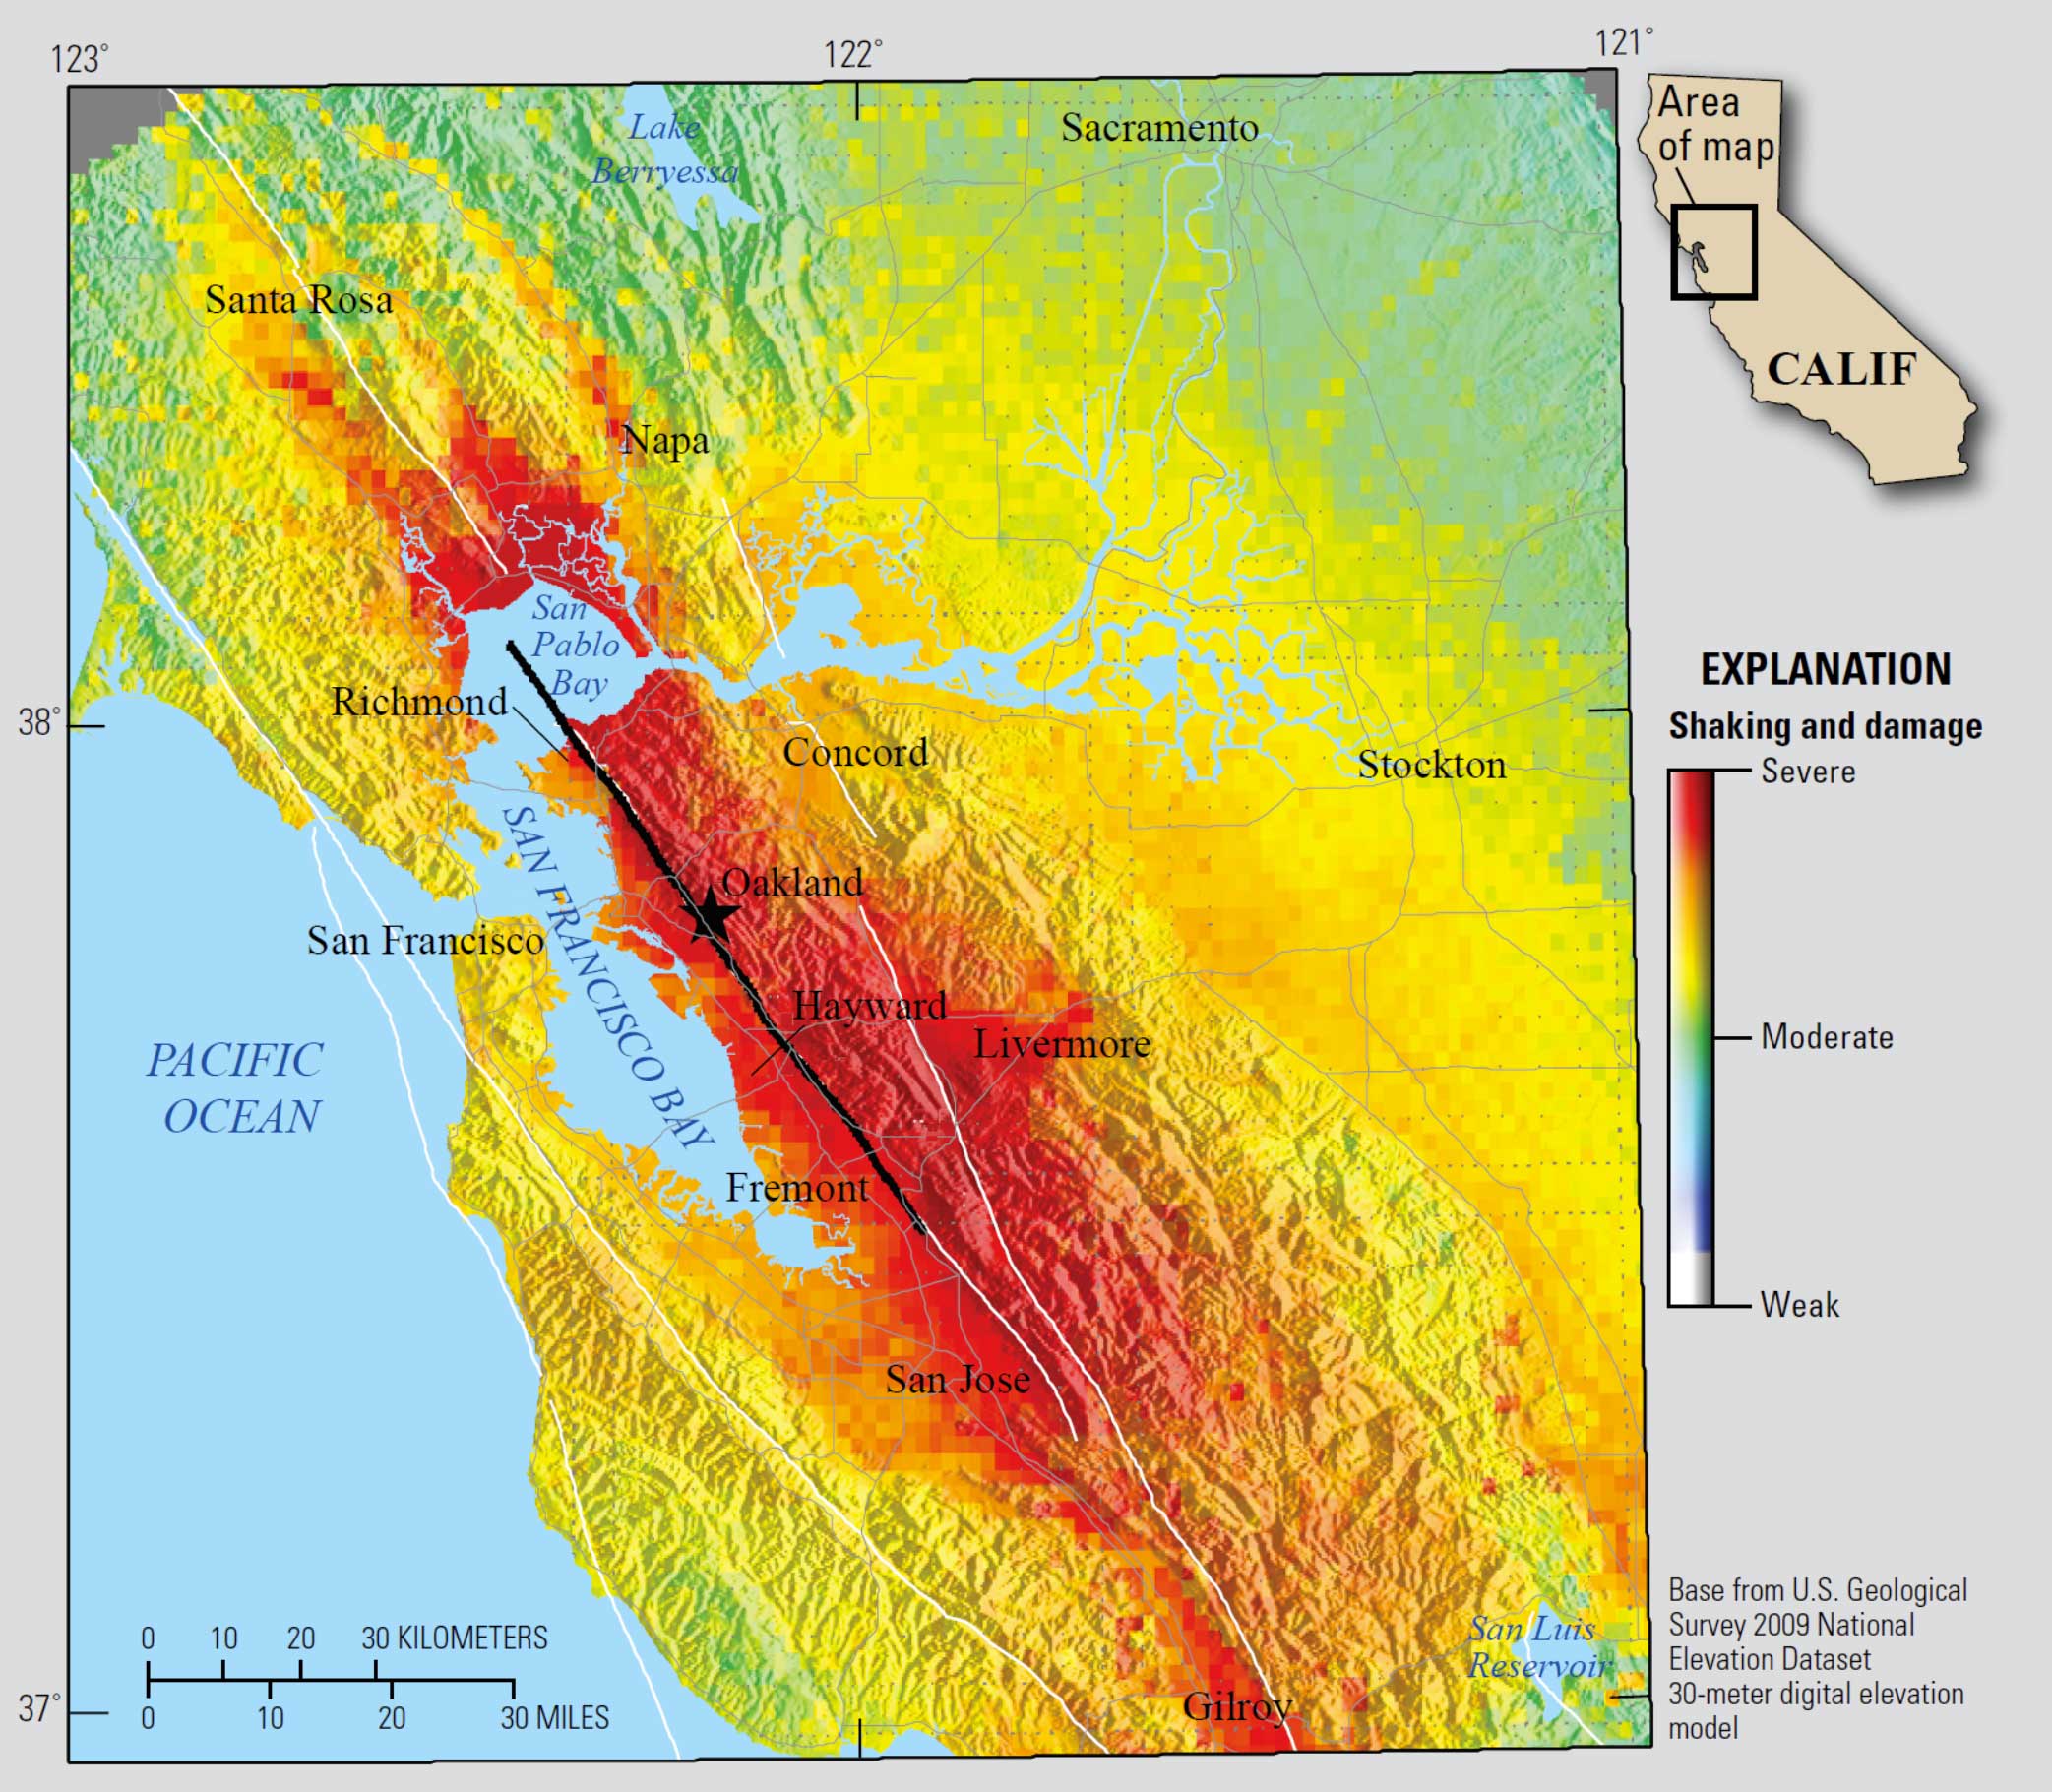
Shaking severity from an hypothetical earthquake on the Hayward fault.
Last year there was an M=4.4 earthquake in the Piedmont area, which is pretty close to the swarm of quakes that hit in the past 2 days, although unlike today’s quake, it was not on the main strand of the Hayward Fault. Along the Hayward fault, sometimes there is a series of earthquakes that all have similar magnitudes (a swarm) and sometimes there is an earthquake that is larger than the others (a sequence). According to Dr. Peggy Hellweg, Project Manager for the Berkeley Seismological Laboratory seismic network, “typically what we see on the Hayward fault are sequences” and that there is a sequence about every 2 to 5 years, over the past 20 years. Here is a blog post from the Berkeley Seismo Blog for a quake in 2017.
Sadly, the USGS cannot respond to press inquiries due to the U.S. Government shutdown. However, we can use the USGS earthquake catalog to learn about the recent history of earthquakes along the Hayward fault (see map below). Within 2 km (1.2 mi) of the fault trace, on average, there are M≥3.4 quakes a little less than once a year. Quakes right in the Hayward Fault trace are rarer, they strike about once every 3 years. One sees no obvious migration of these quakes with time, which makes it impossible to identify if the fault is getting ready for a “Big One.”
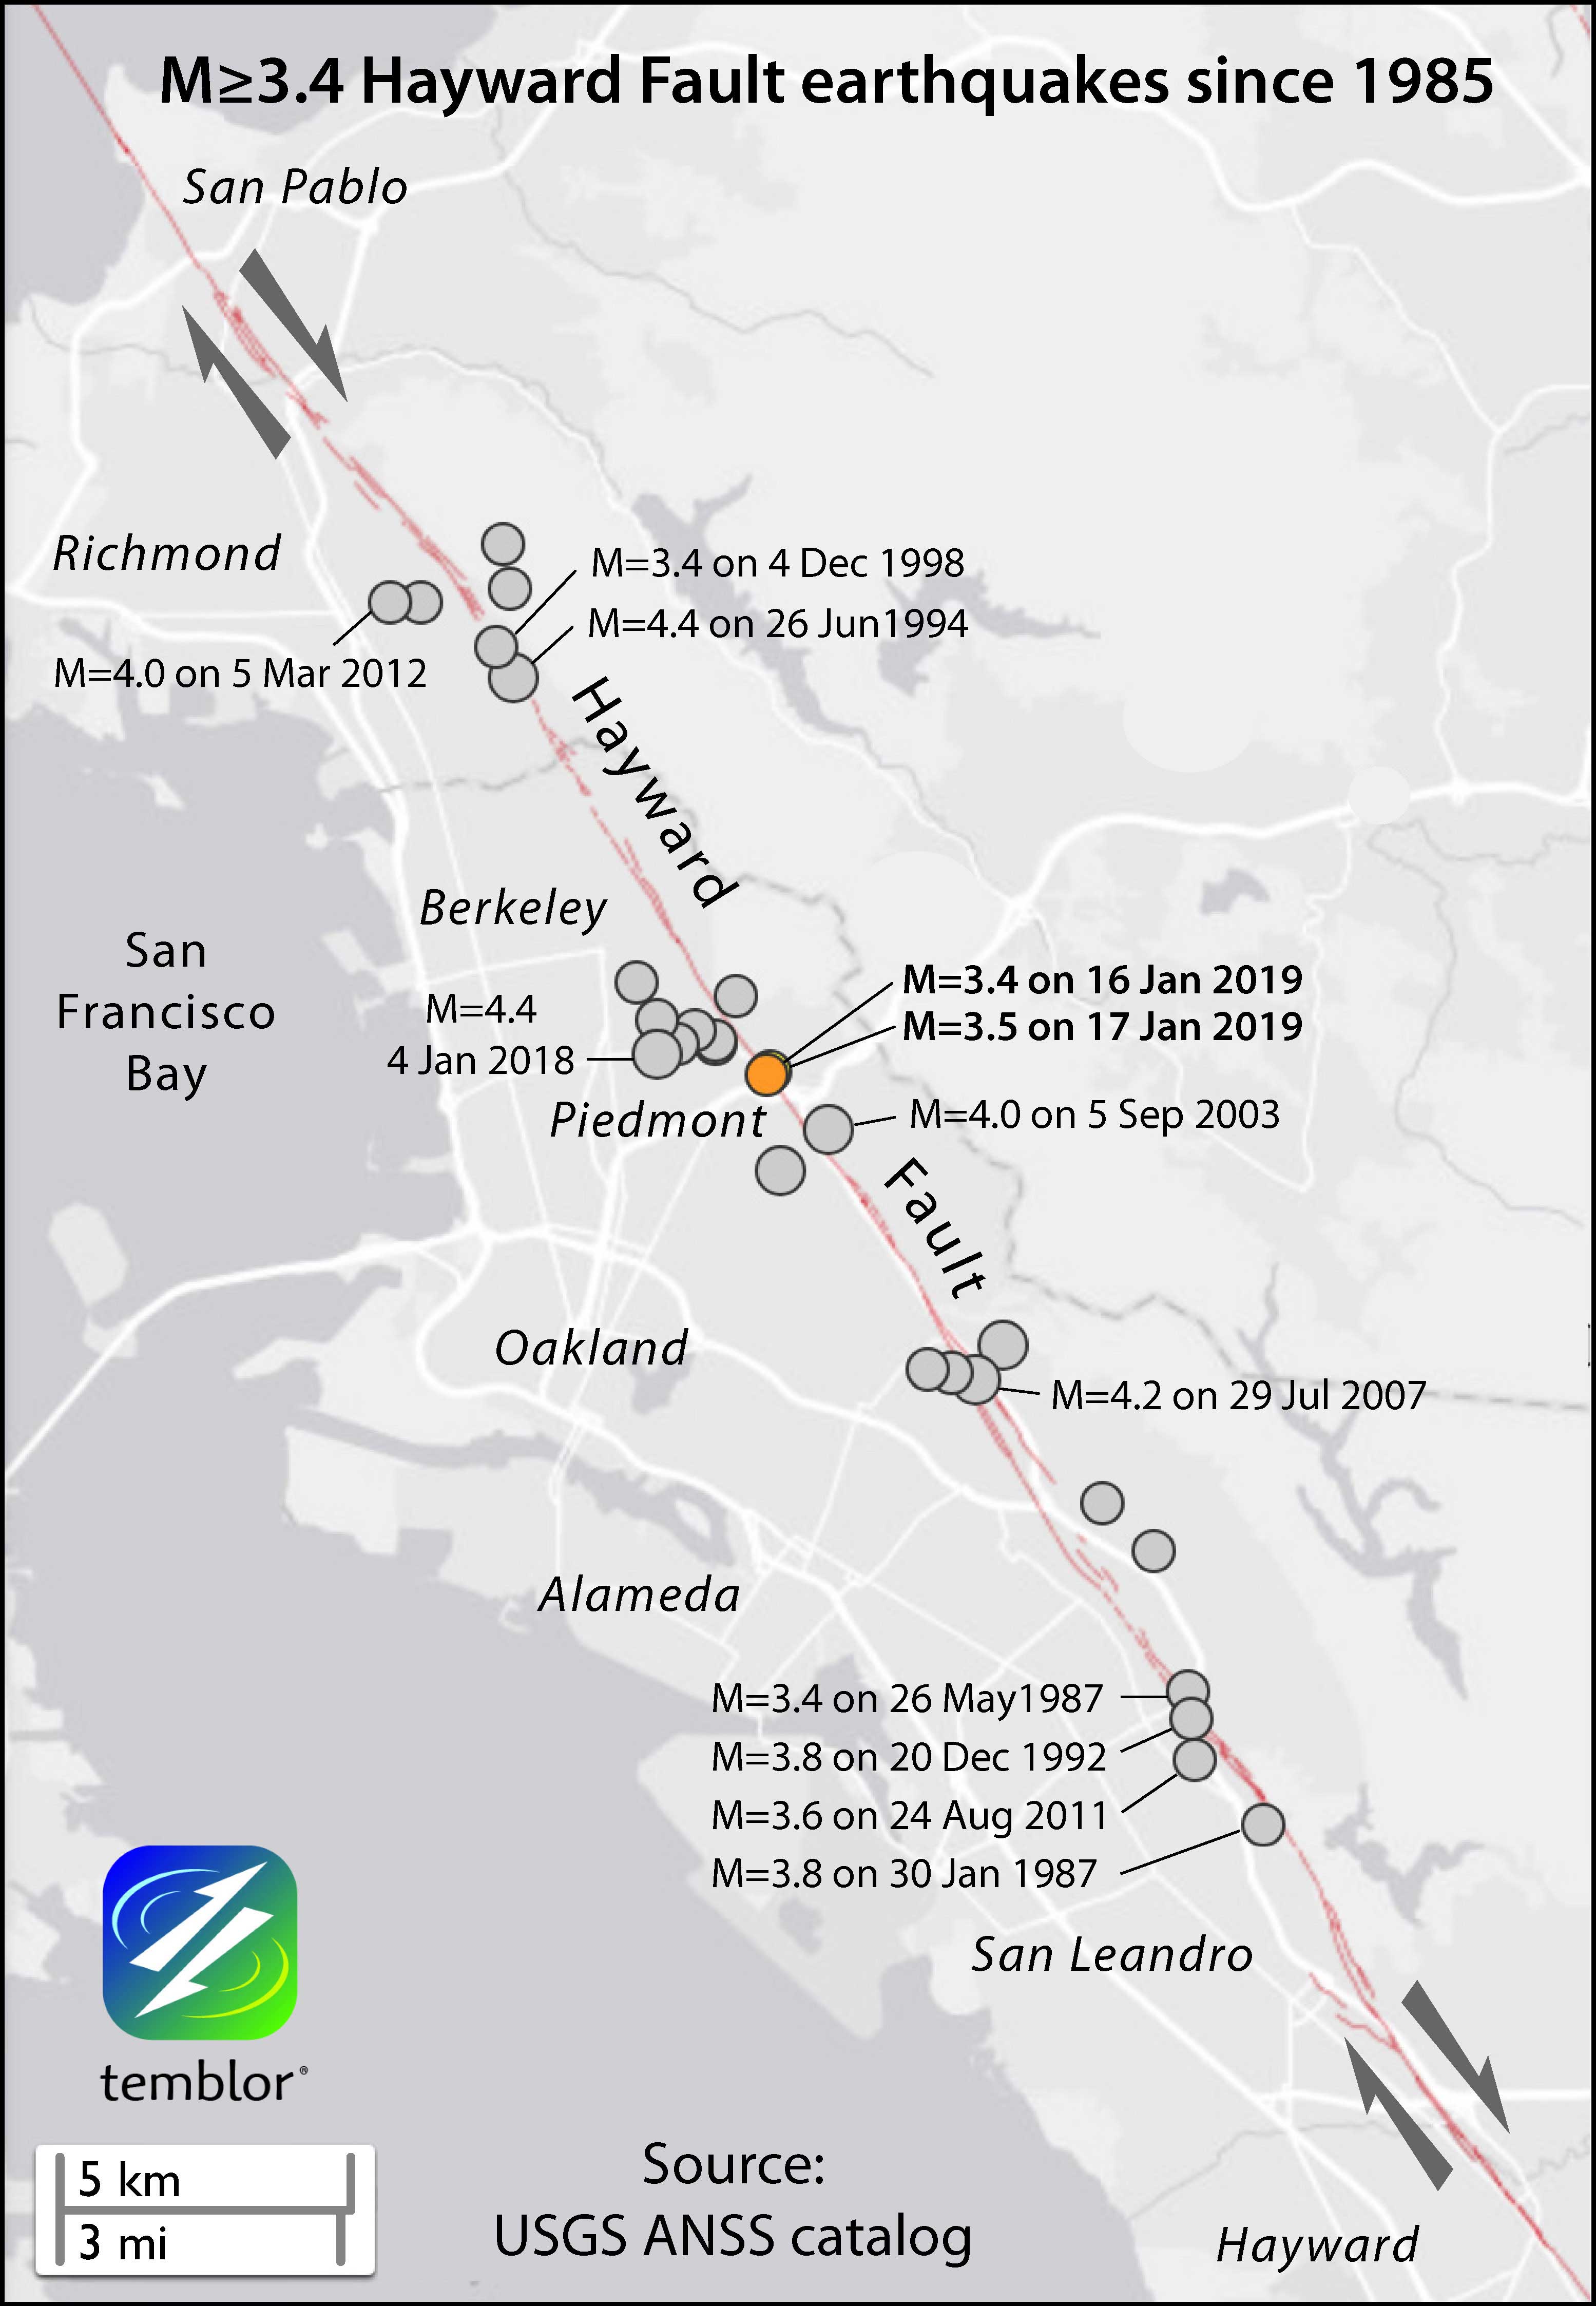
Hayward fault earthquake locations since 1985.
For now, we don’t’ know if this swarm will lead to larger magnitude earthquakes. However, we do know that as time passes, the fault gradually stores more elastic energy and this leads to an increased chance of an earthquake.
There is lots much we can learn about what happened in past earthquakes so we can prepare for future earthquakes. We recently reviewed what we learned over the past 25 since the 1994 M=6.7 Northridge earthquake here. Note the similar earthquake magnitude for the Hayward and Northridge earthquakes.
The Hayward Fault is HayWired
The Hayward Fault is unusual. Part of the Hayward fault is creeping aseismically (moving side by side without earthquakes) and part of the fault is locked (clamped together, storing energy that may be released during an earthquake). As the fault creeps, this places additional stress on the adjacent portions of the fault that are locked. The same is true for small earthquakes like the ongoing swarm, they add stress to the fault. A 100-km-long (60 mi) portion of the San Andreas also creeps, but the rest is locked. What makes the Hayward unique is that it exhibits both behaviors everywhere.
Scientists have been studying how the fault stores this energy over time (e.g. Shirzaei et al., 2013), using satellite data and physical measurements of plate motion in the region. Shirzaei et al. (2013) found that both creep and these small earthquakes add to the stress on the fault and bring us closer to an earthquake.
“We estimate that a slip-rate deficit equivalent to Mw 6.3–6.8 has accumulated on the fault, since the last event in 1868.” (Shirzaei and R. Bürgmann, 2013).
Below is an updated plot provided by Dr. Roland Bürgmann, Professor of Earth and Planetary Science at U.C. Berkeley. This figure shows the fault surface at depth and the color represents how much of the fault is creeping (red = more creep). Drs. Bürgmann and Shirzaei have plotted the earthquake locations from the past decade or so, including from the current swarm.
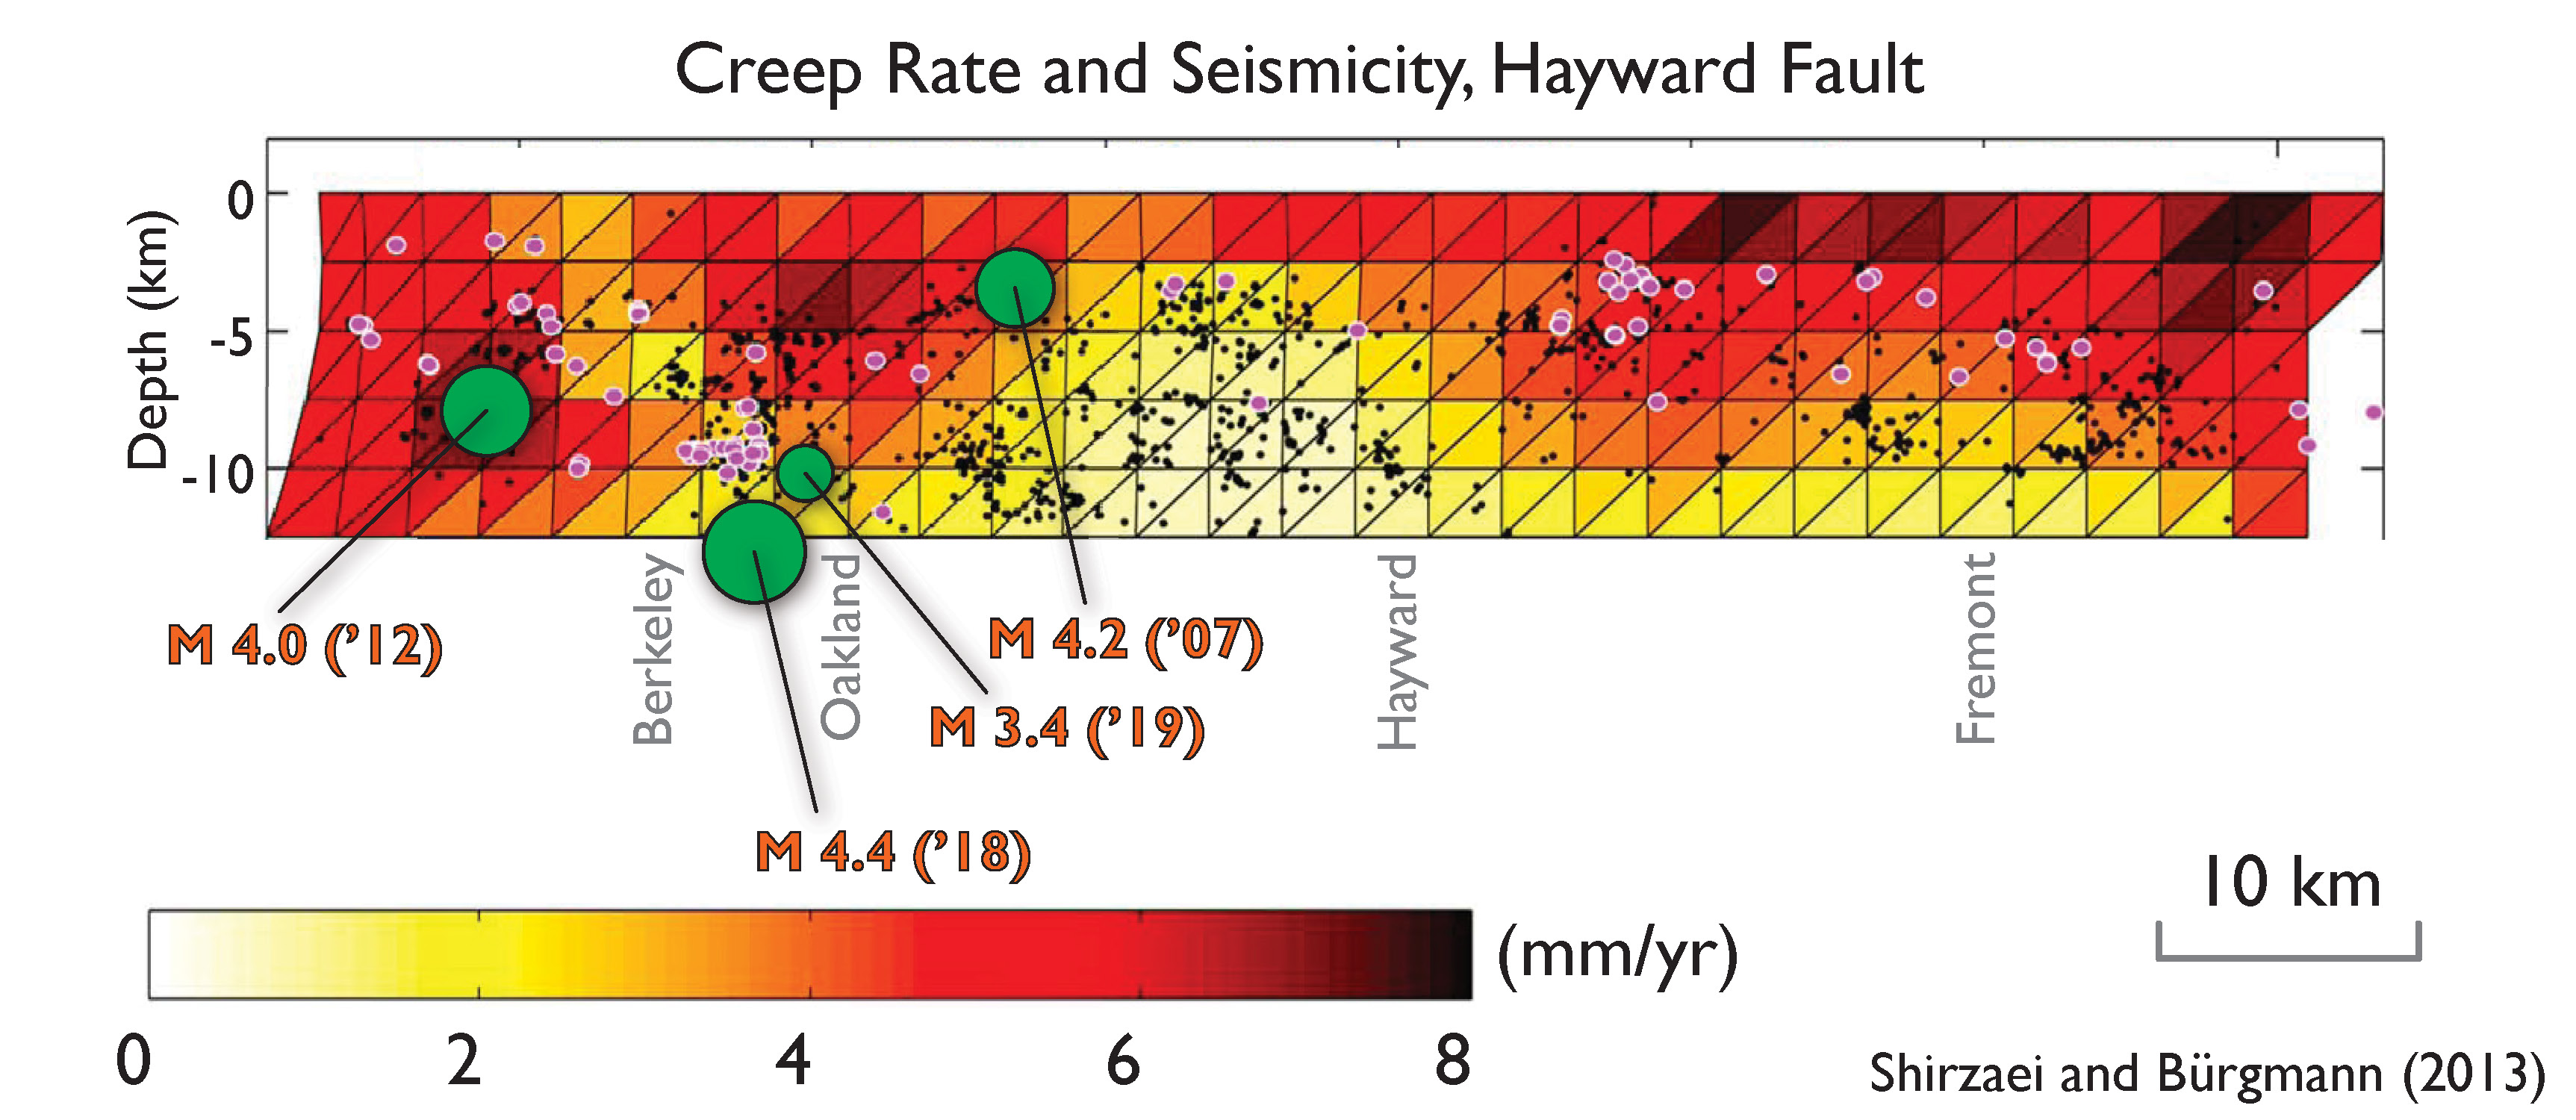
Creep rate for the Hayward fault. Dots are small earthquakes and magenta circles are locations of repeating earthquakes (read more about this figure in Shirzaei and R. Bürgmann (2013).
Dr. Bürgmann wrote us this morning, “I’d like to point out that it was last year’s M=4.4 quake that made me sign up for earthquake insurance.”
Ground Shaking, Building Collapse, Landslides, Liquefaction
This is a short laundry list of potential damage that will probably face northern California residents during and following a future Hayward fault earthquake.
Conclusions from the USGS HayWired Earthquake Scenario are sobering, however we can take action now to be more resilient in the face of this natural disaster.
The mainshock will be damaging, but so will be the aftershocks. Building damage may exceed $82 billion (in 2016 dollars). As many as 152,000 households may be displaced, placing as many as 411,000 people on the streets (2000 census data). There may be 800 deaths and over 18,000 injuries. As many as 2,500 people may be trapped in buildings and more than 22,000 people could be stuck in elevators.
As we mentioned in a report on the Sacramento-San Joaquin River Delta about potential levee failures, there may also be substantial damage to the water supply infrastructure as well. It may take as long as 30 to 210 days to restore water supplies for some of the counties in the bay area. Fires can be expected following a HayWired Scenario event. There may be over 400 fires, causing hundreds of additional deaths and contributing to an additional $30 billion in damages.
There is a suite of natural hazards information available on the temblor app to help one learn the extent to which people are exposed to these hazards. Below is a map that shows the potential for liquefaction in the region. Learn more about landslides and liquefaction in our report from earlier this year here.

Liquefaction susceptibility from earthquakes in the SF Bay Area. The red dot is the M=3.5 earthquake felt this morning.
Do you know where your home or workplace fits in earthquake country? Are you prepared? Check Your Risk in the Temblor app here
By offering specialty insurance products through an exclusive network of qualified agents, brokers, wholesalers and program administrators, Palomar Specialty ensures its policyholders receive knowledgeable service for their catastrophe exposures. Learn more here.
Citation: Patton J.R., Stein R.S., Sevilgen V., 2019, Seismic swarm hits Hayward Fault: What does it portend?, Temblor, http://doi.org/10.32858/temblor.011
References
Hudnut, K.W., Wein, A.M., Cox, D.A., Porter, K.A., Johnson, L.A., Perry, S.C., Bruce, J.L., and LaPointe, D., 2018, The HayWired earthquake scenario—We can outsmart disaster: U.S. Geological Survey Fact Sheet 2018–3016, 6 p., https://doi.org/10.3133/fs20183016.
Shirzaei, M., and Bürgmann, R., 2013. Time-dependent model of creep on the Hayward fault from joint inversion of 18 years of InSAR and surface creep data, J. Geophys. Res. Solid Earth, 118, http://dx.doi.org/10.1002/jgrb.50149.
Shirzaei, M., Bürgmann, R., and Taira, T., 2013. Implications of recent asperity failures and aseismic creep for time-dependent earthquake hazard on the Hayward fault in EPSL, v. 371-374, p. 599-66, http://dx.doi.org/10.1016/j.epsl.2013.04.024
- Osa Peninsula, Costa Rica: A unique opportunity to drill and instrumentthe seismogenic zone of large megathrust earthquakes - June 4, 2019
- Mexico-Guatemala earthquake, felt by millions, likely triggered by the 2017 megaquake - February 2, 2019
- Fuerte estremecimiento a partir de terremoto en la costa central de Chile: ¿Qué revela acerca del siguiente choque de megafalla? - January 23, 2019