Jason R. Patton, Ph.D., Ross Stein, Ph.D., Volkan Sevilgen, M.Sc.
Landslides during and following the M=7.5 earthquake in central Sulawesi, Indonesia possibly caused the majority of casualties from this catastrophic natural disaster. Volunteers (citizen scientists) have used satellite aerial imagery collected after the earthquake to document the spatial extent and magnitude of damage caused by the earthquake, landslides, and tsunami.
While remote sensing methods are useful to locate damage in the region, field observations will be key in the effort to analyze the landscape response to these natural disasters. The Indonesian government and international researchers are already surveying the region and collecting these important observational details.
Earthquake
The M=7.5 Donggala earthquake struck along the most active and seismically hazardous fault on the island of Sulawesi (Celebes), Indonesia. The Palu-Koro fault has a slip rate of 42 mm per year (Socquet et al., 2006), has a record of M=7-8 prehistoric earthquakes (Watkinson and Hall, 2017), as well as a record of M>7 earthquakes in the 20th century (Gómez et al., 2000). The seismic hazard associated with this fault was well evidenced prior to the earthquake (Cipta et al., 2016).
According to the National Disaster Management Authority (Badan Nasional Penanggulangan Bencana, BNPB), there were around 2.4 million people exposed to earthquake intensity MMI V or greater. The Modified Mercalli Intensity (MMI) scale is a measure of how strongly the ground shaking is from an earthquake. MMI V is described as, “Felt by nearly everyone; many awakened. Some dishes, windows broken. Unstable objects overturned. Pendulum clocks may stop.” However, the closer one is to the earthquake source, the greater the MMI intensity. There have been reported observations as large as MMI VIII.
Below is a graphical summary of the MMI scale. Larger roman numerals represent increasing severity of intensity. More descriptive explanations for these different levels of intensity can be found here.

Modified Mercalli Intensity Scale. Larger roman numerals represent greater intensity. “Shaking” is a description of how strong the shaking felt to people and “Damage” refers to how much damage may occur to buildings and infrastructure like roads. “Peak Acc” refers to a measure of how fast the ground moved, with units of percent g, (1 g = 32.2 feet per second2, the acceleration of gravity at sea level). For example, MMI V corresponds with 3.9-9.2% g. “Peak Vel” refers to the maximum speed that the ground moved during the earthquake, with units of centimeters per second.
Below is a map that shows the USGS estimate of ground shaking using the MMI scale. This is based on the updated slip model from the USGS. The updated model has been informed by post-earthquake observations of earthquake ground motion based on satellite imagery and satellite RADAR data.

Donggala earthquake shaking intensity map, using the Modified Mercalli Intensity scale. North is to the left. USGS M>1 seismicity from September 27 through October 4 is shown. Active faults from Watkinson and Hall (2017) are shown. Pantoloan Port (PP) and Mumuju (M) tide gage locations are shown.
There have been observations of tsunami waves recorded by tide gages installed at Pantoloan Port and Mumuju, Sulawesi. Locations are shown on the map above. A tsunami with a 10 cm wave height was recorded at Mumuju tide gage and a wave with a height of about 1.7 meters was recorded at Pantoloan tide gage. Learn more about the tsunami here. The first official report from the joint Indonesia and Japan tsunami expert team has been posted online here.
Based on post-earthquake satellite imagery from Digital Globe, the overwhelming majority of tsunami damage is localized within Palu Bay. The severity of damage is worse in southern Palu Bay where tsunami inundation is on the order of 1,000 feet, with damage greatest in the first 300 feet. While at the northern part of the bay, inundation is on the order of 50 feet. In the north, most of the buildings that were destroyed by the tsunami were built over the water, though not entirely. While in the south, building damage extends further inland where buildings have been destroyed that were not built over the water. North of the mouth of the bay, there is less evidence for tsunami inundation, but there is localized damage in places.
Coseismic Landslides
There are many different ways in which a landslide can be triggered. The first order relations behind slope failure (landslides) is that the “resisting” forces that are preventing slope failure (e.g. the strength of the bedrock or soil) are overcome by the “driving” forces that are pushing this land downwards (e.g. gravity). The ratio of resisting forces to driving forces is called the Factor of Safety (FOS). We can write this ratio like this:
FOS = Resisting Force / Driving Force
When FOS > 1, the slope is stable and when FOS < 1, the slope fails and we get a landslide. The illustration below shows these relations. Note how the slope angle α can take part in this ratio (the steeper the slope, the greater impact of the mass of the slope can contribute to driving forces). The real world is more complicated than the simplified illustration below.

Landslide force balance diagram showing how driving and resisting forces balance for a stable slope.
Landslide ground shaking can change the Factor of Safety in several ways that might increase the driving force or decrease the resisting force. Keefer (1984) studied a global data set of earthquake triggered landslides and found that larger earthquakes trigger larger and more numerous landslides across a larger area than do smaller earthquakes. Earthquakes can cause landslides because the seismic waves can cause the driving force to increase (the earthquake motions can “push” the land downwards), leading to a landslide. In addition, ground shaking can change the strength of these earth materials (a form of resisting force) with a process called liquefaction.
Sediment or soil strength is based upon the ability for sediment particles to push against each other without moving. This is a combination of friction and the forces exerted between these particles. This is loosely what we call the “angle of internal friction.” Liquefaction is a process by which pore pressure increases cause water to push out against the sediment particles so that they are no longer touching.
An analogy that some may be familiar with relates to a visit to the beach. When one is walking on the wet sand near the shoreline, the sand may hold the weight of our body generally pretty well. However, if we stop and vibrate our feet back and forth, this causes pore pressure to increase and we sink into the sand as the sand liquefies. Or, at least our feet sink into the sand.
Below is a diagram showing how an increase in pore pressure can push against the sediment particles so that they are not touching any more. This allows the particles to move around and this is why our feet sink in the sand in the analogy above. This is also what changes the strength of earth materials such that a landslide can be triggered.

Under normal conditions, the pore space is filled with water but sediment particles are touching each other. When pore pressure increases, the particles are no longer touching each other. The process of liquefaction can help sand behave like a fluid, becoming weaker.
Below is a diagram based upon a publication designed to educate the public about landslides and the processes that trigger them (USGS, 2004). Additional background information about landslide types can be found in Highland et al. (2008). There was a variety of landslide types that can be observed surrounding the earthquake region. So, this illustration can help people when they observing the landscape response to the earthquake whether they are using aerial imagery, photos in newspaper or website articles, or videos on social media. Will you be able to locate a landslide scarp or the toe of a landslide? This figure shows a rotational landslide, one where the land rotates along a curvilinear failure surface.

The geography of a landslide showing how gravity moves material from upslope on the right, downslope to the left. As the main body slides down the surface of rupture, the materials are deformed and break up causing cracks and ridges. The vertical cliff shaped features are called scarps. The upper part of the slope is the head and the lower parts are the foot and the toe.
A lateral spread is a translational landslide that occurs over gentle slopes or flat terrain. The failure surface is more planar and less curvy than for rotational slides. The spread is usually caused when a confined layer of sediment is transformed from a solid into a liquid state. In the lateral spread figure below, it is the water that exists in the “silt and sand” deposits that has an increase in pore pressure to generate liquefaction, causing the failure. The overlying sediment is more cohesive, which is why we may have seen landslides move as coherent blocks across the landscape. However, these landslide blocks may disaggregate as they move, sometimes turning into a flow. This entire range of behavior can be seen in the post-earthquake aerial imagery of Palu Valley.
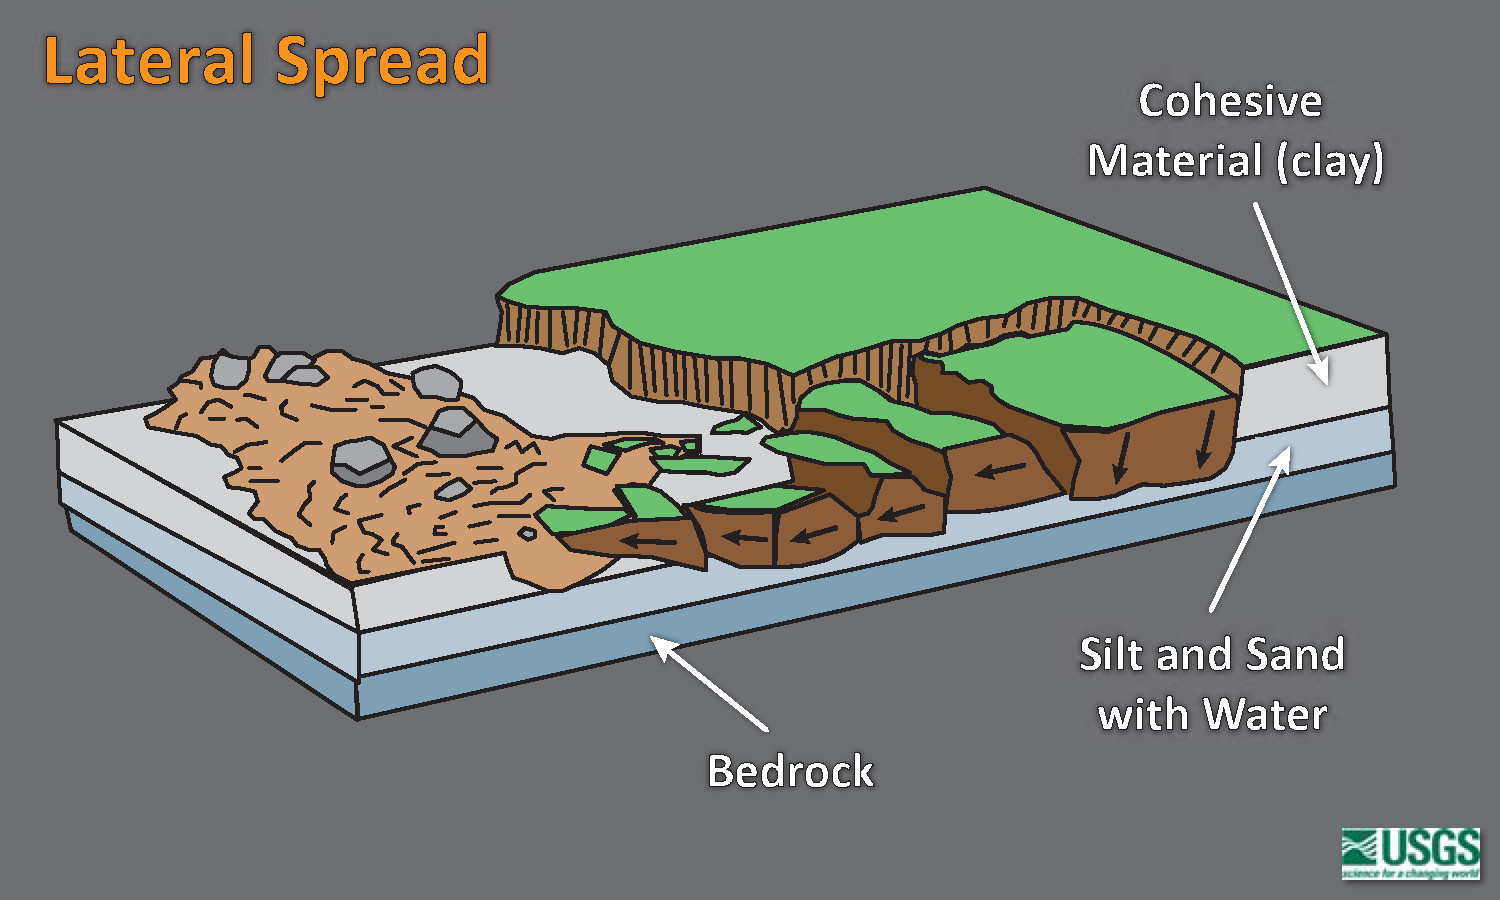
A lateral spread is shown as the landslide fails from the right to the left. The uppermost materials are more cohesive. The materials underlying the clay is silt and sand with open spaces (pores) where water can be contained.
Here is an excellent educational video from IRIS and a variety of organizations. The video helps us learn about how earthquake intensity gets smaller with distance from an earthquake. The concept of liquefaction is reviewed and we learn how different types of bedrock and underlying earth materials can affect the severity of ground shaking in a given location. The intensity map above is based on a model that relates intensity with distance to the earthquake, but does not incorporate changes in material properties as the video below mentions is an important factor that can increase intensity in places.
If we look at the map at the top of this report, we might imagine that because the areas close to the fault shake more strongly, there may be more landslides in those areas. This is probably true at first order, but the variation in material properties and water content also control where landslides might occur.
Landslide Observations
There has been a large amount of videos posted online via social media and professional news organizations showing the impact of these landslides. Perhaps one of the best places to seek an expert informed view of landslide processes, of all types, is from Dr. David Petley and his blog, The Landslide Blog. Petley has presented a couple summaries of these observations of coseismic (during the earthquake) landslides as triggered by ground shaking from the M=7.5 Donggala earthquake.
The company Digital Globe provides high resolution satellite imagery for a fee, but they distribute imagery for free via their open data program following natural disasters. This imagery is available for noncommercial use including disaster impact analysis. Many of the preliminary analyses of impact presented on social media by subject matter experts has been based upon this imagery. Another source of fee based imagery is from Planet Lab that also provides imagery in support of peoples’ response to natural disasters via their disaster data program.
Below is a map that shows the Temblor STAMP forecast for liquefaction. Color represents how the seismic velocity varies spatially. Soil and sediment have lower velocities than bedrock. Remember the video above and how sediment and wet soil can amplify the energy in seismic waves. So, not only is sediment and water saturated sediment weaker than bedrock, the amplified ground motions can increase the chance for landslides and liquefaction.
The map shows how the areas close to the coast have soils that are less strong. This is evidenced in how the seismic velocity is slower in the soil and sediment in those locations. The before and after photos show an area of a mile-scale landslide. Reports state that over a thousand buildings were located where this landslide is. Here is a computer animation that combines these pre- and post-earthquake images to create a visualization that may show how the landslide progressed.
Based solely on video posted on social media and views from air photos shown here, this landslide started out as a lateral spread and transformed into an earthflow and later a debris flow. Sediment from this landslide transported about 4 miles and entered the Palu River. Post-earthquake air photos show a large sediment plume emanating from the mouth of Palu River. This plume is probable evidence for the sediment from these landslides (buy may also include some sediment from the tsunami).
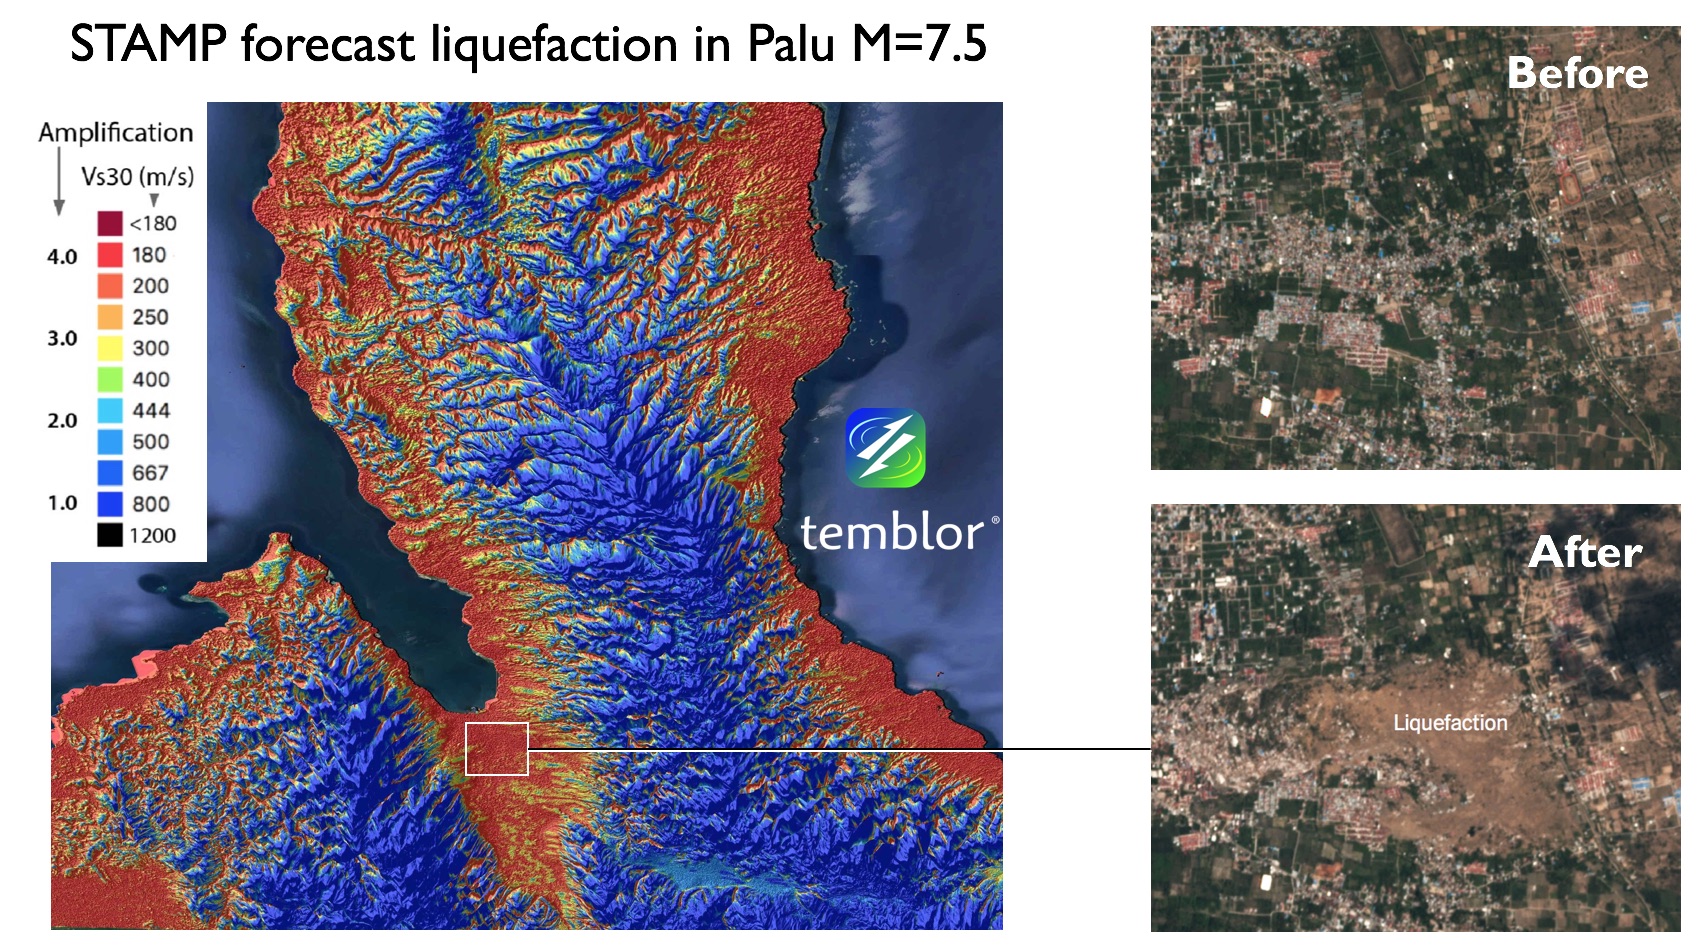
The map shows how Vs30 varies across the landscape. Pre and post-earthquake satellite imagery is compared for the area in the white box on the left. The area that experienced a lateral slide is labeled “Liquefaction” in white.
Most of the entire Palu Valley has previously been mapped as susceptible to liquefaction due to (1) the underlying materials are sediments and (2) a shallow ground water table (lots of water in the sediment, reaching close to the ground surface). The northern part of the valley is a river delta full of loose and water saturated sediments. Yet, only a small portion of the entire valley failed as these km scale lateral spreads.
Why is this? This is probably due to a combination of factors, but the biggest factor may be the heterogeneity of the underlying earth materials. These sediments probably have variation in material properties: strength (“angle of internal friction“), stickiness (“cohesion“), and porosity (spaces between sediment particles that can be filled with water).
It is also possible that the earthquake intensity (ground shaking and seismic wave energy), that was directed in different directions, may have caused different amounts of “seismic loading” of these slopes.
Knowing how these material properties vary spatially is difficult to know as the materials in the subsurface are generally not in plain view (buried under ground). People can drill and sample the material properties (an engineering geologist) and then calculate the strength of these materials (engineer) on a site by site basis.
If in doubt about the possibility of landsliding at your place of residence or occupation, consult a licensed geotechnical engineer. Learn more about your exposure to earthquake, landslide, and liquefaction hazards here at Temblor.net.
Until these landslides are analyzed and compared with regions that did not fail in slope failure, we will not be able to reconstruct what happened… why some areas failed and some did not.
Take Away
Long story long, yes, mitigating the impact of these landslides is complicated, difficult, and expensive (especially in a place where there is little money to do this type of mitigation). One way to mitigate is to have people reside in the hillslopes surrounding the valley, where the underlying bedrock is stronger. It does not appear that there are many landslides in the hills, but there are some (see Dr. Petley’s blog for an example of a landslide on the hillslope). This is a complicated socioeconomic and public policy issue. But the key to becoming more resilient to natural disaster is to learn about the processes that could potentially lead to disaster and consulting with experts to mitigate that risk of disaster.
References
Cipta, A., Robiana, R., Griffin, J.D., Horspool, N., Hidayati, S., and Cummins, P., 2016. A probabilistic seismic hazard assessment for Sulawesi, Indonesia in Cummins, P. R. &Meilano, I. (eds) Geohazards in Indonesia: Earth Science for Disaster Risk Reduction, Geological Society, London, Special Publications, v. 441, http://doi.org/10.1144/SP441.6
Gómez, J.M., Madariaga, R., Walpersdorf, A., and Chalard, E., 2000. The 1996 Earthquakes in Sulawesi, Indonesia in BSSA, v. 90, no. 3, p. 739-751
Highland, L.M., and Bobrowsky, P., 2008. The landslide handbook—A guide to understanding landslides, Reston, Virginia, U.S. Geological Survey Circular 1325, 129 p.
Keefer, D.K., 1984. Landslides Caused by Earthquakes in GSA Bulletin, v. 95, p. 406-421
Socquet, A., Simons, W., Vigny, C., McCaffrey, R., Subarya, C., Sarsito, D., Ambrosius, B., and Spakman, W., 2006. Microblock rotations and fault coupling in SE Asia triple junction (Sulawesi, Indonesia) from GPS and earthquake slip vector data, J. Geophys. Res., 111, B08409, doi:10.1029/2005JB003963.
USGS, 2004. Landslide Types and Processes, U.S. Geological Survey Fact Sheet 2004-3072
Watkinson, I.M. and Hall, R., 2017. Fault systems of the eastern Indonesian triple junction: evaluation of Quaternary activity and implications for seismic hazards in Cummins, P. R. & Meilano, I. (eds) Geohazards in Indonesia: Earth Science for Disaster Risk Reduction, Geological Society, London, Special Publications, v. 441, https://doi.org/10.1144/SP441.8
More can be found about the landslide observations and the USGS landslide/liquefaction modeling here.
Temblor Reports for the Donggala Earthquake, Tsunami, and Landslides
Sept. 28, 2018 – The Palu-Koro fault ruptures in a M=7.5 quake in Sulawesi, Indonesia, triggering a tsunami and likely more shocks
Oct. 3, 2018 – Tsunami in Sulawesi, Indonesia, triggered by earthquake, landslide, or both
Glossary
Landslides
Angle of internal friction (friction angle) is a measure of the ability bedrock or soil to withstand a shear stress.
Cohesion is a measure of how sticky sediment or soil is. Materials with more cohesion tend to be held together better.
Pores are the open spaces within bedrock or between particles in sediments.
Porosity is the amount (percent) of open space (called pores) between particles or within bedrock.
Permeability is a measure of the ability of fluid to flow through a material.
Pore pressure is the pressure within a fluid that exists when the fluid is contained within bedrock or sedimentary pores.
Tsunami
Inundation refers to the horizontal extent of coastal flooding due to tsunami.
Run-up height or elevation is the vertical elevation of the most landward penetration of the tsunami wave with respect to the initial sea level. Run-up is a vertical distance, while inundation is a horizontal distance.
Wave height is approximately the maximum height of the wave above sea level. Note that this is not the vertical distance between the crest and the trough.
- Osa Peninsula, Costa Rica: A unique opportunity to drill and instrumentthe seismogenic zone of large megathrust earthquakes - June 4, 2019
- Mexico-Guatemala earthquake, felt by millions, likely triggered by the 2017 megaquake - February 2, 2019
- Fuerte estremecimiento a partir de terremoto en la costa central de Chile: ¿Qué revela acerca del siguiente choque de megafalla? - January 23, 2019