An October magnitude-6.4 quake succeeded a July magnitude-7.0 earthquake that struck the same region. What do these quakes tell us about the faults involved and whether the second was an aftershock?
By Mario Aurelio, Sandra Donna Catugas, Structural Geology and Tectonics Laboratory, University of Philippines National Institute of Geological Sciences, Alec Benjamin Ramirez, Geomorphology and Active Tectonics Research Laboratory, University of Philippines National Institute of Geological Sciences, Semantha Chesca Aurelio, Association of Structural Engineers of the Philippines, Regional Sub-Committee, Laoag City, and Alfredo Mahar Francisco Lagmay, Executive Director, University of the Philippines Resilience Institute-Nationwide Operational Assessment of Hazards Center (@nababaha)
Citation: Aurelio, M., Catugas, S.D., Ramirez, A.B., Aurelio, S.C. and Lagmay, A.M.F., 2022, Two large quakes hit Abra, Philippines, in three months. What does this mean?, Temblor, http://doi.org/10.32858/temblor.288
On Oct. 25, 2022, at 10:59 p.m., Manila time, a magnitude-6.4 earthquake struck 16 kilometers (10 miles) below Abra, on the northwestern sector of Luzon in the Philippines. The event occurred less than three months after a magnitude-7.0 earthquake that hit the same region on July 27, 2022. The most recent epicenter was located only about 18 kilometers (11 miles) from where the July earthquake struck.
What this close proximity means for stress on the region’s faults is still being studied.
An area prone to earthquakes
The Philippine Institute of Volcanology and Seismology (PHIVOLCS) plots the epicenter of the October main shock around 5 kilometers (3 miles) north-northeast of Lagayan, Abra. More than 1,000 aftershocks with magnitudes ranging from 1.3 to 4.8 have been recorded. No ground rupture has been observed.

The main shock struck on a reverse fault, oriented roughly northeast, in an area of compression, according to data from PHIVOLCS. This is similar to the July earthquake.
The aftershocks were located north and north-northeast of the mainshock, in the upper Laoag River Basin, located in Ilocos Norte, the province immediately north of Abra. This aftershock configuration is distinctly different from that of the July event, which plotted west and southwest of the mainshock. This suggests that the fault responsible for the July event was different than that of the October event; however, both faults were dipping gently to the east or southeast.
Large earthquakes such as these can change the distribution of stress in Earth’s crust. We evaluated whether the July event could have triggered the recent quake. Assuming certain fault parameters, we find that the October earthquake occurred in an area that had seen a decrease in stress due to the July earthquake. This may suggest that the October event could be an aftershock of the July event. However, it was larger than a typical aftershock. Theoretically, aftershocks should have a maximum magnitude that is an order of magnitude lower — a magnitude-6.0 in this case. Aftershocks typically decrease in magnitude at a fairly predictable rate, with the largest in the minutes to days following a mainshock and then declining to smaller and smaller quakes in the weeks and months to follow. So this one doesn’t fit the pattern.
Instead, the October quake may be considered a doublet. Doublets are two related quakes that occur in close proximity and time; they are sometimes considered to be “interruptions in the rupture process,” causing the second part of an earthquake to be delayed due to an asperity or an irregularity of the fault plane such as a bend (see also discussion for Figure 4 below). Doublets are usually thought to occur closer in time than a period of months. Thus, whether these quakes are a doublet or not is still up for debate.

Infrastructure damage and ground deformation
No deaths were reported following the October quake, but at least nine provinces in three regions were affected. Around 140 injuries were reported and the earthquake displaced more than 114,000 individuals (NDRRMC SitRep 4, 01 November 2022). Infrastructure damage included totally (>400) and partially (>13,000) destroyed houses, and damaged government buildings, including hospitals and other health facilities, roads and bridges.
The total estimated cost of infrastructure damage is around 85 million Philippine pesos (~$1.5 million USD). Schools and offices in both the government and private sector were closed in the first few days after the earthquake.
The temblor was also felt slightly in Metro Manila, located more than 300 kilometers (190 miles) away, especially by occupants of high-rise residential complexes who reported experiencing swaying and movement of hanging objects such as ceiling fans and chandeliers.
The severe damage can be attributed to structural defects compounded by the shaking of loose sediments on which the buildings were erected. Columns below heavily built upper floors collapsed. Insufficient rebar support within columns and poor-quality concrete mix led to additional collapse. This is especially the case for buildings constructed on poorly consolidated subsurface, in which shaking during the earthquake was amplified. Such failure features were observed in residential houses as well as in government establishments such as municipal halls, hospitals and other health facilities.
Although less intense than in the July earthquake, ground deformation did occur with the October tremor as well. Numerous landslides occurred in mountainous regions and liquefaction was observed in at least one coastal site in Ilocos Sur, a province west of Abra (NDRRMC SitRep 4, 01 November 2022).
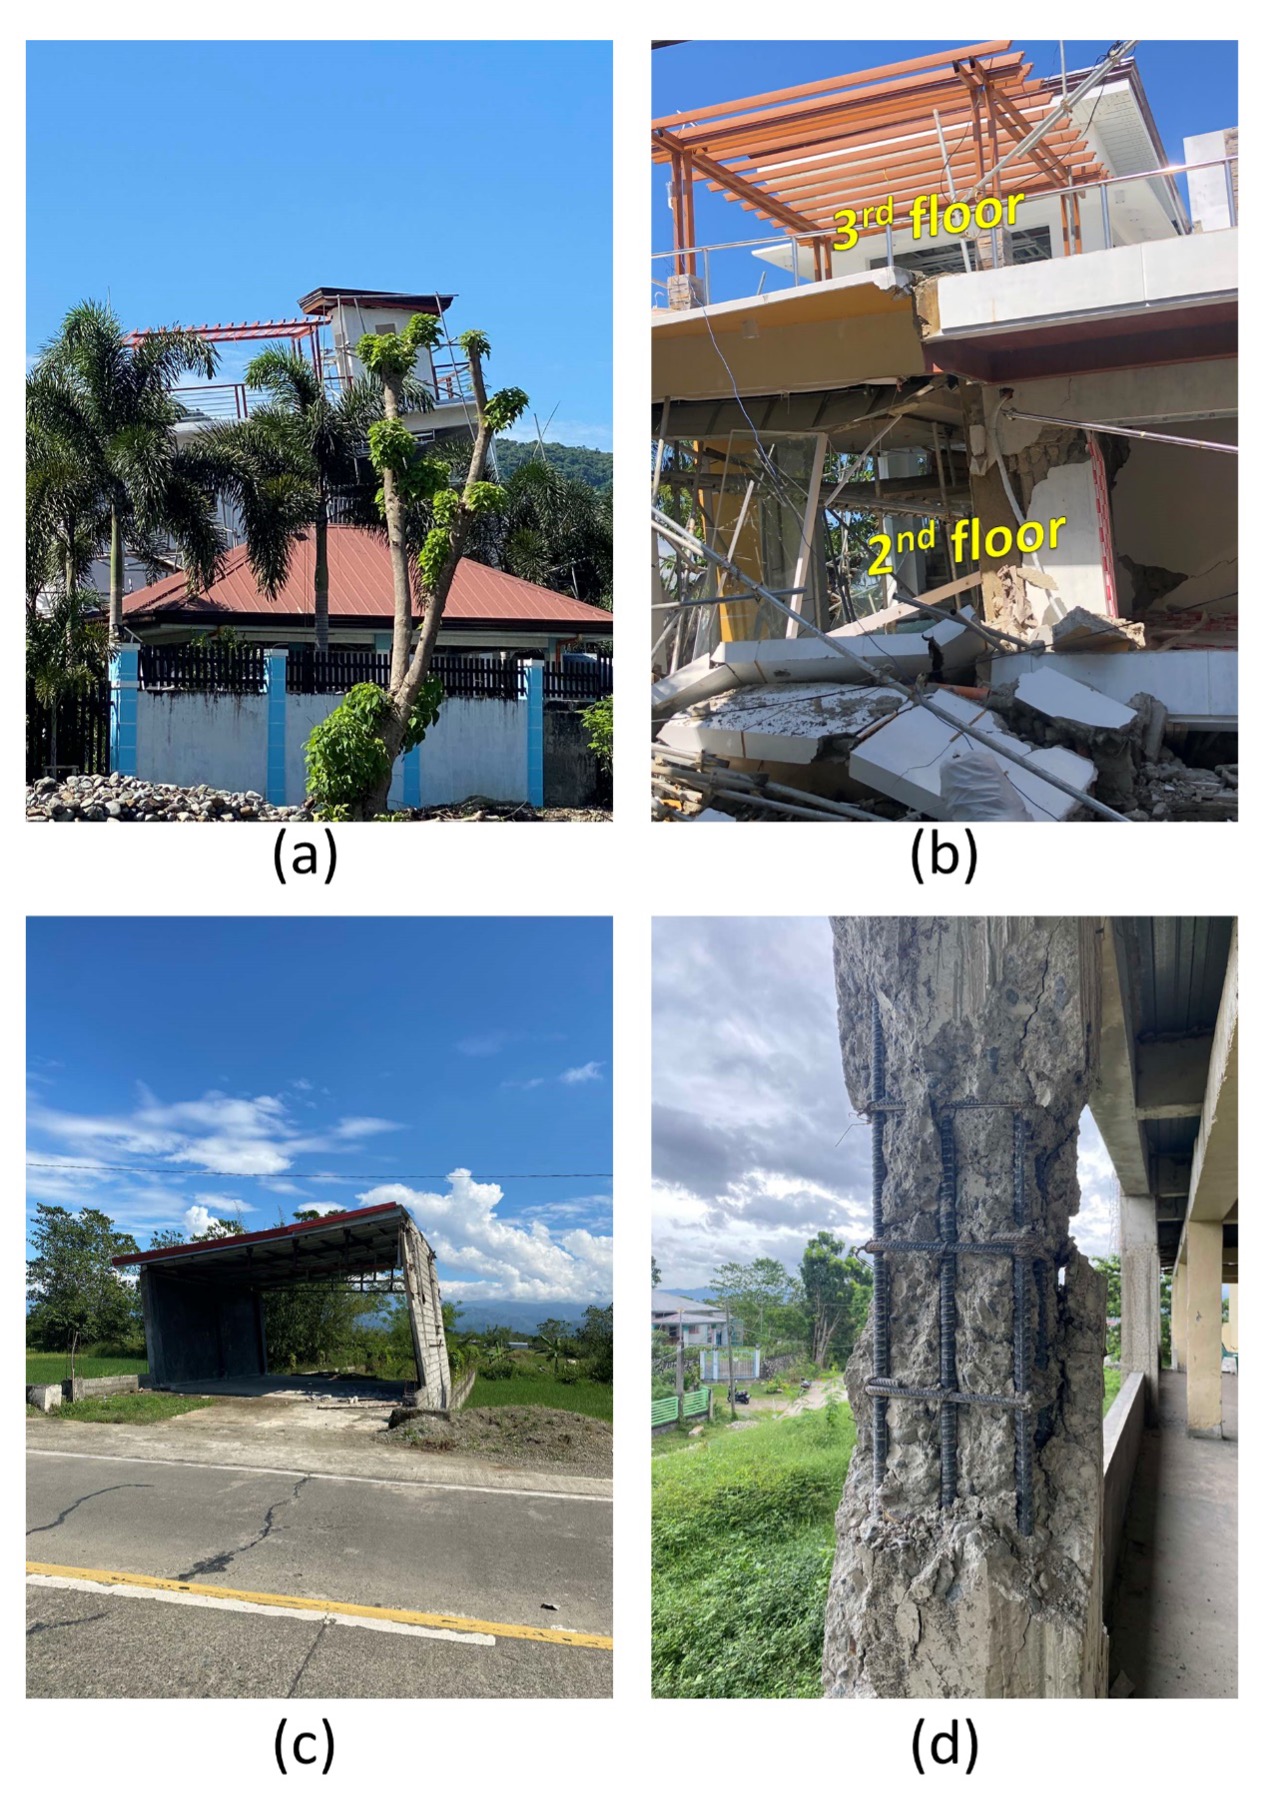
In Ilocos Norte, the province located to the north of Abra, particularly in the towns of Marcos, Banna, Solsona, Batac and the city of Laoag, some residents reported that the magnitude-6.4 event in October generated stronger ground shaking (higher intensity) than the magnitude-7.0 event in July. Although weaker in magnitude by about 15 times, the October event was felt more strongly by the Ilocos Norte residents since the epicenter was closer to them. Further, their towns are located within the vast floodplains of the Laoag River, which is underlain by loose river deposits that tend to shake more strongly during earthquakes. This may also explain the more intense infrastructure damage in these towns, despite the weaker magnitude.
Current maps indicate that several active faults are present in the upper Laoag River Basin. These faults form the branches of the northern segment of the Philippine Fault system. In August 1983, a magnitude-6.5 earthquake struck beneath Solsona, jolting the same region as the recent event and inflicting heavy infrastructure damage over a large area. To avoid future catastrophes, engineers should consider designing buildings strictly according to current structural codes, particularly those related to seismic loading, and particularly in floodplains where loose sediments predominate.
New insights on fault configuration
The magnitude-7.0 July earthquake did not leave any visible surface ground rupture. Neither did the magnitude-6.4 October quake. Without a surface mark of fault offset, identifying the fault that generated either earthquake is difficult. However, the close proximity of the two events in space and time provides some insights on the possible configuration of a fault(s) that could have triggered both earthquakes.
Though the calculated fault orientations from the two earthquakes are similar (compressional, thrust pair), the aftershock configurations are distinctly different, suggesting a fault geometry that curves to the right and steepens as it extends northward. The westerly distribution of the July aftershocks is consistent with the northerly trending, east dipping Vigan-Aggao Fault. On the other hand, the northerly distribution of the October aftershocks suggests a northeast striking, southeast dipping rupturing fault.
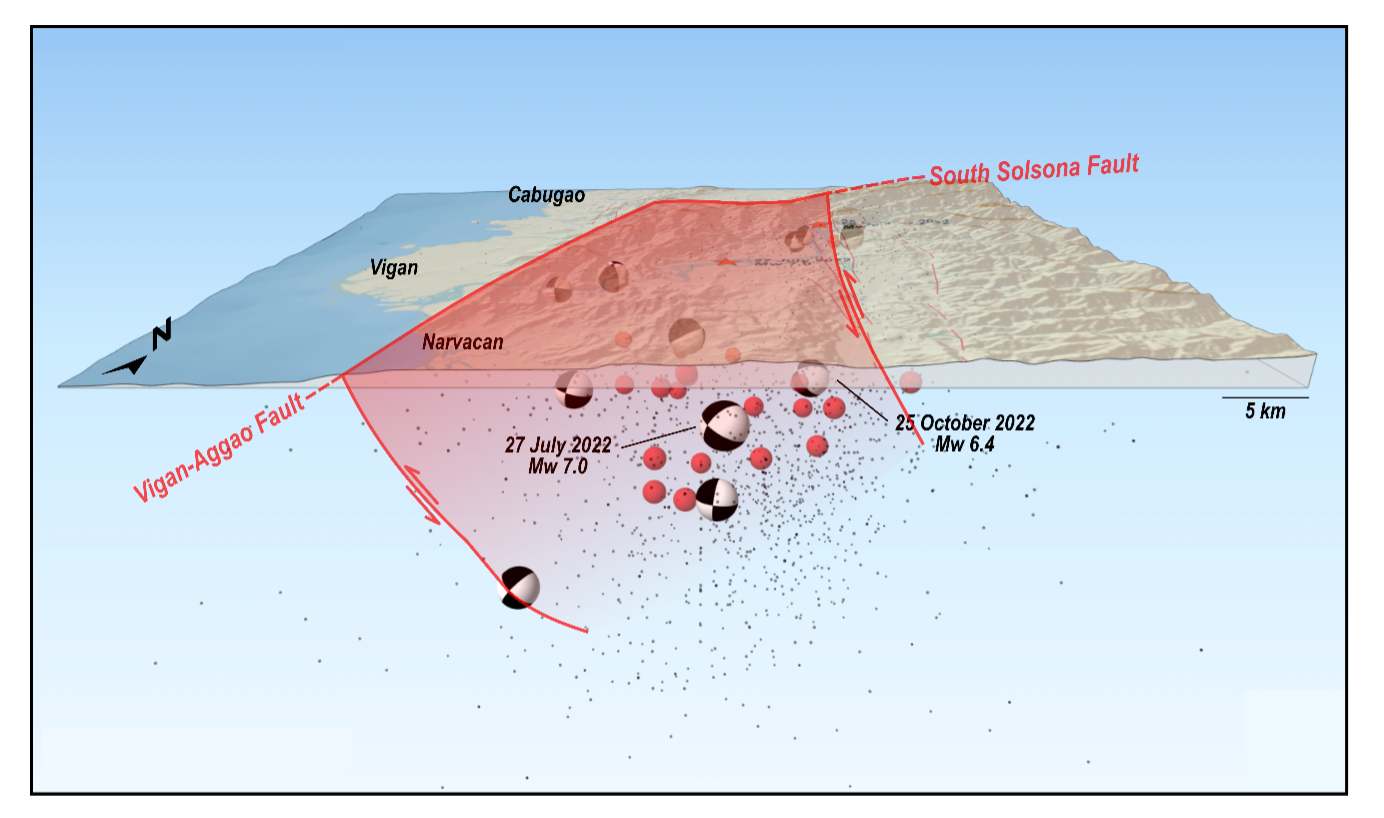
A curving fault plane is consistent with several known faults in the region that belong to the branches of the northern segment of the Philippine Fault system. Such faults include the West Ilocos Fault System (PHIVOLCS, 2022), which is made up of the Vigan-Aggao Fault, the South Solsona Fault and the North Solsona Fault (Aurelio and Peña, 2010; Pinet, 1990; Pinet and Stephan, 1990; Ringenbach, 1992; Ringenbach et al., 1990). Assuming that the July and October earthquakes were generated by a single fault, the best-fitting model would be a fault plane that connects the Vigan-Aggao Fault in the south with the South Solsona Fault toward the northeast. Such a fault plane, albeit bent to the northeast on its northern section, would be more than 90 kilometers (56 miles) long, capable of generating a future earthquake with a magnitude larger than 7.0.
References
Aurelio, M., Catugas, S.D., and Lagmay, A.M.F. (2022). Fault that caused a July quake in the Philippines still in question, Temblor, http://doi.org/10.32858/temblor.268
Aurelio, M.A. and Peña, R.E., Editors (2010). Geology of the Philippines, 2nd Edition – Vol. 1: Tectonics and Stratigraphy. 532 pages. Published by the Mines and Geosciences Bureau, Department of Environment and Natural Resources. Quezon City, Philippines
Jarvis, A., H.I. Reuter, A. Nelson, E. Guevara (2008). Hole-filled SRTM for the globe Version 4, available from the CGIAR-CSI SRTM 90m Database (http://srtm.csi.cgiar.org).
NDRRMC SitRep 4 (01 November 2022). National Disaster Risk Reduction Management Council (NDRRMC) Situational Report No. 4. Situational Report for Magnitude 6.4 Earthquake in Lagayan, Abra (2022). Available at: https://monitoring-dashboard.ndrrmc.gov.ph/page/reports/situational-report-for-magnitude-64-earthquake-in-lagayan-abra-2022
Philippine Institute of Volcanology and Seismology Earthquake Intensity Scale – PEIS. Available at: https://www.phivolcs.dost.gov.ph/index.php/earthquake/earthquake-intensity-scale
Philippine Institute of Volcanology and Seismology Earthquake Data (2022). Available at: https://www.phivolcs.dost.gov.ph/index.php/earthquake/earthquake-information3
Pinet, N. (1990). Un exemple de grand decrochement actif en context de subduction oblique: a faille Philippine dans se partie Septentrionale. Doctoral Dissertation, Université de Nice – Sophia Antipolis, France. 390 p.
Pinet, N. and Stephan, J. F. (1990). The Philippine wrench fault system in the Ilocos Foothills, northwestern Luzon, Philippines: Tectonophysics, 183, 207-224.
Ringenbach, J.C. (1992). La Faille Philippine et les châines en décrochement associés (centre et nord de Luzon): Evolution cénozoique et cinématique des déformations uaternaires.
Doctoral Dissertation, Université de Nice – Sophia Antipolis, France. 316 p.
Ringenbach, J. C., Stephan, J. F., Maleterre, P. and Bellon, H. (1990). Structure and geological history of the Lepanto-Cervantes releasing bend in the Abra River Fault, Luzon Central Cordillera, Philippines. Tectonophysics, 183, 225-241.
Toda, S., Stein, R.S., Sevilgen, V. and Lin, J. (2011). Coulomb 3.3 Graphic-rich deformation and stress-change software for earthquake, tectonic, and volcano research and teaching—user guide: U.S. Geological Survey Open-File Report 2011–1060, 63 p., available at https://pubs.usgs.gov/of/2011/1060/
Weatherall, P., Tozer, B., Arndt, J.E., Bazhenova, E., Bringensparr, C., Castro, C.F., Dorschel, B., Ferrini, V., Hehemann, L., Jakobsson, M., Johnson, P., Ketter, T., Mackay, K., Martin, T.V., Mayer, L.A., McMichael-Phillips, J., Mohammad, R., Nitsche, F.O., Sandwell, D.T., Snaith, H., Viquerat, S. (2020). The GEBCO_2020 Grid – a continuous terrain model of the global oceans and land. British Oceanographic Data Centre, National Oceanography Centre, NERC, UK. doi:10.5285/a29c5465-b138-234d-e053-6c86abc040b9
Wessel, P. and Smith, W.H.F., (1995). New version of the Generic Mapping Tools released. EOS Trans. Am. Geophys. Union 76, 329.
- Venezuela’s doublet leaned toward Caracas - June 30, 2026
- Is Southern California’s Cajon Pass an ‘earthquake gate’ ready to open? - June 29, 2026
- Philippines magnitude 7.8 shock may have loaded the central Cotabato subduction zone - June 11, 2026