Magnitude-6.5 and 6.9 earthquakes struck Taiwan’s seismically active east coast this week. The risk of more shaking is now elevated.
By Shinji Toda, Ph.D., IRIDeS, Tohoku University, and Ross S. Stein, Ph.D., Temblor, Inc.
Citation: Toda, S., and Stein, R.S., 2022, Taiwan earthquake sequence may signal future shocks, Temblor, http://doi.org/10.32858/temblor.273
The east coast of Taiwan is among the most seismically active sites in the world. Fifteen events of magnitude 6.5 or larger that have struck in the past 85 years, several of which occurred as sequences. On Sept. 17, a magnitude-6.5 quake struck, followed 17 hours later by a magnitude-6.9 quake 10 kilometers (6 miles) away. In retrospect, we can say that the 6.5 event was a large foreshock. Together, these events have loaded adjacent faults, and so the sequence may not be over.
A foreshock strikes adjacent fault
As always, we don’t know a quake is a foreshock until a larger one strikes soon thereafter. There was nothing about the magnitude 6.5 that marked it for future greatness. In this way, one can think of the mainshock as an “over-achieving aftershock,” in that it was larger than its mainshock —in this case, four times larger.
These two earthquakes don’t appear to have struck the same fault, which may mean that the foreshock brought the adjacent fault closer to failure. The foreshock appears to have slipped a patch of the Longitudinal Valley Fault, which is inclined to the east, whereas the mainshock appears to have slipped the Central Range Structure Fault, inclined to the west. The Longitudinal Valley Fault, and perhaps both, partially creep, and so only a portion of their slip is accommodated by earthquakes (Hsu and Bürgmann, 2006).

These faults are a product of the rapid western convergence of the Philippine Sea Plate with the island of Taiwan (part of the Eurasian Plate). Both faults have high slip rates and, based on their lengths and earthquake history, both are capable of still larger shocks than those that occurred on September 17 (Chan et al., 2020).

How likely is a magnitude-6.9 shock here?
The answer is “very.” Temblor’s Global Earthquake Activity Rate (T-GEAR) model provides an answer. T-GEAR is a blend of strain rate measured from GPS and the past 117 years of quakes. One sees that the 2022 event struck in the most seismically active part of Taiwan, where quakes of this size have a return period or recurrence interval (the typical time between events) of about 25 years. In 1951, Taiwan suffered a storm of quakes along its east coast, with a half dozen magnitude-7.0 or larger quakes spread out over 150 kilometers (Chen et al., 2008). One also sees that a magnitude-6.8 event struck in 2003 very close to the current sequence.

Could the M 6.9 also be a foreshock?
Foreshocks are rare; progressive mainshocks are more common (as in 1951), and aftershocks are ubiquitous. So, forecasting the distribution of aftershocks is tractable and valuable, even if they end up being smaller than the mainshock or the foreshock. We can calculate where the chances of subsequent shocks have increased as a result of the magnitude 6.9, and where they have decreased, using the theory of Coulomb stress transfer (Toda et al., 2011).
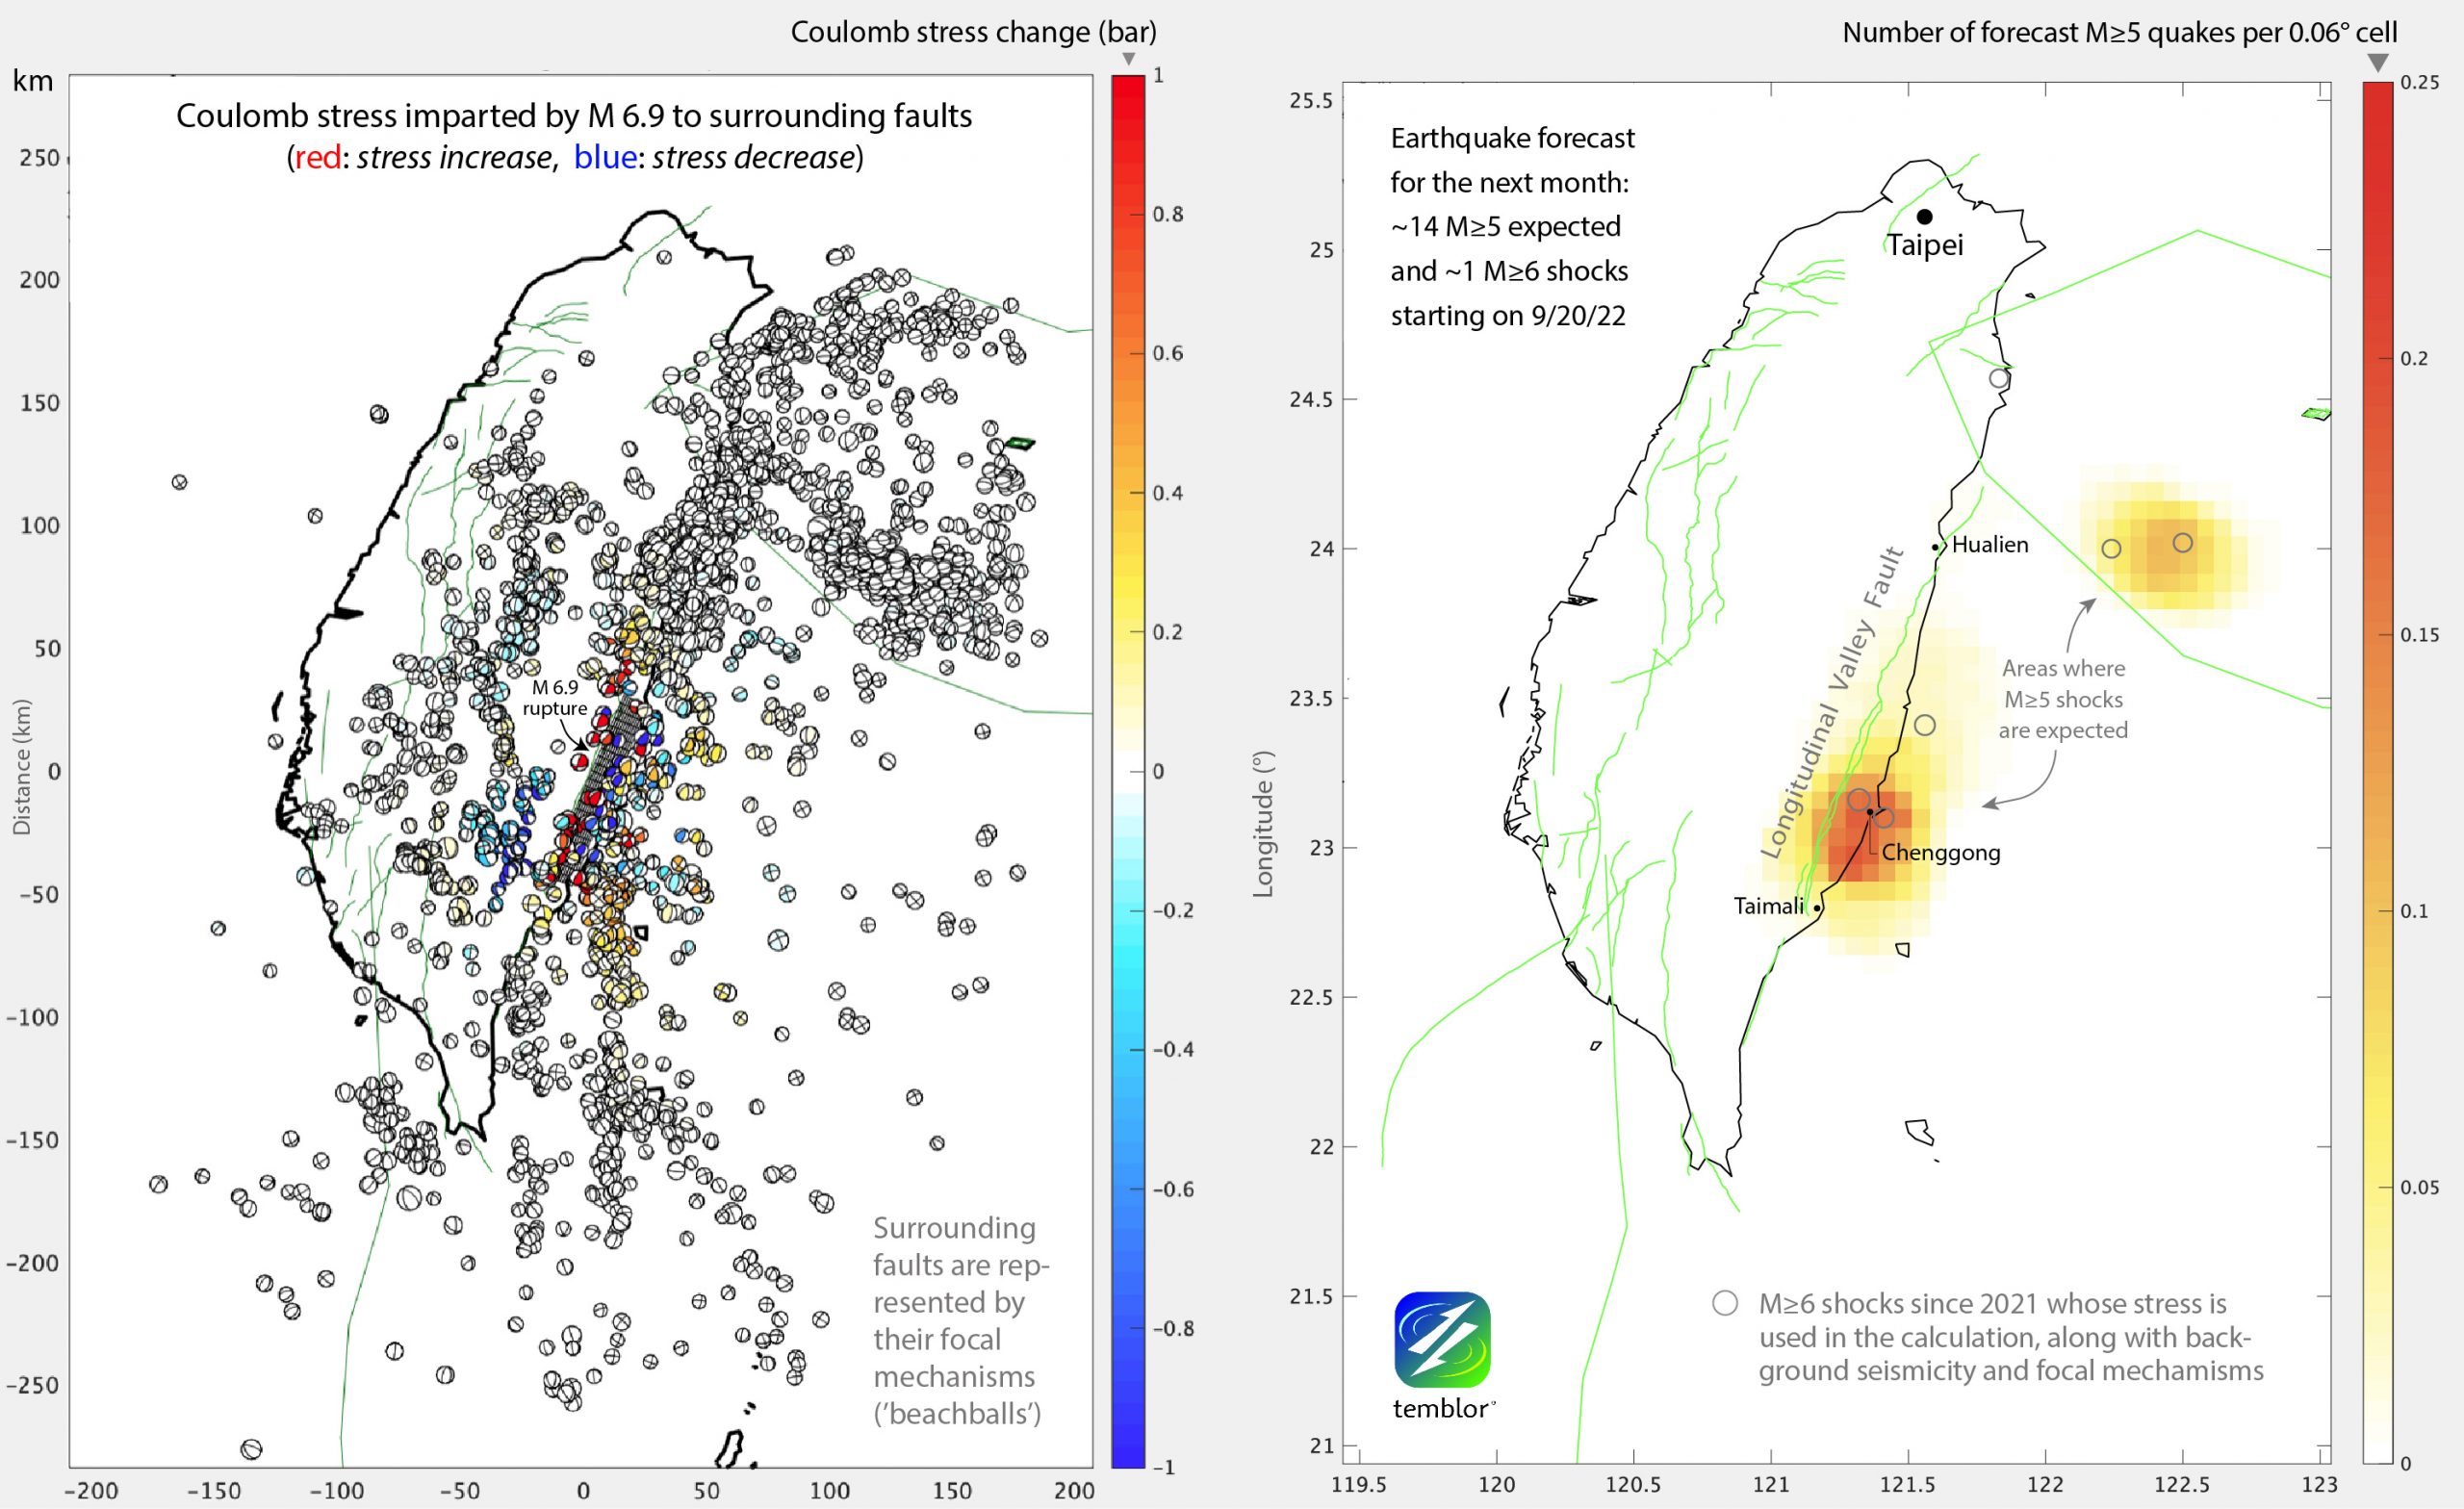
Temblor forecasts about 14 magnitude-5 or larger shocks in the next month. We use Realtime Risk (Toda and Stein, 2020) to calculate the Coulomb stress imparted by the mainshock to surrounding faults, and how the stress changes the quake rates over time. For this, we use the past seismicity and focal mechanisms from the BATS network (Institute of Earth Sciences, Academia Sinica, 1996). About one magnitude-5 or larger shock occurred in the past decade, whereas we forecast about 12 in the next 30 days, and perhaps one quake larger than magnitude 6. The quakes are expected near the epicenters of the magnitude-6.5 and -6.9 shocks, and also 60-75 kilometers to the north, at the northern edge of the magnitude-6.9 rupture. This might mean a re-rupturing of the fault or faults that slipped in the 1951 sequence. Given the ~25-year repeat time of magnitude-7 quakes in this region, the 70 years that has elapsed since 1951 would seem sufficient to recharge those faults and create conditions for subsequent events.
Bottom Line
Further mainshocks are, by no means, a certainty, but we can say this: They are more likely now than they were before September 17, and the region has a history of progressive earthquake sequences.
Acknowledgments
We thank our colleagues at E-DREaM, the Earthquake Disaster & Risk Evaluation and Management Center, National Central University, and the Institute of Earth Sciences, Academia Sinica, Taiwan, with whom we have collaborated for more than 20 years.
References
Chung-Han Chan, Kuo-Fong Ma, J Bruce H Shyu, Ya-Ting Lee, Yu-Ju Wang, Jia-Cian Gao, Yin-Tung Yen, Ruey-Juin Rau; Probabilistic seismic hazard assessment for Taiwan: TEM PSHA2020. Earthquake Spectra2020;; 36 (1_suppl): 137–159. doi: https://doi.org/10.1177/8755293020951587
Chen, K. H., Toda, S., andRau, R. -J. (2008), A leaping, triggered sequence along a segmented fault: The 1951 ML 7.3 Hualien-Taitung earthquake sequence in eastern Taiwan, J. Geophys. Res., 113, B02304, doi:10.1029/2007JB005048.
Hsu, L., and Bürgmann, R. (2006), Surface creep along the Longitudinal Valley fault, Taiwan from InSAR measurements, Geophys. Res. Lett., 33, L06312, doi:10.1029/2005GL024624.
Institute of Earth Sciences, Academia Sinica, Taiwan (1996): Broadband Array in Taiwan for Seismology. Institute of Earth Sciences, Academia Sinica, Taiwan. Other/Seismic Network. doi:10.7914/SN/TW
Shinji Toda, Ross S. Stein; Long‐ and Short‐Term Stress Interaction of the 2019 Ridgecrest Sequence and Coulomb‐Based Earthquake Forecasts. Bulletin of the Seismological Society of America 2020; 110 (4): 1765–1780. doi: https://doi.org/10.1785/0120200169
Thomas, M. Y., Avouac, J.-P., Champenois, J., Lee, J.-C., and Kuo, L.-C. (2014), Spatiotemporal evolution of seismic and aseismic slip on the Longitudinal Valley Fault, Taiwan, J. Geophys. Res. Solid Earth, 119, 5114– 5139, doi:10.1002/2013JB010603.
Toda, Shinji, Stein, R.S., Sevilgen, Volkan, and Lin, Jian, 2011, Coulomb 3.3 Graphic-rich deformation and stress-change software for earthquake, tectonic, and volcano research and teaching—user guide: U.S. Geological Survey Open-File Report 2011–1060, 63 p., available at https://pubs.usgs.gov/of/2011/1060/.