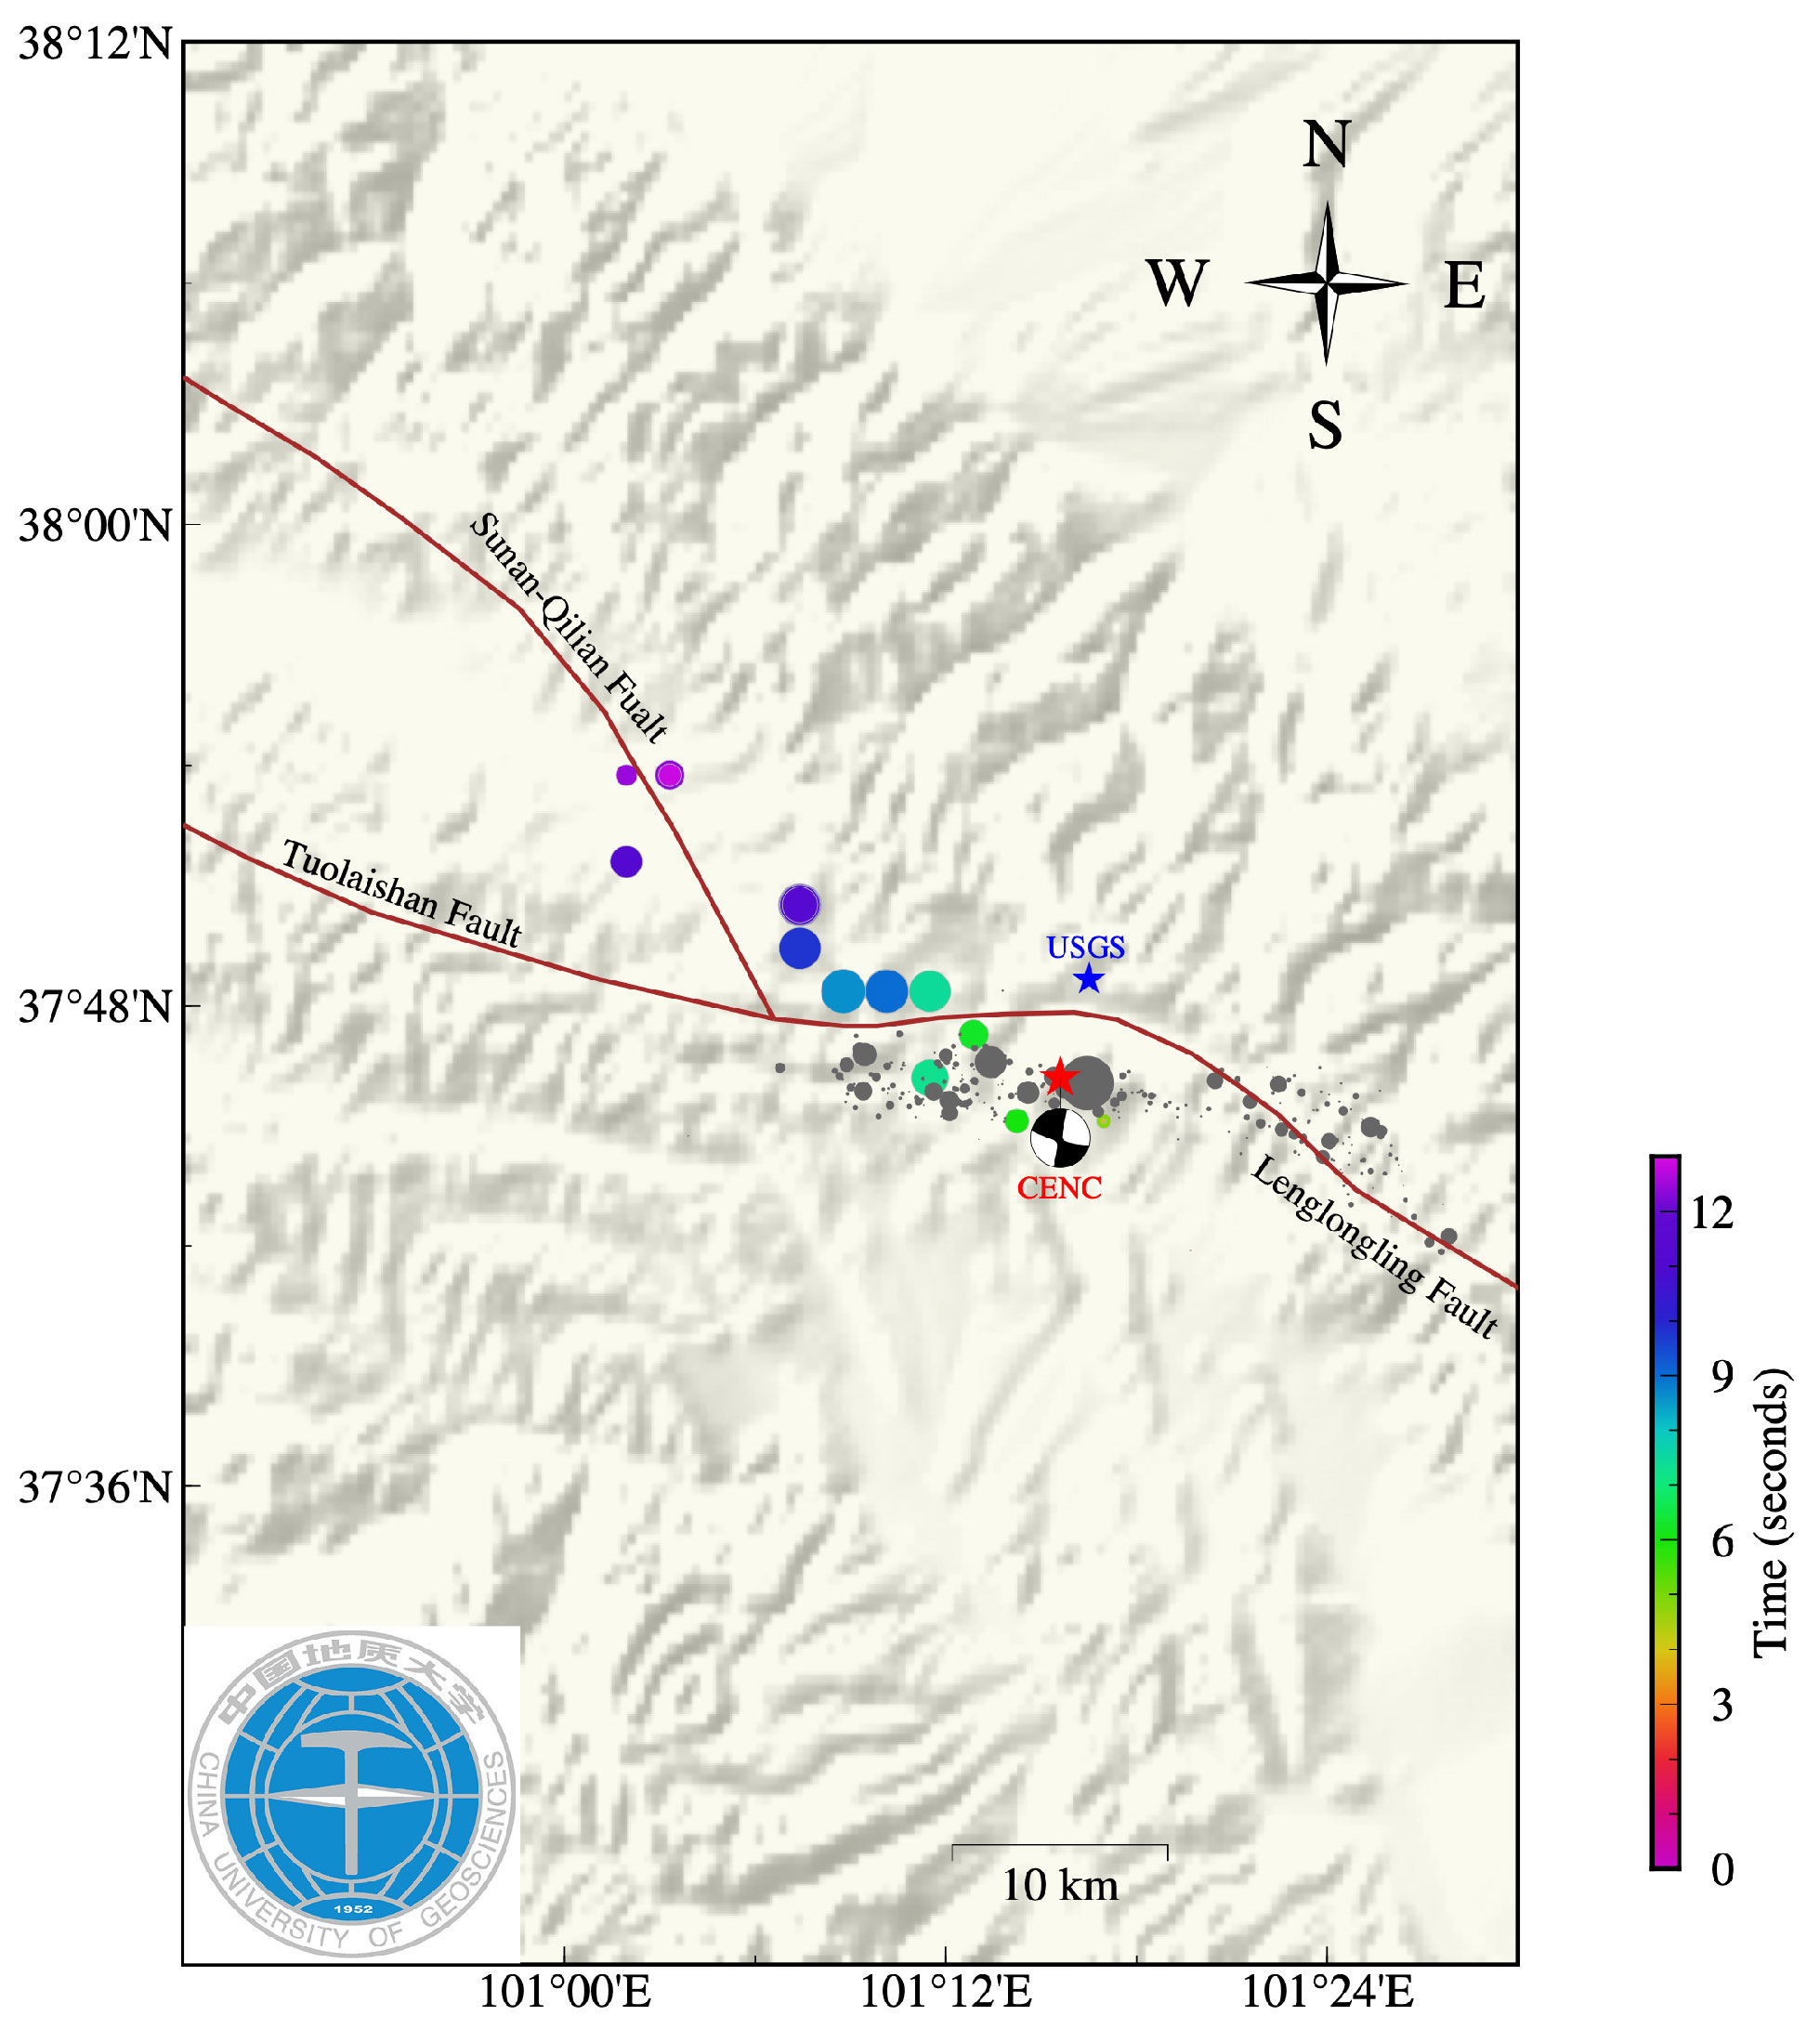
Figure 4. Mainshock rupture propagation results based on back-projection stack of teleseismic P waves recorded at broadband stations in Europe. Timing (color of circles) and amplitude (size of circles) for the stack with the maximum correlation at each time step in the map view. Red and black stars represent the epicenter of the 2022 Mw 6.6 Qinghai earthquake determined by the China Earthquake Networks Center (CENC), and United States Geological Survey (USGS), respectively. Gray circles indicate the locations of aftershocks that occurred within one day following the main shock (from Lihua Fang). Red dashed and black lines represent traces of faults and province boundaries, respectively. Credit: Dun Wang
Latest posts by Krystal Vasquez (see all)