Stress in Earth’s crust affects how faults move and rocks break. Researchers developed a novel way to measure stress using a different type of data.
By Fionna M.D. Samuels, Temblor science writing extern, (@Fairy__Hedgehog)
Citation: Samuels, F., 2021, Stressed out: Scientists find new way to measure crustal stress, Temblor, http://doi.org/10.32858/temblor.226
Stress isn’t only something humans feel when faced with deadlines or social strife; the ground beneath us is also stressed. Earth’s stresses dictate whether rocks will push together, pull apart, or grind past one another. In particular, the orientation of stress in Earth’s crust influences how rocks might break and in which direction faults will move — useful information for engineers drilling into the ground or scientists forecasting earthquakes. Recently, researchers from Los Alamos National Laboratory and the University of Vienna published a new stress-estimation method that could measure stress in far more locations than currently feasible using traditional methods.
Measuring stress
Drilling projects, ranging from oil and gas extraction to green technologies like geothermal and carbon-sequestration, need stress measurements to ensure success. For many such projects, measuring stress informs where rocks will fracture, allowing engineers to collect escaping gases or liquids, says Andrew Delorey, lead author of the study and a geophysicist at Los Alamos National Lab. Further, these types of projects can raise concerns about unintended induced, or triggered, seismicity.
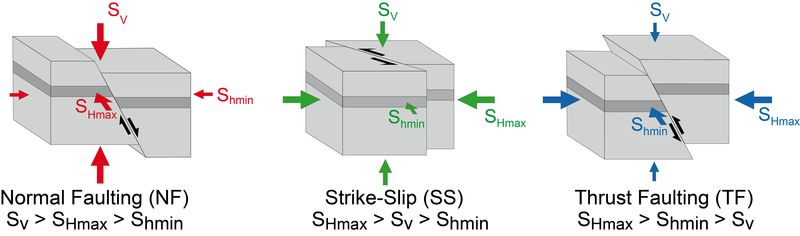
When stress in the crust surrounding a fault is optimally oriented, the fault may move more easily, producing an earthquake, Delorey says. So, measuring the orientation of stress in the crust helps scientists understand how a given fault might behave in the future.
Stress is typically measured in one of two ways. When an earthquake strikes, scientists can decipher the orientation of the responsible fault and quantify the speed of the resulting seismic waves. With enough data, researchers can infer the orientation of stress in the crust around the fault.
In areas where earthquakes are uncommon, boreholes provide windows into Earth — and its state of stress. Boreholes are deep, often vertical holes that puncture the ground. Instruments dropped down the hole help scientists directly measure stress in the surrounding rock. With enough boreholes, scientists can map crustal stress across an entire region.
But, aside from plate boundaries, few places on Earth shake with enough frequency to provide sufficient data. Also, the expense of drilling boreholes restricts where scientists can directly determine crustal stress.

Stress from noise
The ground is always shaking in a small way, only detectible by a seismograph, says Delorey, and this new method exploits that. “There’s always noise in the earth,” he says.
To measure that noise, researchers used publicly available data from seismographs across New Mexico and Oklahoma. Specifically, they measured the travel time of small seismic waves caused by the sloshing of Earth’s oceans and compared those signals between stations located at appropriate orientations to each other, says Delory. By recording these subtle waves repeatedly, Delorey and his team pulled stress data out of the background noise.

If enough instruments are deployed, the stress orientation for an entire region can be determined Delorey says, unlike with boreholes that only measure stress discretely at their individual locations. Seismic stations can reasonably be spaced between 6 and 62 miles (10 and 100 kilometers) apart, giving scientists the flexibility to measure regions of varying sizes.
This approach requires neither drilling nor waiting for earthquakes to occur, says Elizabeth Cochran, a seismologist at the U.S. Geological Survey. “You could go into an area before you trigger [seismic] events, or an area which generally was devoid of earthquakes and have a way of measuring the stress, which we can’t do any other way,” she says. Further, this approach uniquely allows researchers to see how stress orientations may naturally change over time, after either a drilling project or earthquake, she says.
In many places in the U.S. and elsewhere, researchers have access to data from stations already in place, so the implementing this method would cost next to nothing at those locations. Even if new seismic stations need to be installed, says Delorey, they’re far cheaper than boreholes.
(Un)certainty in stress
Although this new method has potentially broad applications, the uncertainty in measured stress appeared higher than with traditional methods, notes Cochran, who was not involved with this study. Both drilling projects and earthquake forecasting require stress measurements with small margins of error to be useful. Minimizing the error in any new method is vital for widespread implementation, she says.
Delorey is currently working on just that problem improving measurements collected in less time. Adding more stations to an area can also minimize uncertainty, he says.
“The real value in this approach would be if they could show that stress orientations could be determined with high reliability across smaller distances,” Cochran says. She points to southern Kansas and central Oklahoma, where stresses change orientations from north to south, altering the types of seismic events that can occur. “This type of method could have been useful before all of the earthquakes occurred in [those states]”, she says.
Further Reading
See seismograms of your area at the USGS website and see the kind of background data this technique uses!
Delorey, A. A., Bokelmann, G. H. R., Johnson, C. W., & Johnson, P. A. (2021). Estimation of the orientation of stress in the Earth’s crust without earthquake or borehole data. Communications Earth & Environment, 2(1), 1–10. https://doi.org/10.1038/s43247-021-00244-1
Zhao, R., Zhao, T., Kong, Q., Deng, S., & Li, H. (2020). Relationship between fractures, stress, strike-slip fault and reservoir productivity, China Shunbei oil field, Tarim Basin. Carbonates and Evaporites, 35(3), 84. https://doi.org/10.1007/s13146-020-00612-6
Lund Snee, J.-E., & Zoback, M. D. (2020). Multiscale variations of the crustal stress field throughout North America. Nature Communications, 11(1), 1951. https://doi.org/10.1038/s41467-020-15841-5
Ljunggren, C., Chang, Y., Janson, T., & Christiansson, R. (2003). An overview of rock stress measurement methods. International Journal of Rock Mechanics and Mining Sciences, 40(7), 975–989. https://doi.org/10.1016/j.ijrmms.2003.07.003
Heidbach, O., Rajabi, M., Reiter, K., & Ziegler, M.; WSM Team (2016): World Stress Map Database Release 2016. V. 1.1. GFZ Data Services. https://doi.org/10.5880/WSM.2016.001
- Venezuela’s doublet leaned toward Caracas - June 30, 2026
- Is Southern California’s Cajon Pass an ‘earthquake gate’ ready to open? - June 29, 2026
- Philippines magnitude 7.8 shock may have loaded the central Cotabato subduction zone - June 11, 2026