By: Christian Fogerty, Science Writer (@ChristianFoger1)
Seismologists used a recently developed model to forecast aftershocks following the recent Ridgecrest earthquake sequence. Their findings revealed a short-term increase in seismic hazard in the region.
Citation: Fogerty, C., 2020 Seismic hazard increased following 2019 Ridgecrest event, Temblor, http://doi.org/10.32858/temblor.089
Most Southern Californians are aware of the seismic risk posed by the San Andreas Fault. But a network of smaller faults in this region also pose a major earthquake hazard, not only because they can themselves generate large quakes, but because shaking along one fault can cause others to come to life.
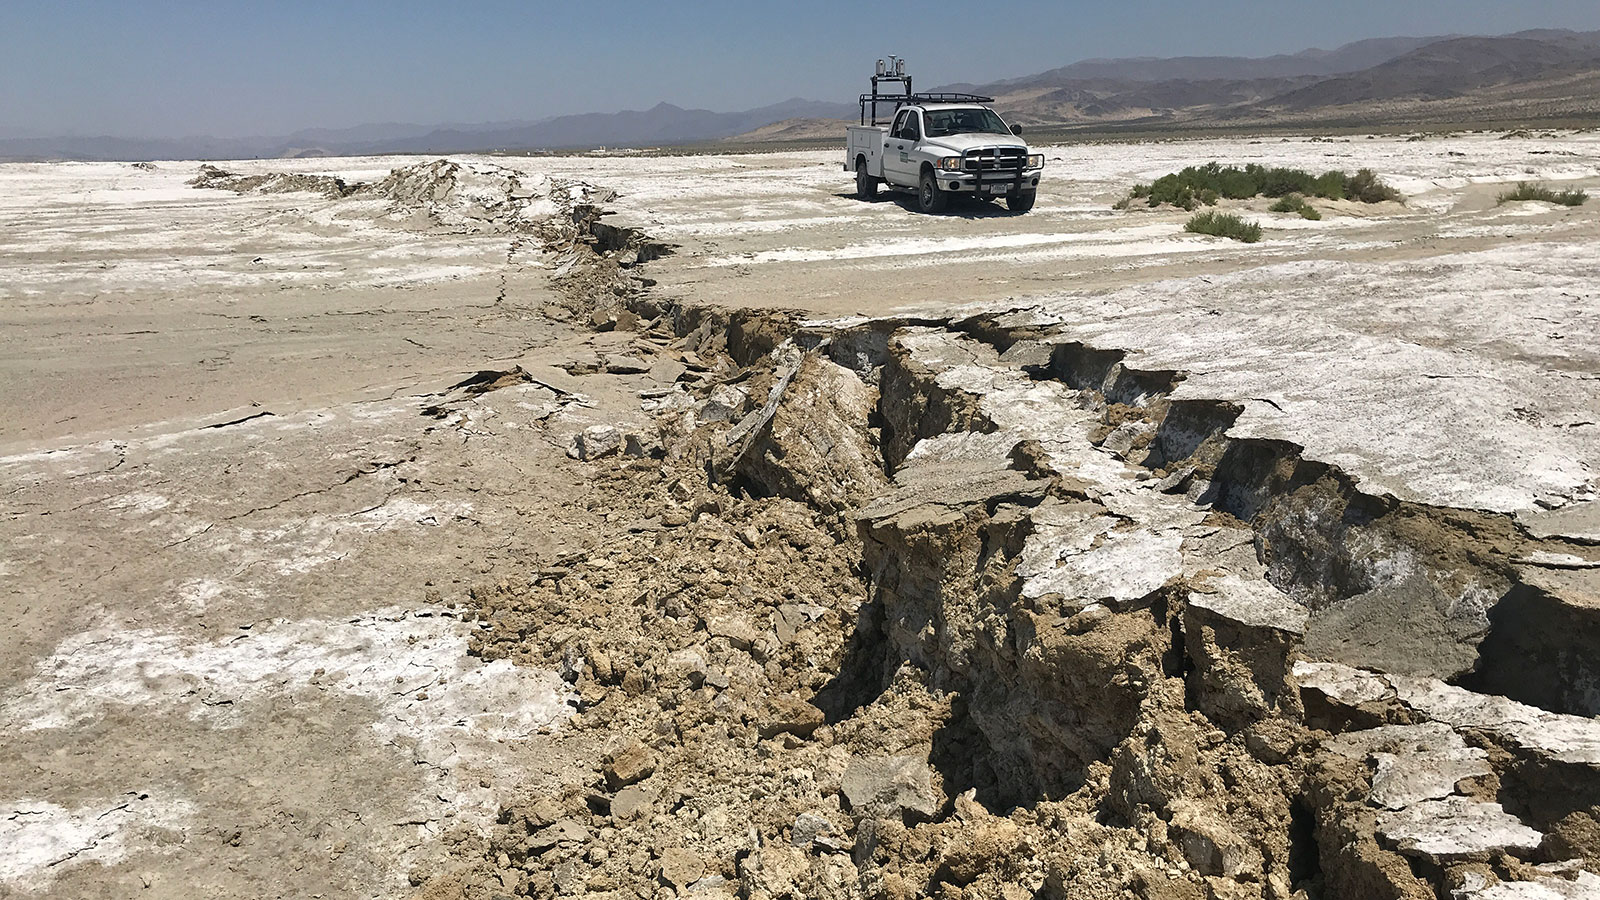
On the 4th of July 2019, the magnitude-6.4 Searles Valley earthquake rattled the region around Ridgecrest, California. Thirty-four hours later, a stronger magnitude-7.1 shock occurred. In a recent paper published in Seismological Research Letters, scientists used a newly developed model to forecast aftershocks following this event and evaluate the likelihood that these quakes could trigger even greater shaking [Milner et al., 2020].

Earthquakes trigger aftershocks
As stress — built up along a fault surface — is released at one location during an earthquake, it is redistributed throughout the region. This redistribution causes other, generally smaller, quakes to rupture on the same and nearby faults. Moderate to large earthquakes can cause hundreds to thousands of these aftershocks. Scientists look at aftershocks to learn about seismicity in a region in real time. When the quakes are put into a forecasting model, scientists can calculate the probability that a nearby fault may rupture over a given period.
One newly developed aftershock forecast model takes into account the concept that faults are more likely to rupture in response to nearby seismic activity, thus providing a more comprehensive picture of aftershock probabilities. This new model, known as an epidemic type aftershock sequence, is borrowed from the epidemiology literature. It is similar to models being used to learn about the spread of SARS-CoV-2, the virus that causes COVID 19.
“This improves the ability to accurately forecast aftershock sequences, and it also provides better constraints on where these aftershocks are likely to occur,” says USGS research geophysicist David Shelly.
Ridgecrest aftershocks
Immediately following the Searles Valley quake, Kevin Milner, a computer scientist at Southern California Earthquake Center and one of the lead developers of the new model, got to work, eventually generating 100,000 forecasts by 4 p.m. later that day — each with their own probability of occurrence. After the magnitude-7.1 mainshock occurred, another researcher updated the forecasting model with the new data.
This kind of real-time modeling gives decision makers invaluable information to prepare for a potentially imminent event. With the forecast generated in the hours following this event, California’s earthquake advising committee informed the governor of possible hazards later that day.
The committee was particularly concerned about the likelihood of a rupture along the Garlock fault, a long strike-slip fault near the Ridgecrest area capable of generating a major earthquake. The forecasting model initially gave 0.65% chance of a Garlock rupture greater than magnitude-7.0 in the 30 days following the mainshock, but as more aftershock events occurred and the model was updated over the next few days to better represent the rupture surfaces, probabilities jumped up to as high as 5.1%. These higher aftershock probabilities are characteristic of the days immediately following an earthquake.

Future forecast
Over time, as sequences decay, aftershock probabilities get lower. Nearly 10 months after the event, Garlock rupture probabilities have decreased to nearly the level before the Ridgecrest sequence. “There’s definitely still a chance of a large Garlock event according to the model,” notes Milner. But, he says, over the next 10 years, it’s only slightly higher than the long-term model would predict.
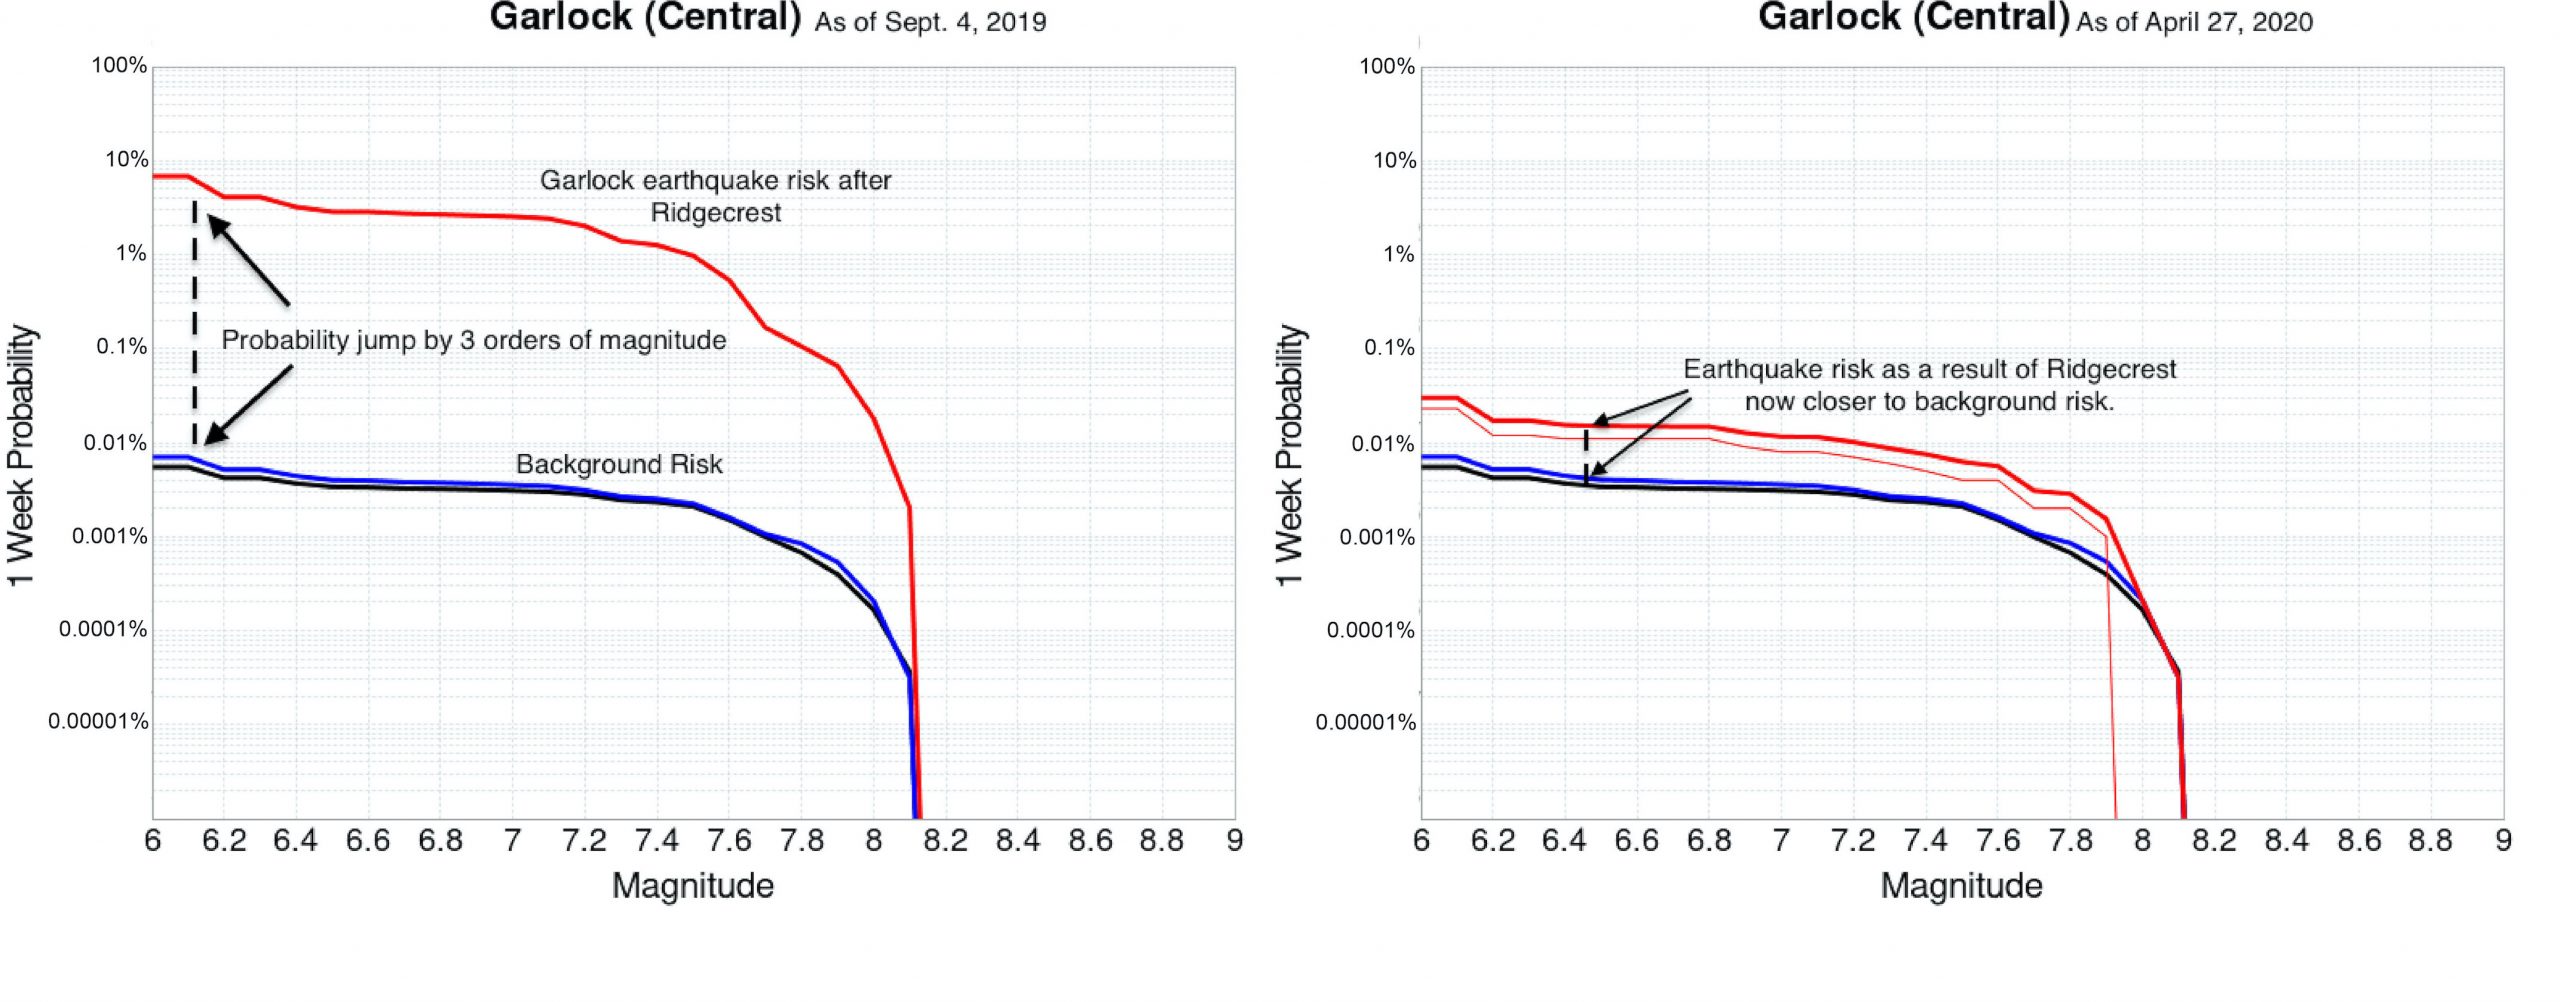
As for the San Andreas Fault to the west, probabilities of a Ridgecrest aftershock triggering a significant rupture on this fault increased immediately following the earthquake, although not much above the everyday background risk. Unlike the Garlock probability jump by roughly 3 orders of magnitude in the first week, the San Andreas Fault risk increased by about 1 order of magnitude. In other words, a large quake became roughly 1000 times more likely along the Garlock and 10 times on the San Andreas Fault. And with each new event comes new probabilities. With aftershock forecasts, the event rate decays, but the magnitudes don’t. There is still a chance for a strong event to trigger another sequence, and so on. As Milner puts it, “If the Garlock went, then we would start to get nervous about the San Andreas.”

For now, the Ridgecrest sequence is generally thought to be dying off. Creeping movement along the Garlock has been observed, but only at shallow depths where seismic activity is unlikely to occur (Ross et al., 2019). Even with this peace of mind, the probabilities found from this and other forecasting models make it clear that the time immediately following an earthquake is crucial. “Even though these probabilities seem low, the consequences of an earthquake on the Garlock or especially the San Andreas would be quite high. So, when an earthquake occurs, it’s important for people to prepared for additional earthquakes” notes Jeanne Hardebeck, a USGS geophysicist and member of the working group that developed the model.
Operational aftershock forecasting
For seismologists, one of the biggest goals on the technological horizon is operational earthquake forecasting. The term “operational” refers to forecasting models that are automatically updated following an earthquake. Currently, there are a handful of researchers with the ability to run the model used in this study, owing to a deliberate effort on the part of Milner and his colleagues to expand access to the model’s code and technical documentation. A completely automated version is still a few significant hurdles away.
“It’s definitely possible to operationalize this model, and we’re looking to go that route, but it’s going to require investment,” said Milner. With the appropriate computing resources, this goal is attainable, and could provide an unprecedented amount of detail and probability accuracy. But getting here requires not only an allocation of resources; it also demands a change in the overall way seismic risk is communicated to the public. “Concurrent with all of the work to operationalize this forecast, we would also have to really think about the best ways to present the information in a useful way that encourages appropriate responses from the public,” said Milner.
Check your earthquake risk at Temblor
Further Reading
Milner, K. R., Field, E. H., Savran, W. H., Page, M. T., & Jordan, T. H. (2020). Operational earthquake forecasting during the 2019 Ridgecrest, California, earthquake sequence with the UCERF3-ETAS model. Seismological Research Letters 91(3), doi.org/10.1785/0220190294
Ross, Z. E., Idini, B., Jia, Z., Stephenson, O. L., Zhong, M., Wang, X., Zhan, Z., Simons, M., Fielding, E. J., Yun, S., Hauksson, E., Moore, A. W., Liu, Z., & Jung. J. (2019). Hierarchical interlocked orthogonal faulting in the 2019 Ridgecrest earthquake sequence. Science 366(6463), doi.org/10.1126/science.aaz0109
- Venezuela’s doublet leaned toward Caracas - June 30, 2026
- Is Southern California’s Cajon Pass an ‘earthquake gate’ ready to open? - June 29, 2026
- Philippines magnitude 7.8 shock may have loaded the central Cotabato subduction zone - June 11, 2026