On Tuesday, the Bay Area was reminded once again that the faults that dissect the region are active. Local streams record how the region’s faults slowly shape the landscape.
By Kimberly Blisniuk, Ph.D., San Jose State University (@activetectonics)
Citation: Blisniuk, K., 2022, Rodgers Creek Fault shakes Bay Area, not for the first time, Temblor, http://doi.org/10.32858/temblor.270
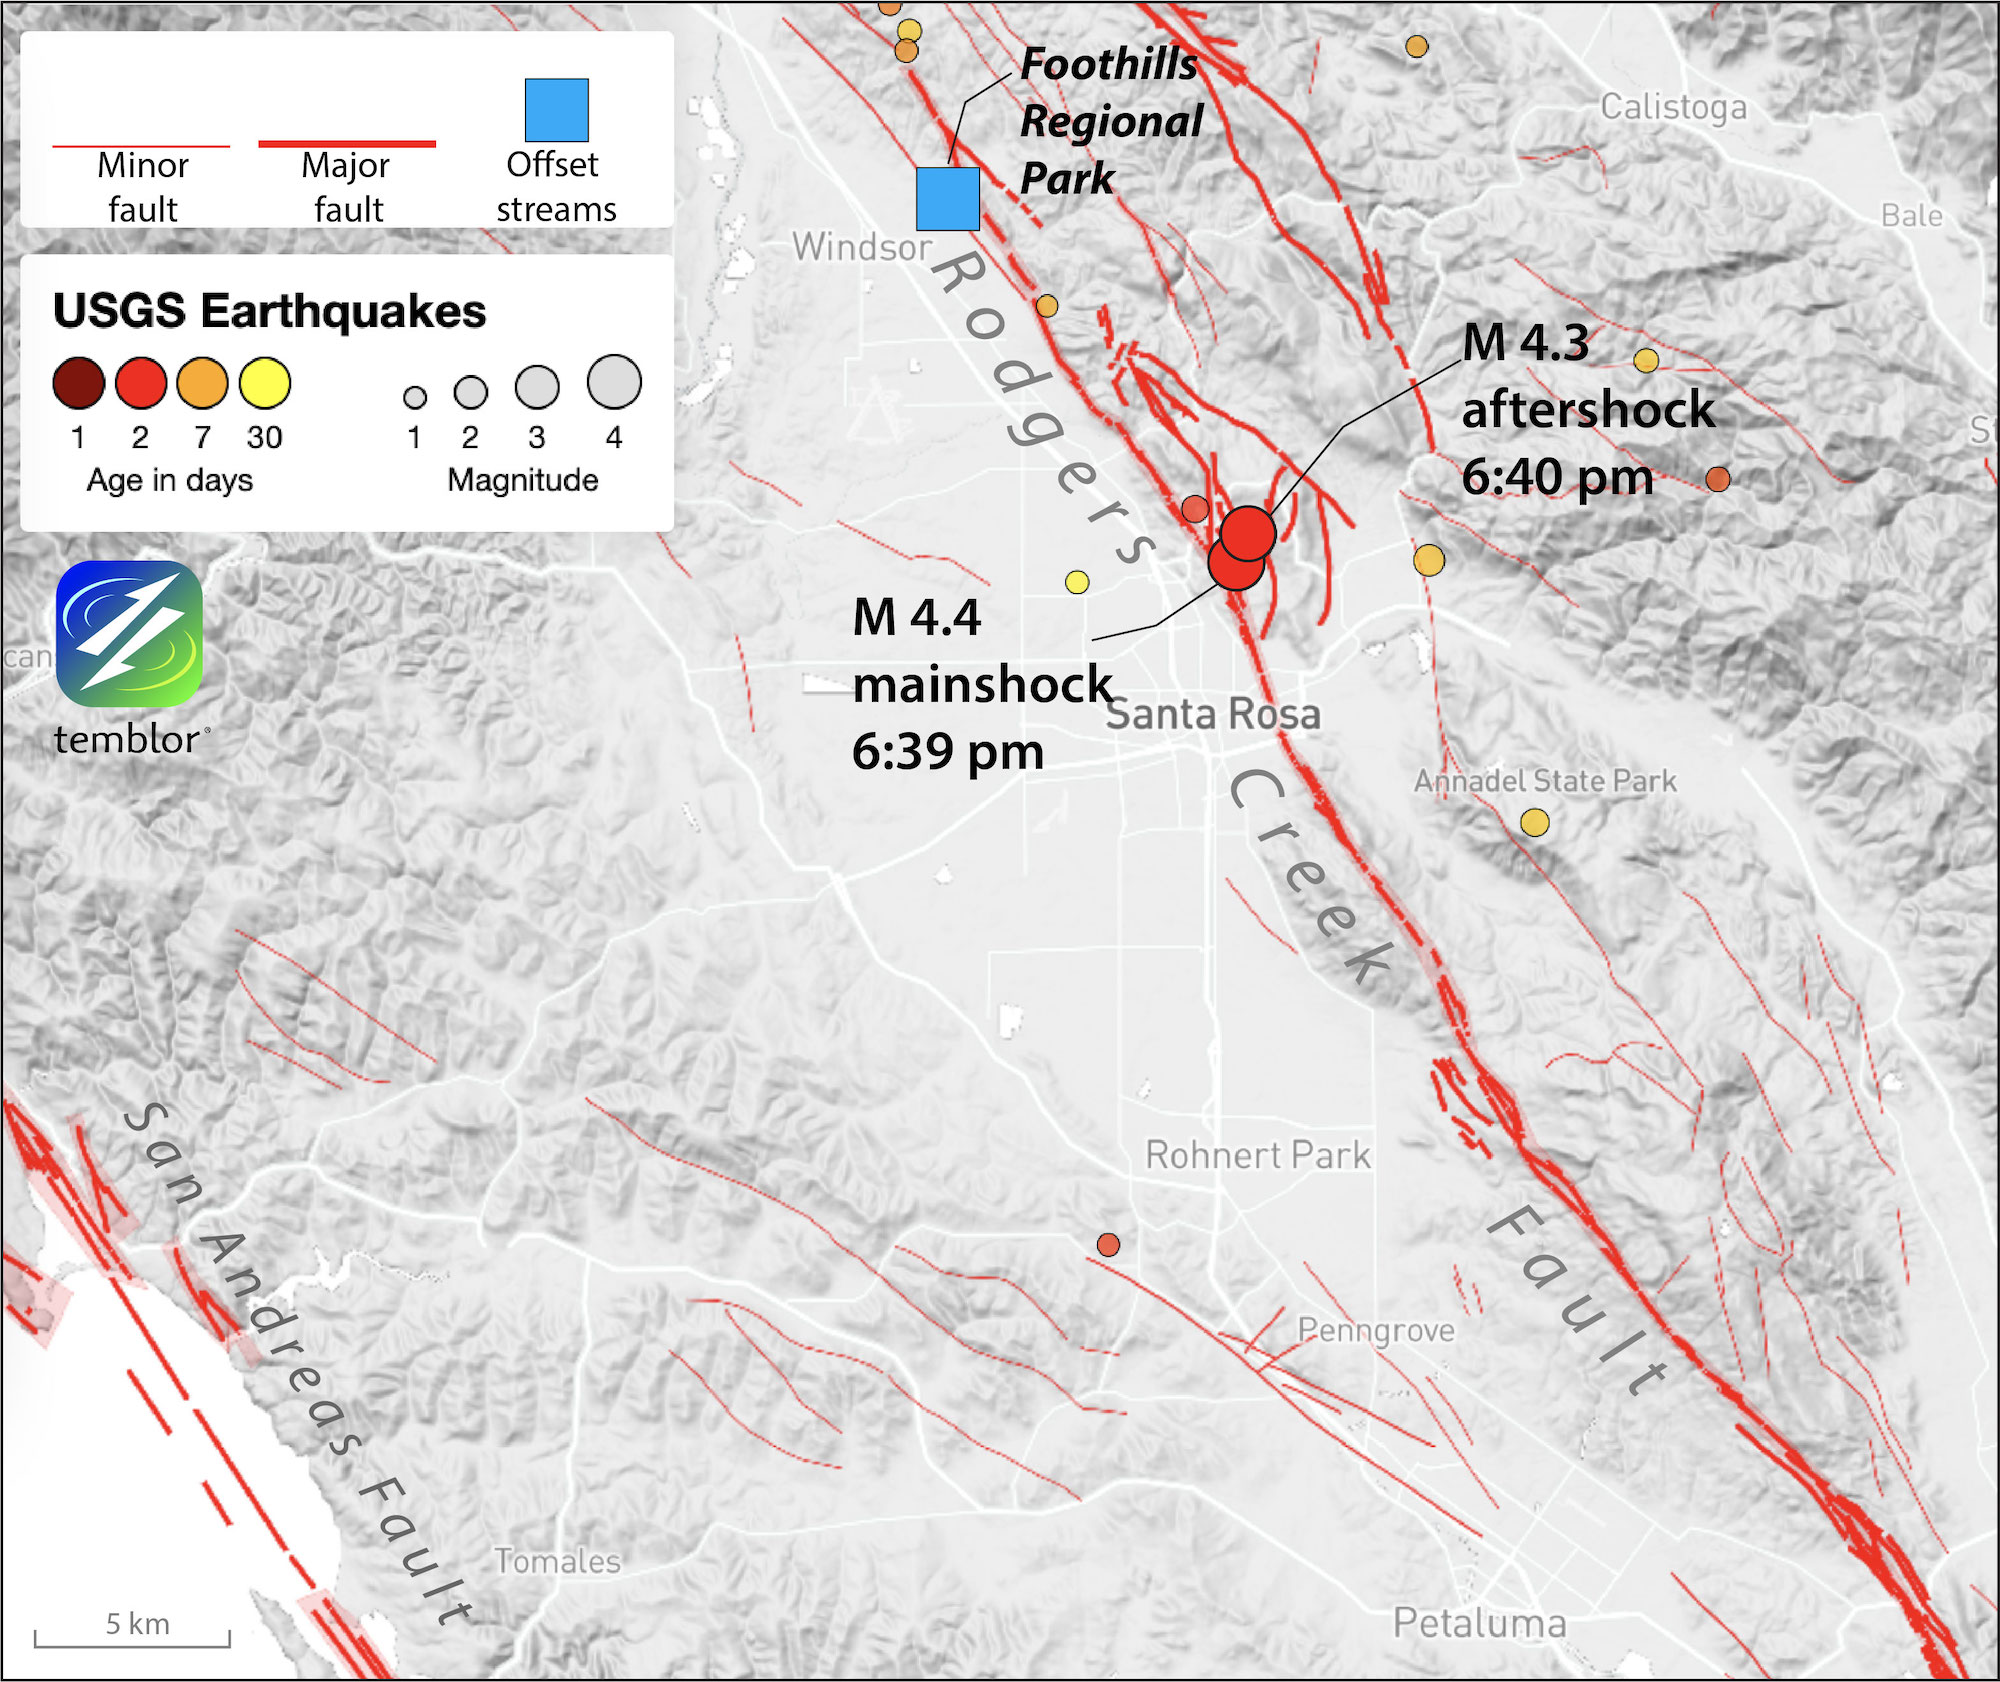
A magnitude-4.4 earthquake struck in northern Santa Rosa, Calif., last Tuesday, triggering a ShakeAlert earthquake early warning. Text messages and alerts warned North Bay residents to immediately drop, cover and hold on. The mainshock was followed less than one minute later by a magnitude-4.3 aftershock.
Good evening Nothern California. Did you feel the magnitude 4.4 quake about 2 mi north of Santa Rosa at 6:39 pm? Info: https://t.co/9IM6TRYLfi The #ShakeAlert system was activated. @Cal_OES @CAGeoSurvey @CaltechSeismo @BerkeleySeismo pic.twitter.com/GOy0iySs4B
— USGS ShakeAlert (@USGS_ShakeAlert) September 14, 2022
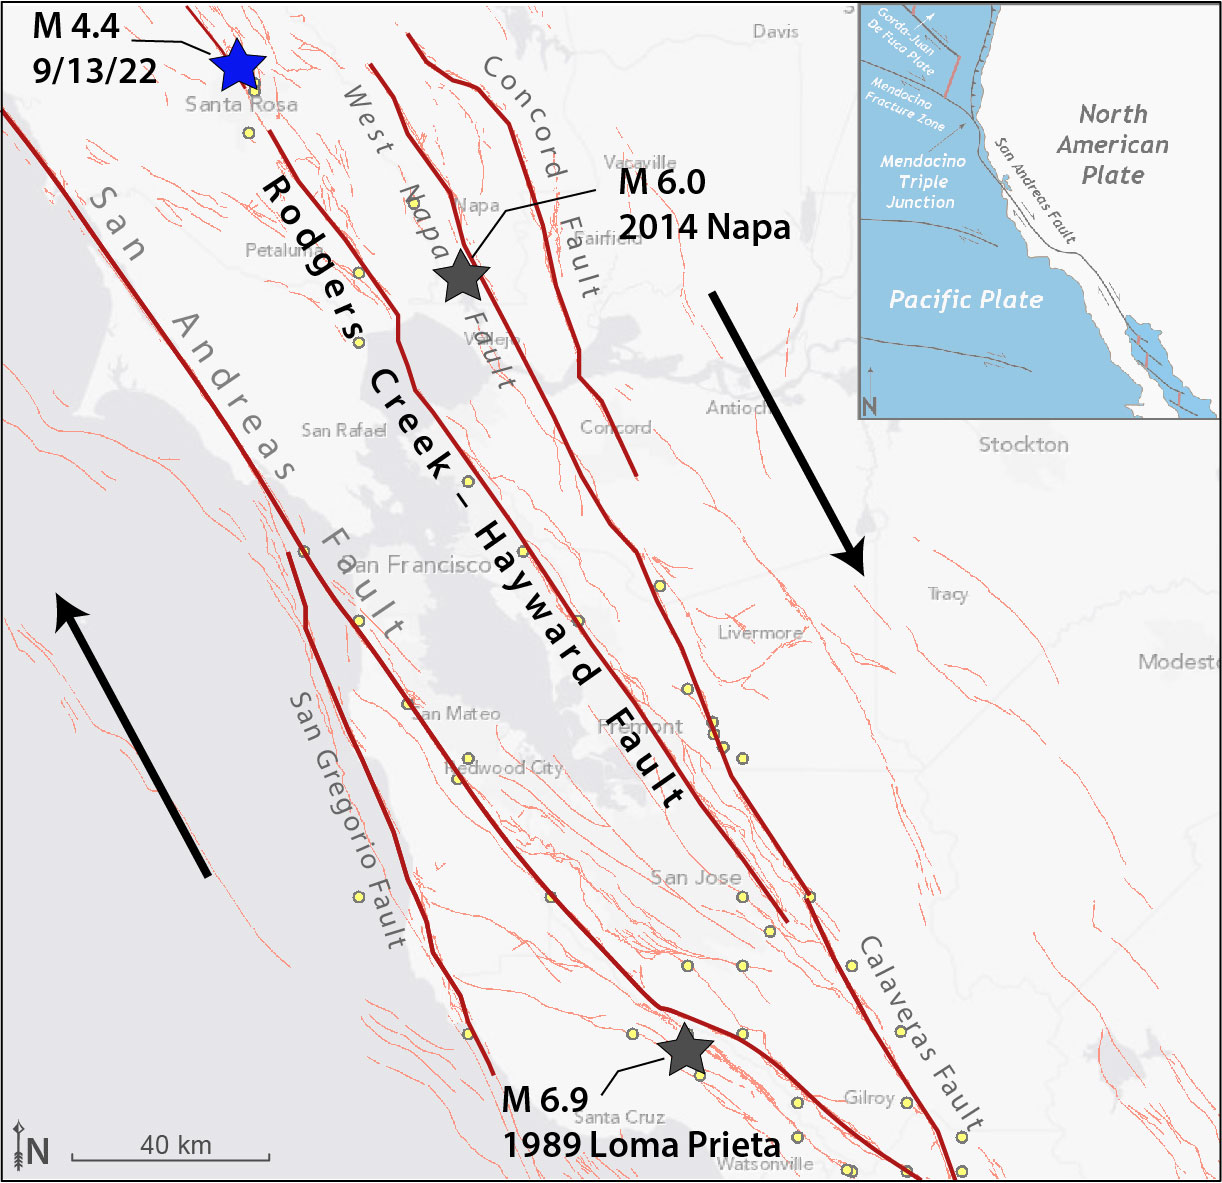
The earthquake occurred on the Rodgers Creek Fault, one of five major faults that define the San Andreas fault system in the Bay Area. Though the quake was relatively small and did not break the ground surface, shaking was felt in the surrounding area because it struck just 5.6 kilometers (3.5 miles) below a populated area. Nearly 7,000 people reported their experience through the U.S. Geological Survey’s “Did you feel it?” system.
A pair of damaging earthquakes — both magnitude-5.3 — occurred nearby, southwest of Santa Rosa on Oct. 2, 1969. These and others in the region, such as the 2014 magnitude-6.0 South Napa earthquake and 1989 magnitude-6.9 Loma Prieta earthquake remind us that much of California is built on an active plate boundary riddled with many known and unknown slipping faults.
Slicing up the Bay Area
The Rodgers Creek Fault is a right lateral strike slip fault, in which one side of the fault moves horizontally relative to the other. In Northern California, five main strike slip faults cut across the Bay Area along a northwest to southeast trend. From east to west these faults are the Concord, the Napa-Calaveras, the Rodgers Creek-Hayward, the San Andreas and the San Gregorio fault zones.
These faults accommodate movement between the Pacific Plate and North American Plate. Each fault is hazardous and can produce large, surface-rupturing earthquakes.
Determining the hazard
Key to understanding the hazard posed by any fault is an estimate of its slip rate — the distance the land on either side of the fault moves past the other over a certain period. Such data are fundamental to determining earthquake hazard because the faster the long-term slip rate, the higher the probability of an earthquake (e.g., UCERF3, Field et al., 2015).
The Rodgers Creek Fault is the northern continuation of the Hayward Fault north of San Pablo Bay. Of the faults in the Bay Area, the ~190 km long Rodgers Creek-Hayward Fault has the highest probability — 27 percent — of rupturing in a magnitude-6.7 or larger earthquake in the next 30 years, according to the U.S. Geological Survey (USGS). This probability is determined from trenching studies showing the Rodgers Creek-Hayward Fault is moving at a rate of 6.4-10.4 millimeters per year (0.3-0.4 inches per year; Budding et al., 1991).
The Rodgers Creek-Hayward Fault and other Bay Areas faults also accommodate some of the plate motion through aseismic creep — when a fault slips without producing a notable earthquake. Satellite data show the Rodgers Creek Fault creeps at a rate of 1.9–6.7 millimeters per year (0.1-0.3 inches per year; Jin and Funning, 2017).
However, recent mapping from airborne lidar — imagery of surface elevation taken from aircraft — reveals that the Rodgers Creek Fault is more complicated than previously mapped. These data show that the fault consists of multiple strands and extends 18 kilometers (11 miles) farther north than previously thought — to just north of Healdsburg (Hecker and Randolph Loar, 2018).
Putting back the puzzle pieces
Scientists are continuously collecting more data from Bay Area faults to better determine their hazard. In some cases, the landscape itself can give clues about the region’s prehistoric earthquakes.
When a fault slips at Earth’s surface, features in the landscape that cross it, such as roads, fences or streams, are offset. With each successive earthquake, these features are pulled farther apart. A fault’s long-term slip rate is determined from the cumulative amount of slip between these “markers.” These records, combined with trenching studies, provide the most direct evidence of large, recurring earthquakes that rupture the surface.
A record of past earthquake ruptures on the Rodgers Creek Fault is preserved in numerous offset stream channels in Foothill Regional Park in Windsor, north of Santa Rosa. Throughout the park, stream channels and the loose sediments they contain are deflected or beheaded across the fault. To determine how much slip occurred, we have reconstructed the past landscape in various locations by reconnecting channels and alluvial fans — much like fitting together pieces to a puzzle.
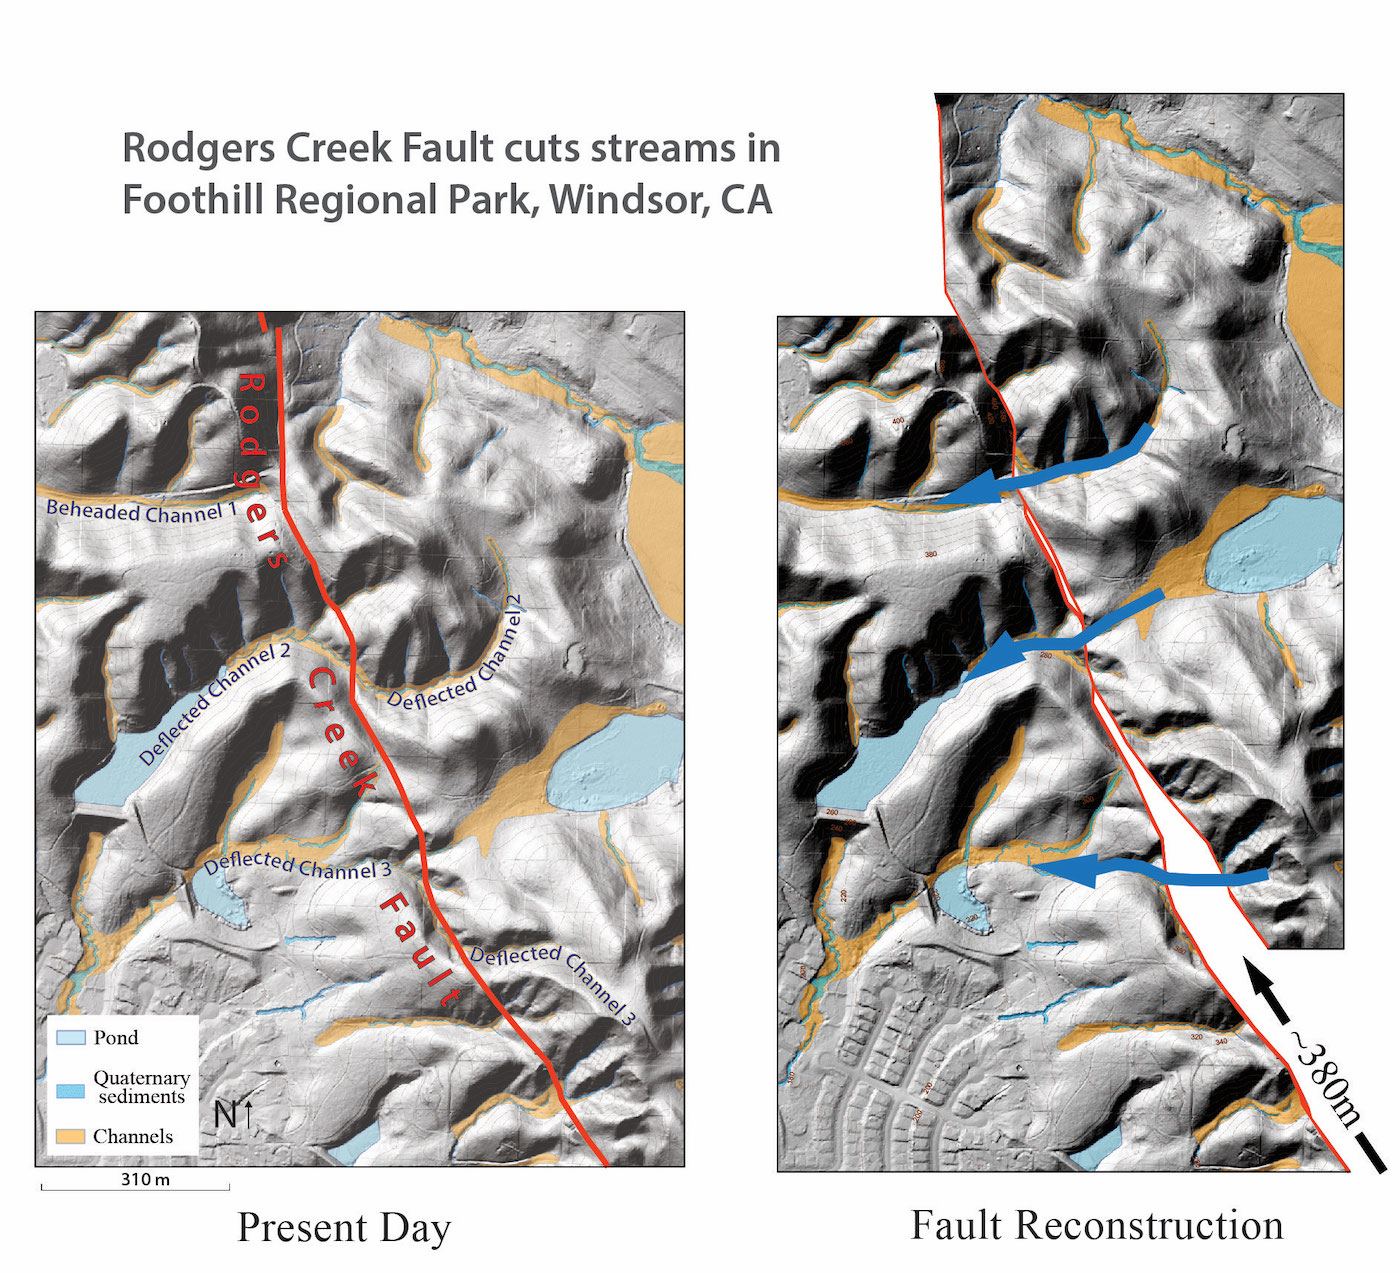
These channels and alluvial fans may be dated to bracket and estimate the age of the offset landform. These dates, combined with a measurement of the amount of offset between the channels, gives a slip rate on the fault.
This work to estimate slip rates and earthquake recurrence by myself and a USGS scientist, Suzanne Hecker, will contribute to major earthquake hazard programs, such as the Uniform California Earthquake Rupture Forecast (UCERF) program. These slip rates help refine and test probabilistic models for earthquake rupture in Northern California by updating the Northern California fault dataset.
References
Budding, K.E., Schwartz, D.P., and Oppenheimer, D.H., 1991, Slip rate, earthquake recurrence, and seismogenic potential of the Rodgers Creek Fault zone, northern California: Initial results: Geophysical Research Letters, v. 18, p. 447–450, doi: 10.1029/91GL00465.
Field, E. H., Biasi, G. P., Bird, P., Dawson, T. E., Felzer, K. R., Jackson, D. D., … & Zeng, Y. (2015). Long‐term time‐dependent probabilities for the third Uniform California Earthquake Rupture Forecast (UCERF3). Bulletin of the Seismological Society of America, 105(2A), 511-543.
Hecker, S., & Randolph Loar, C. E. (2018). Map of recently active traces of the Rodgers Creek fault, Sonoma County, California. US Geological Survey Scientific Investigations Map, 3410(7), 1.
Jin, L., & Funning, G. J. (2017). Testing the inference of creep on the northern Rodgers Creek fault, California, using ascending and descending persistent scatterer InSAR data. Journal of Geophysical Research: Solid Earth, 122(3), 2373-2389.
- Venezuela’s doublet leaned toward Caracas - June 30, 2026
- Is Southern California’s Cajon Pass an ‘earthquake gate’ ready to open? - June 29, 2026
- Philippines magnitude 7.8 shock may have loaded the central Cotabato subduction zone - June 11, 2026