Earthquake ‘felt reports’ can help determine where critical resources should be sent after a major quake. But these accounts may be biased toward those who have the means to report.
By Stacey S. Martin, Research School of Earth Sciences, Australian National University
Citation: Martin, S. S., 2021, Representation matters in earthquake ‘felt reports’, Temblor, http://doi.org/10.32858/temblor.165
Earthquake shaking can be assessed through a combination of instrumental measurements and eyewitness descriptions known as “felt reports.” Historically, these reports have come mostly from diaries, government reports or newspaper columns. Today, scientists also solicit felt reports by way of web-based questionnaires and more recently through innovative smartphone applications. These accounts provide a useful and rapid way to gauge the severity of earthquake ground motion when seismic instruments are sparse or unavailable.
But whose experiences are voiced in these accounts? Are these voices representative of the populations affected by the earthquake? My co-author, Susan Hough from the U.S. Geological Survey (USGS), and I explored these questions in a recent study focused on socioeconomics and seismology in California and India.
Who felt it?
One widely used internet-based felt report system is “Did You Feel It?” (DYFI), operated by the USGS to gather eyewitness experiences following earthquakes. The USGS uses DYFI reports alongside other parameters such as fault dimensions, strong motion measurements, local geology and population density to determine the human and economic impacts of an earthquake in near real time. This PAGER (Prompt Assessment of Global Earthquakes for Response) system is used by disaster managers to determine where resources should be focused to aid response and recovery following a major earthquake.
DYFI has been enormously successful in collecting data to map out the distribution of earthquake effects in far greater detail than would be possible using instrumental data alone. But what motivates people to contribute their observations to the DYFI system? Who participates? Does the system receive reports across a range of groups, or do socioeconomic biases shape the information that is available to characterize an earthquake and its effects?

Immediately following a major earthquake, emergency resources are distributed to places where scientists estimate the most damage is likely to have occurred. These locations are determined using systems such as PAGER that are supported in part by DYFI felt reports. An early study showed that, not surprisingly, participation correlates with shaking severity and population density (Mak and Schorlemmer, 2016). But we know that populations can be segregated by socioeconomic position. In our study, we considered DYFI records for recent large earthquakes in both California and India to determine who is represented in the reports.
Colonial influence on historic records
For earthquakes that predate the modern instrumental period, felt reports are sometimes preserved in writing either in private diaries or government reports, but most often in the columns of now out-of-print newspapers. These felt reports play a vital role in estimating the magnitudes and locations of historical earthquakes that predate the proliferation of modern seismometers. Physical preservation issues notwithstanding, compilations of historical earthquakes in some parts of the world are derived solely from the records of colonial powers with little or no input from inhabitants who did not speak the language of the colonists.
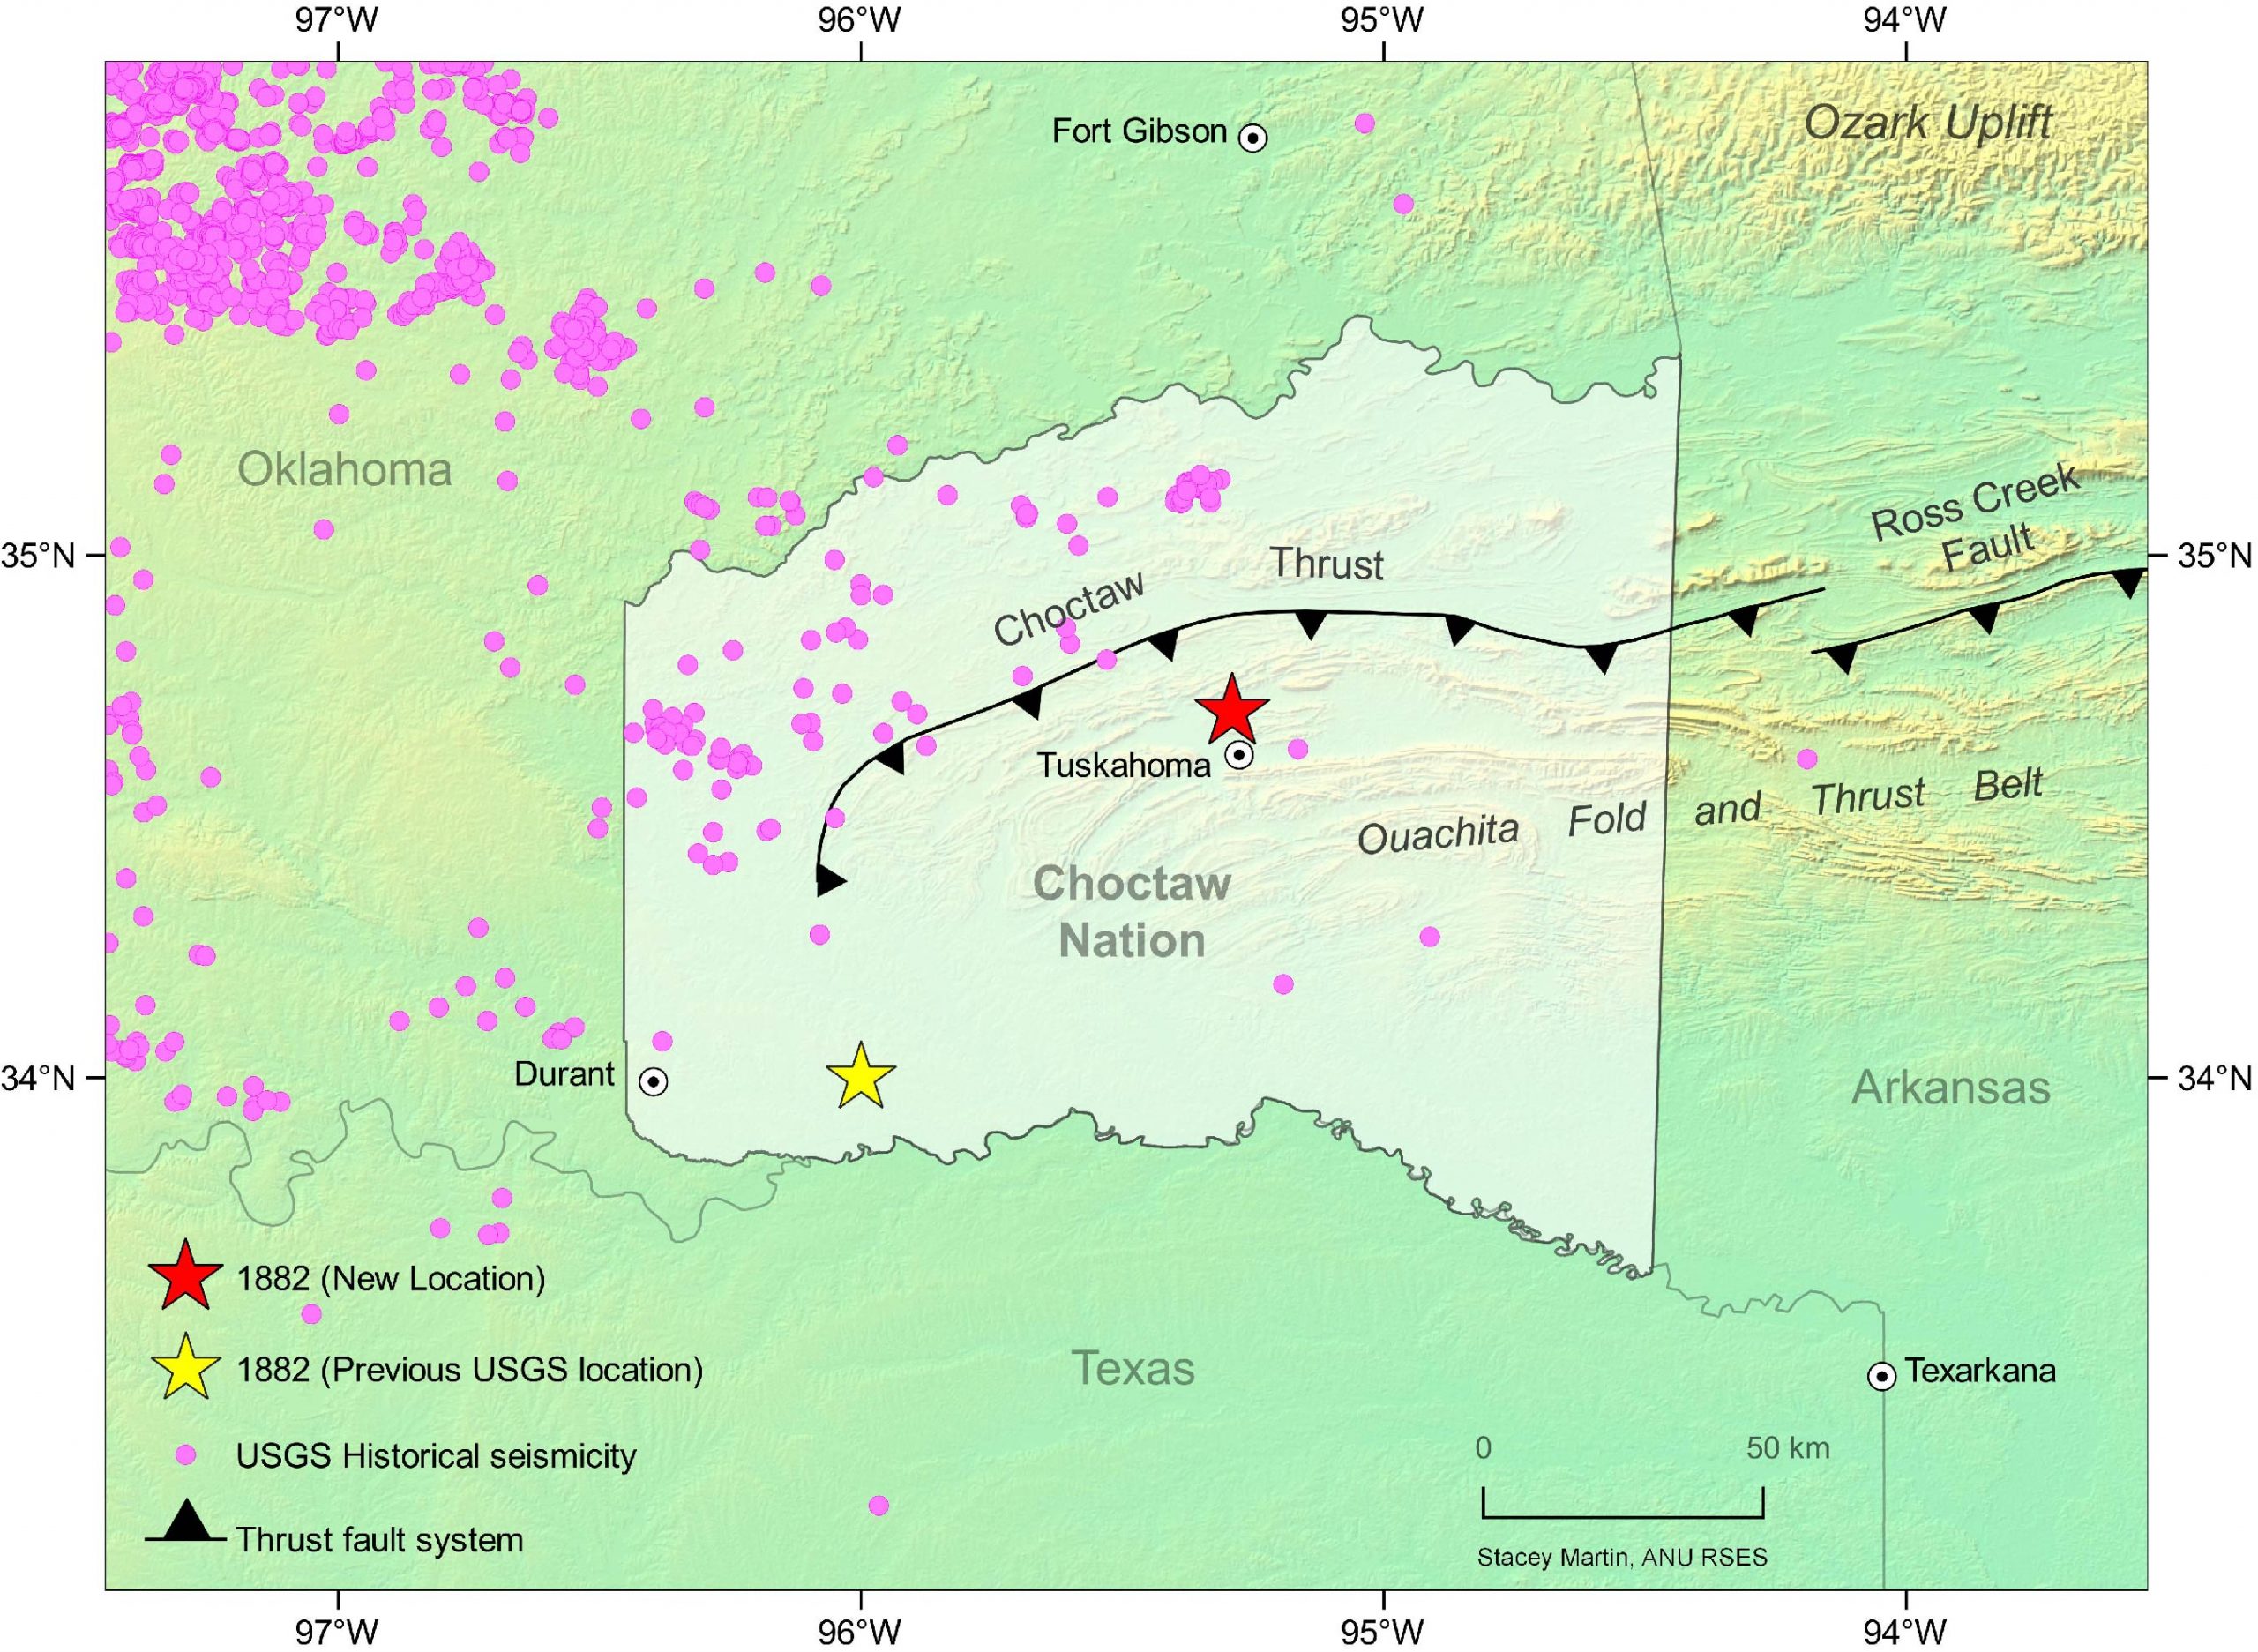
As an example, in our study we discuss the earliest known historical earthquake in the present-day state of Oklahoma. A previously undiscovered letter penned by a traveler through the Choctaw Nation, was recently used to re-evaluate the location and magnitude of an 1882 earthquake in Oklahoma. This points to the possibility that south-eastern Oklahoma could have a higher seismic hazard than previously thought.
Californians feel earthquakes
In California, we looked at how DYFI participation correlates with average household income in each ZIP (postal) code. We compared income to the reported intensity and the number of responses in the corresponding ZIP code for the 1989 Loma Prieta, 1994 Northridge and 2019 Ridgecrest earthquakes. We also looked at the number of responses as a function of the average reported intensity in each ZIP code.
Our results confirmed what earlier studies have shown: that DYFI response correlates strongly with severity of shaking. Our results did reveal some tendency for greater DYFI participation in more affluent regions, but overall, the system appears to be successfully collecting reports from less- as well as more-affluent parts of California.
In other words, in California, we found the DYFI system has been an equalizer in a way, and collects responses from individuals of various socioeconomic backgrounds.
Literacy’s impact on reporting in India
Literacy rates in India are segregated by population density, according to the 2011 Census of India. Urban areas have significantly higher literacy rates. Throughout the country, access to basic education remains uneven and is impacted by social aspects unique to the Indian Subcontinent such as gender, caste, religion and language of instruction, according to some studies (Borooah and Iyer, 2005; Husain, 2011; Goel and Husain, 2018). DYFI questions are available in English and more recently also in Spanish, but not in languages more often spoken in India. Despite English being widely spoken, barely 10% of India’s population of over a billion consider it a familiar tongue.

Rural and urban reporting in India
We first classified DYFI locations and those locations compiled by way of traditional seismic intensity surveys such as for the 2015 Gorkha, Nepal earthquake (Martin et al., 2015), as urban or rural given that literacy rates differ between the two. We then compared the relevant rural or urban district literacy rates at each of those locations from both datasets.
The DYFI system received accounts from fewer locations than traditional surveys, which was no surprise to us from our experience with previous earthquakes in the region. Nevertheless, the disparities we observed in the spatial distribution of reports and its correlation with literacy rates were surprising. Our results show that the DYFI system was sought out by more urban users than rural users, as can be seen for Delhi and the surrounding region, home to more than 25 million people. This is probably driven by higher literacy rates as well as greater internet access in urban areas as opposed to rural communities. Traditional surveys on the other hand rely on newspaper reports written by local correspondents fluent in the local vernacular. These individuals are also familiar to the local population who in turn are more at ease speaking to a known local journalist than they are at seeking out an online questionnaire written in a less familiar language. Our results thus highlight that traditional intensity surveys continue to be far more effective to map shaking effects in rural areas.

It is clear in our comparison of the DYFI and traditional datasets in India that DYFI data fails to characterize even strong shaking in socioeconomically disadvantaged areas. In the long term, this can lead to a poorer characterization of seismic hazard in less affluent areas, which could mean that future land-use planning would be oblivious to the potential of significant local shaking. This led us to underscore the importance of undertaking traditional intensity surveys for significant earthquakes in parts of the world where DYFI participation is grossly unrepresentative.
Increasing representation
Fundamentally, improved access to basic education, which ultimately increases literacy, and the internet will improve engagement with systems such as DYFI. In the meantime, more language options and an improved database of local place names may improve accessibility to the DYFI system. One app-based reporting system, developed by the European Mediterranean Seismological Centre, and rolled out globally, has done away with language entirely, relying instead on respondents selecting illustrations that best represent the shaking they felt. A similar approach is also in use in New Zealand.
Our findings in California and India are likely mirrored in other countries and could extend to other systems beyond the DYFI. It is important to underscore that our results should not be misconstrued as criticism of the DYFI or other similar services. We are also not implying that these shortcomings were in any way intentional. If anything, our study highlights the fact that there is still room for DYFI, PAGER and other systems to adapt so as to engage with a more diverse audience.
Although this study did not consider other natural hazards, reliance on community data for historical and modern events will likely be similarly impacted by hidden biases. The unequal and improper assessment of future risk from other natural and climate hazards potentially affects us all at some level. This is best summarized in the words of Dr. Martin Luther King “Injustice anywhere is a threat to justice everywhere. We are caught in an inescapable network of mutuality, tied in a single garment of destiny.” These words apply not only to inclusion in the sciences, but also to science itself.
References
Borooah, V. K., & Iyer, S. (2005). Vidya, Veda, and Varna: The influence of religion and caste on education in rural India. The Journal of Development Studies, 41(8), 1369-1404.
Goel, S., & Husain, Z. (2018). Gender, caste, and education in India: A cohort-wise study of drop-out from schools. Research in Social Stratification and Mobility, 58, 54-68.
Hough, S. E., & Martin, S. S. (2021). Which Earthquake Accounts Matter?. Seismological Society of America, 92(2A), 1069-1084.
Hough, S. E., & Page, M. (2015). A century of induced earthquakes in Oklahoma?. Bulletin of the Seismological Society of America, 105(6), 2863-2870.
Husain, Z. (2011). Gender disparities in completing school education in India: explaining geographical variations. Journal of Population Research, 28(4), 325.
Mak, S., & Schorlemmer, D. (2016). What Makes People Respond to “Did You Feel It?”?. Seismological Research Letters, 87(1), 119-131.
Martin, S.S., Hough, S.E., & Hung, C. (2015). Ground motions from the 2015 Mw 7.8 Gorkha, Nepal, earthquake constrained by a detailed assessment of macroseismic data. Seismological Research Letters, 86(6), 1524-1532.
Quitoriano, V., & Wald, D. J. (2020). USGS “Did You Feel It?”—Science and Lessons From 20 Years of Citizen Science-Based Macroseismology. The Power of Citizen Seismology: Science and Social Impacts.
Wald, D. J., Quitoriano, V., Dengler, L. A., & Dewey, J. W. (1999). Utilization of the Internet for rapid community intensity maps. Seismological Research Letters, 70(6), 680-697.
- Venezuela’s doublet leaned toward Caracas - June 30, 2026
- Is Southern California’s Cajon Pass an ‘earthquake gate’ ready to open? - June 29, 2026
- Philippines magnitude 7.8 shock may have loaded the central Cotabato subduction zone - June 11, 2026