Less clear is whether the three magnitude-7 quakes in the past 80 days are part of a chain reaction. The sequence has nevertheless left some faults closer to failure, so more shocks are possible.
By Shinji Toda, Ph.D., IRIDeS, Tohoku University, Sendai, Japan and Ross S. Stein, Ph.D., Temblor, Inc.
Citation: Toda, S., Stein, R., 2021, Recent large Japan quakes are aftershocks of the 2011 Tohoku Earthquake, Temblor, http://doi.org/10.32858/temblor.175
Three major earthquakes have struck offshore Sendai and Fukushima, Japan, in the past three months. The first two, both magnitude-7.1, occurred on February 13 and March 20. The latest, a magnitude-6.9, occurred on May 1. The three quakes struck within 60 miles (100 kilometers) of each other and were strong enough to rattle major population centers of northern Honshu, Japan’s main island. These were just a few of the thousands of quakes that have struck the region in the last decade — since the Great Tohoku Earthquake.

The massive and long-lived impact of the Tohoku earthquake
The extent to which the 2011 magnitude-9.0 Tohoku earthquake changed the seismic landscape throughout northern Honshu and the Japan Trench is truly astonishing. Both coastal and offshore areas show a much higher earthquake rate during the 10 years following the Tohoku event than the 10 years before. This can be seen by comparing the area around each epicenter in the right panel to those same areas in the left panel below. Even today, the rate of earthquakes is well above the pre-2011 level.

When one plots the cumulative number of earthquakes with time (below), an immediate jump and ‘Omori’ decay is seen that is typical of aftershocks. Omori decay is named after its discoverer in 1894, Fusakichi Omori. Immediately after the Tohoku earthquake, which struck 62 miles (100 kilometers) to the east of the recent magnitude-7 shocks, the seismicity rate of magnitude-3.0 and larger quakes jumped by more than a factor of 100. In February 2021, when the first in this latest series occurred, it was still five times higher than before the Tohoku quake. During the 90 years before the Tohoku quake, the rate of magnitude-6.8 and larger shocks within the box above was 0.58 per year; in the decade since the Tohoku shock, it has been 2.04 per year (3.5 times higher), and during the short span since February 13, it has been 13.5 per year (another 6.5 times higher).

In our judgment, these earthquake rate increases are caused by ‘Coulomb’ stress transfer from the magnitude-9.0 event, which brought surrounding faults closer to failure (Toda et al., 2011). The Coulomb stress change theory assumes that unclamping a fault or increasing its shear stress — or both — promotes fault failure; clamping it or decreasing the shear stress inhibits failure. Studies have found this can explain many features of aftershocks and progressive mainshocks (e.g., Harris, 1998; Stein, 1999).
Were the three recent quakes falling dominoes?
So, if the magnitude-9 promoted the recent magnitude-7 quakes, did they promote each other in a chain reaction? Here, the observations become more enigmatic. When we look at how seismicity in the vicinity of the future March 20 and May 1 quakes responded to the February 13 event, we see nothing, as shown below (the blue and red curves show no changes at the time of the February 13 event). But after the March 20 event, there was a three-day burst of seismicity at the site of the future May 1 event, although it quickly returned to normal (black curve at the time of the March 20 event).
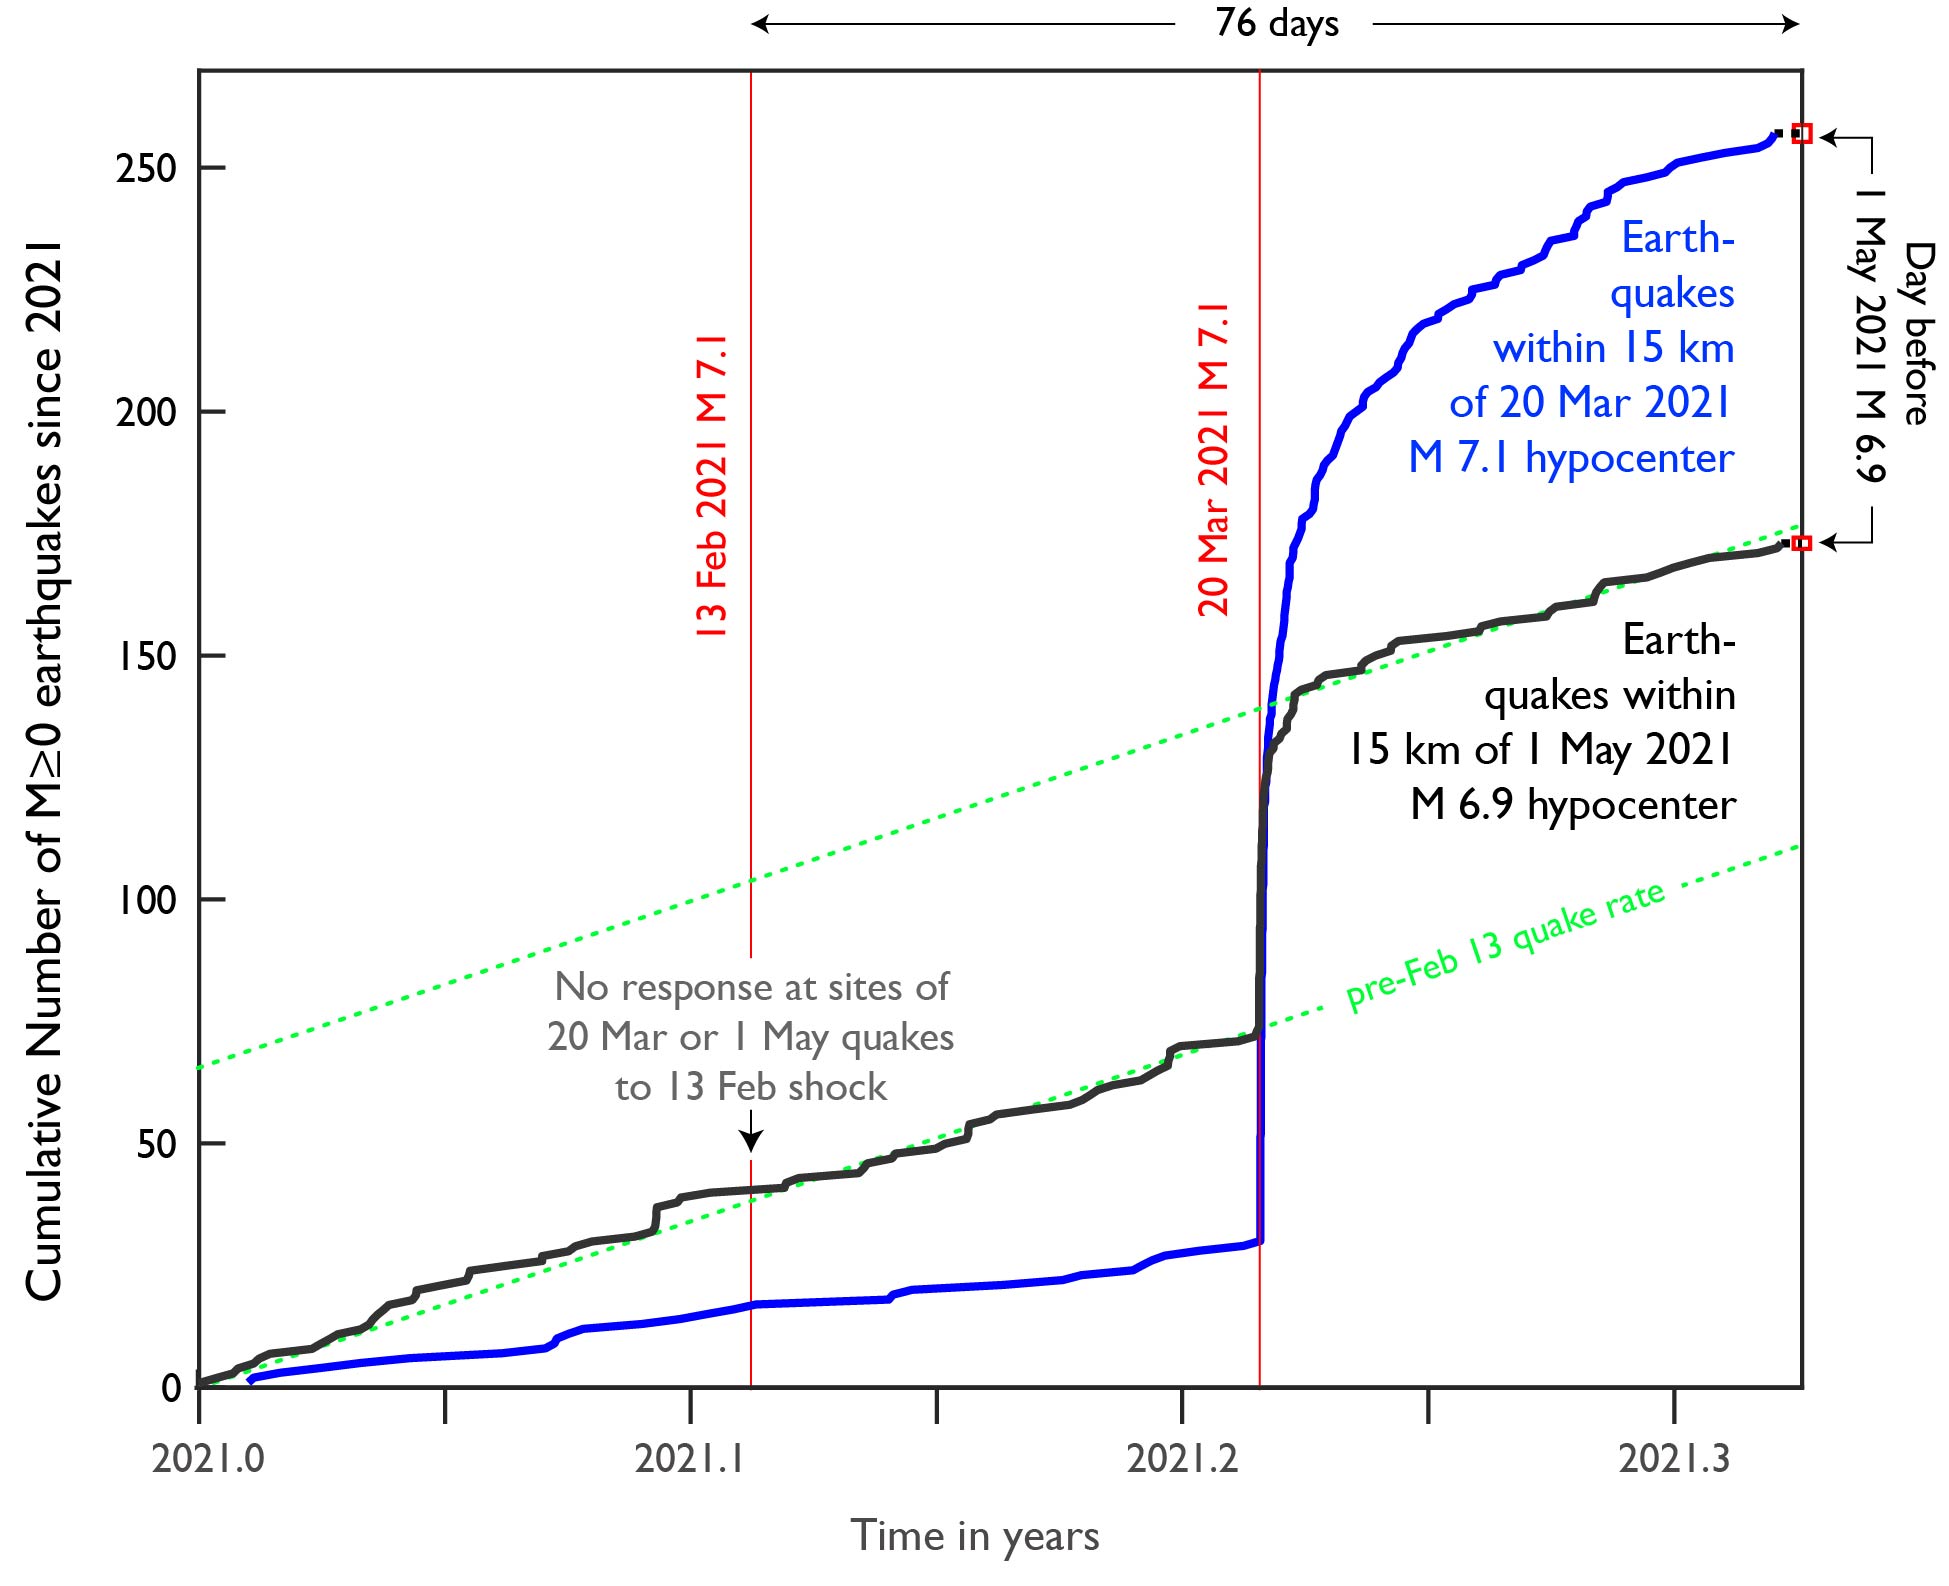
The response of seismicity at the future May 1 site to the March 20 event is consistent with a calculated stress increase (by about 0.25 bars). For reference, we put about 7 bars of pressure in our bicycle tires, so while 0.25 bars is small, studies show that earthquakes respond to stresses of about 0.10 bars or more. The absence of a change in seismicity following the February 13 quake nevertheless astonishes us because we calculate that the quake increased the Coulomb stress on faults near the May 1 event (by about 0.30 bars) and slightly increased the stress on the faults near the March 20 event (by about 0.05 bars). So, we would have expected a seismicity increase at the May 1 site, and possibly at both sites.
We can visualize the calculated stress changes with beachballs, as shown below (Toda and Stein, 2020). “Beachballs” — technically called “focal mechanisms” — are a visual representation of the orientation and sense of slip on active faults. In the figure below, a red beachball means that a particular fault was brought closer to failure in our calculation as a result of an earthquake; a blue beachball means that failure was inhibited. Each panel in the figure shows this transfer of stress from a given event.

Elements of a chain reaction
We can confidently assert that all three magnitude-7 events are aftershocks of the 2011 magnitide-9.0 Tohoku earthquake. Its aftershock sequence is far from over, and more large events could occur, although probably not at the rate we have seen over the past 80 days, which is unprecedented.
The February 13 shock slightly promoted the site of the March 20 shock, but there was no detectable seismicity increase. So, the second shock’s proximity in space and time to the first could have been coincidence, or we may have missed its response because the detectability of small earthquakes offshore is limited. But there is a clear seismicity response of the second event to the third, consistent with its large calculated stress increase. So, the triggering of the third quake by the second looks clear.
The bottom panel of the last figure shows that a lot of red beachballs remain, particularly to the northeast of the May 1 event. So, even though the third event was smaller than its predecessors, and even though the quake rate in this sequence is extremely high, we may not have seen the end of this extraordinary sequence.
Acknowledgements. We are grateful to JMA (Japan Meteorological Agency) and NIED (National Research Institute for Earth Science and Disaster Resilience) for the data used in this study.
References
Hardebeck, Jeanne L., Julie J. Nazareth, and Egill Hauksson (1998), The static stress change triggering model: Constraints from two southern California aftershock sequences, J. Geophys. Res. 103, doi: 10.1029/98JB00573.
Harris, Ruth A. (1998), Introduction to special section: Stress triggers, stress shadows, and implications for seismic hazard, J. Geophys. Res., 103, 24347–24358, doi:10.1029/98JB01576.
Stein, Ross S. (1999), The role of stress transfer in earthquake occurrence, Nature, 402, 605-609, doi.org/10.1038/45144
Toda, Shinji, Ross S. Stein, and Jian Lin (2011), Widespread seismicity excitation throughout central Japan following the 2011 M=9.0 Tohoku earthquake and its interpretation by Coulomb stress transfer, Geophys. Res. Lett. 38, doi:10.1029/2011GL047834.
Toda, Shinji, and Ross S. Stein (2020), Long- and short-term stress interaction of the 2019 Ridgecrest sequence and Coulomb-based earthquake forecasts, Bull. Seismol. Soc. Am., 110, 1765-1780, doi: 10.1785/0120200169
- Venezuela’s doublet leaned toward Caracas - June 30, 2026
- Is Southern California’s Cajon Pass an ‘earthquake gate’ ready to open? - June 29, 2026
- Philippines magnitude 7.8 shock may have loaded the central Cotabato subduction zone - June 11, 2026