Alberto M. López, K. Stephen Hughes, and Elizabeth Vanacore
Department of Geology, University of Puerto Rico – Mayagüez
Puerto Rico Seismic Network, University of Puerto Rico – Mayagüez
Citation: López, A.M., Hughes, K.S., & Vanacore, E. (2020), Puerto Rico’s Winter 2019-2020 Seismic Sequence Leaves the Island On Edge, Temblor, http://doi.org/10.32858/temblor.064.
The largest shock in Puerto Rico in 100 years struck on a fault discovered only several years ago. The swarm-like earthquake sequence, with a M 5.8 foreshock and two large aftershocks so far, caused extensive damage and, unfortunately, may not be over.
The largest quake in a century
On December 28, 2019, the southwestern region of the island of Puerto Rico — located in the northeastern corner of the Caribbean plate — began to experience an increase in seismicity. It started with an M 4.7 event that rattled a population that has not experienced a significant damaging earthquake in their lifetime. That is because the last major event to affect the island was an M 7.2 in 1918 (Doser et al., 2005). Although there are two main fault systems that cross the island in a roughly east-to-west fashion, it is the southwest tip of the island where most seismicity occurs as evidenced by more than four decades of seismic monitoring by the Puerto Rico Seismic Network. Since the December 28, more than 14 earthquakes of M 4.5 or greater and hundreds of smaller events have been felt and recorded. The strongest of these events have been the M 5.0 (29 Dec), the M 5.8 (6 Jan), and the M 6.4 and 6.0 both on 7 Jan. The January 6th event during the early morning surprised many children opening their gifts as part of the traditional Three Kings Day (Epiphany), and placed the entire population of Puerto Rico on alert. Less than 24 hours later, the larger M 6.4 event occurred, causing locally catastrophic damages to structures in the south coast region of the island and widespread anxiety among the population.

Interestingly, the year 2019 proved to be the year with the highest seismic activity recorded by the Puerto Rico Seismic Network. With 6,517 events (171 with M>3.5), the year 2019 saw almost twice the amount of events located to that of an average year since 2014. The reason for this increase is the end of year sequence in southwestern Puerto Rico, and the seismic sequence associated to the M 6.0 Mona Canyon event of Sept 23, which so far includes 1,227 located aftershocks. Although the M 6.0 sequence might indicate a change in the tectonic motions in the region, it was farther away from Puerto Rico and as such was not felt as strongly as the current activity in the southwest.

Extensive damage
The majority of the seismicity has been offshore by a few kilometers, but residents along the southern coast closest to the epicentral area have felt moderate to strong shaking up to a Mercalli Intensity of VII to VIII (very strong to severe shaking) during the M 6.4 on 7 Jan. The very shallow quake depths have made the shaking more evident for the population. The strongest shaking events have resulted in the collapse of several houses built on stilts, as well as the partial collapse of both the historic church in Guayanilla and the abandoned Spanish lighthouse in Guánica. At least one death attributed to the M 6.4 quake has been reported, a result of a collapsed wall that fell on a man sleeping in his house in Ponce. People that have evacuated destroyed or severely damaged homes have been provided temporary shelter, although many of them do not trust the structural integrity of the shelter centers and prefer to stay outdoors. Psychological counseling and services have been arranged for those who need them.
#TemblorPR [VÍDEO] Mientras un ciudadano grababa cómo quedó la Parroquia Inmaculada Concepción de Guayanilla, hubo una réplica y más paredes de la estructura se cayeron. pic.twitter.com/5D2Ce0VvZX
— V. Torres Montalvo 📲 (@Motinsitepegas) January 7, 2020
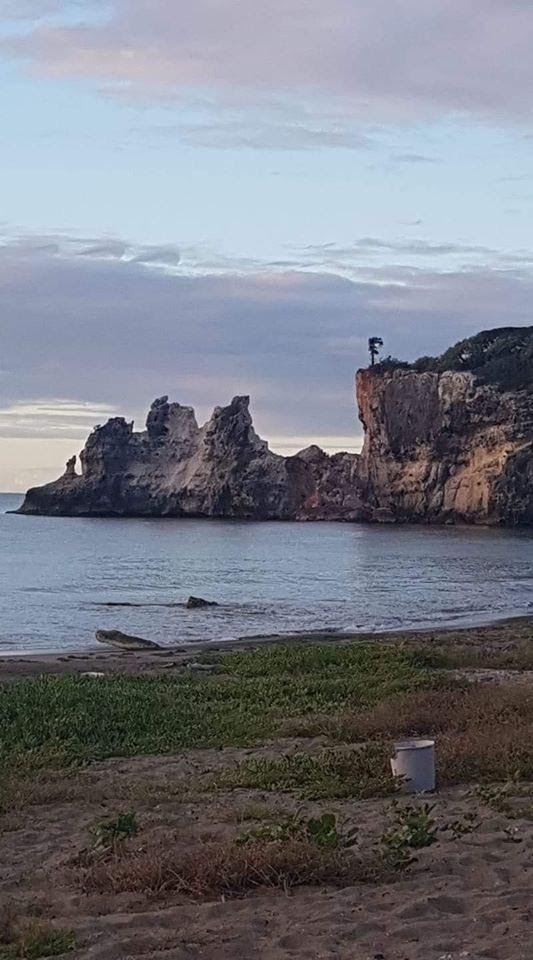
Additionally, the ground movement has also provoked rock falls in the south coast limestone bedrock. The blocks of limestone scattered across roadways and also impacted houses. Sadly, the scenic natural rock formation known as the Punta Ventana (‘Window point’) in Guayanilla collapsed during the M 5.8 event of 6-Jan.
Although no major tsunami has been generated, a local rise of around an inch in sea level was reported just west of the epicentral area in La Parguera by the Caribbean Tsunami Warning Program. The possibility of submarine landsliding has been a popular talking point given its proximity to land, its shallow rupture and higher magnitude potential. A submarine landslide is exactly what it sounds like: a slide of sediment and rock on the ocean floor which is capable of producing localized tsunami.


A newly recognized fault
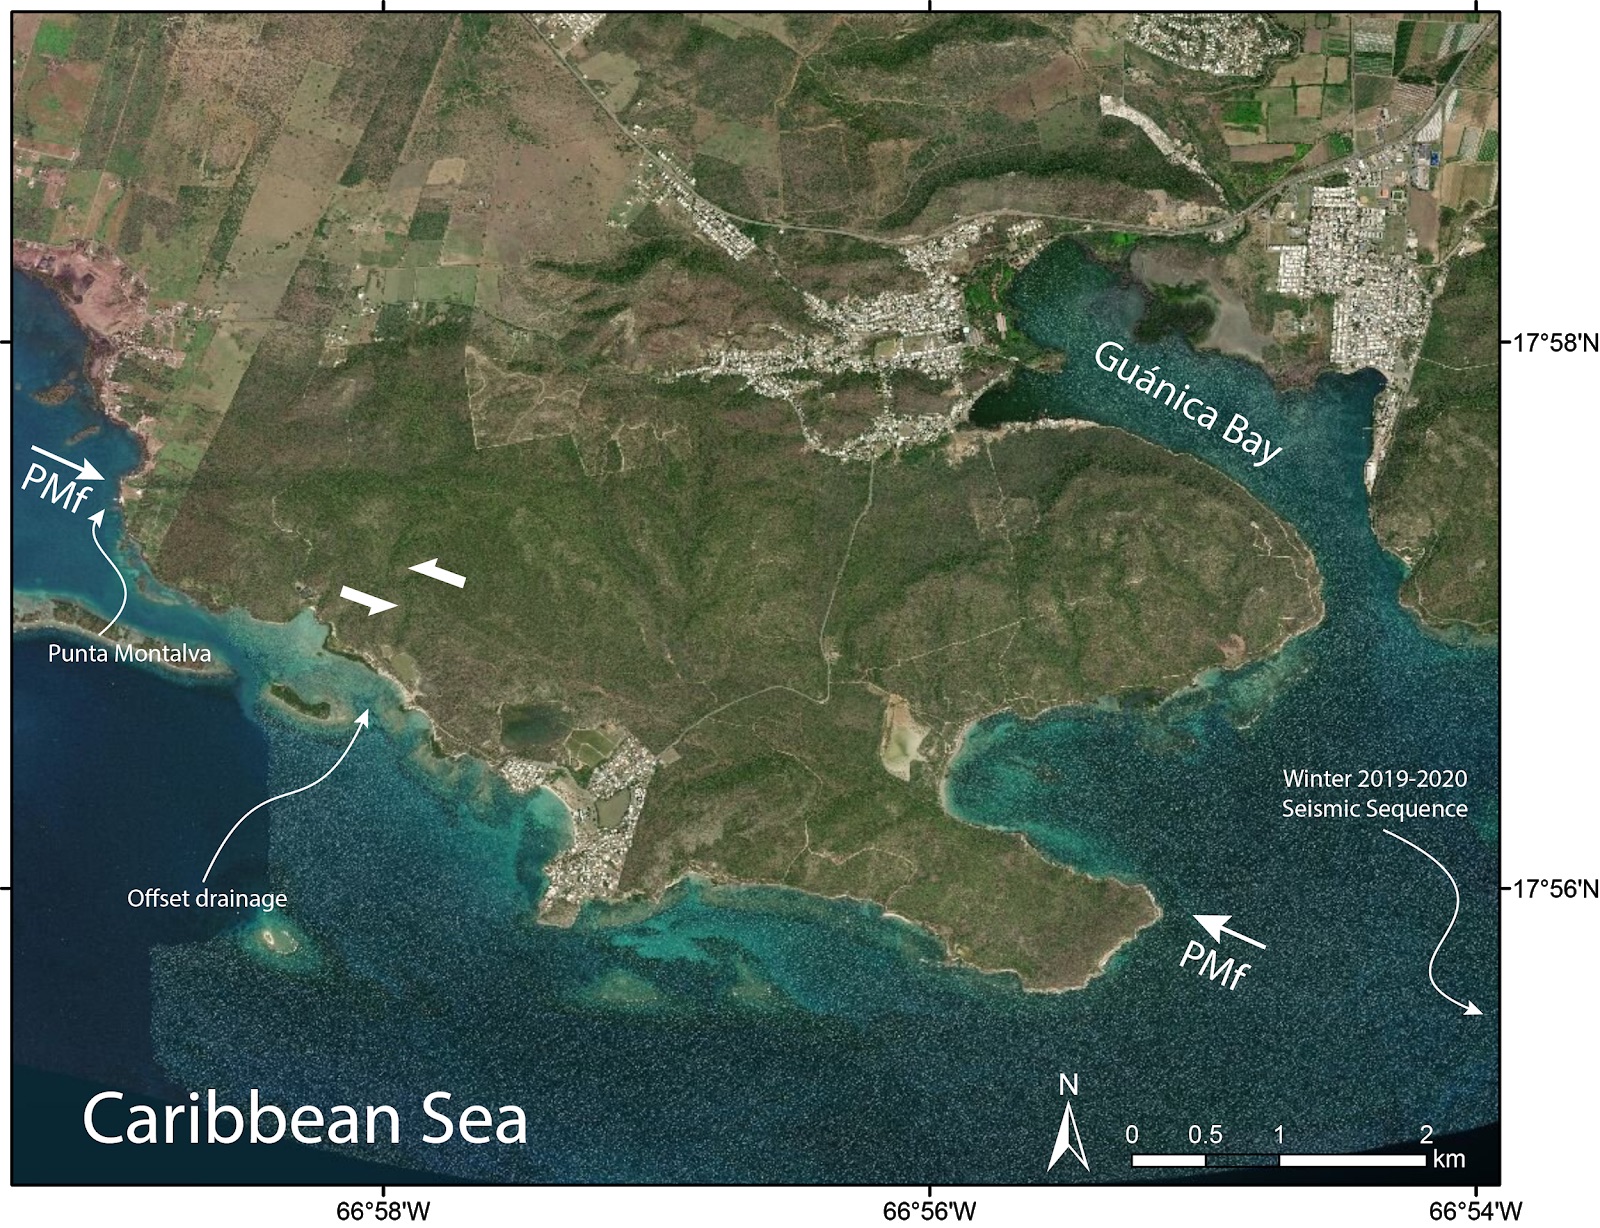
The first decade of the millennium sparked an increased interest in the past sliding of faults on the island of Puerto Rico — a field of earthquake science known as ‘paleoseismology’. Inspired by recently acquired LIDAR (Laser radar topographic) data, Prentice and Mann (2005) dug up trenches on a fault across the Lajas Valley in southwestern Puerto Rico. These trenches allow scientists to identify offsets and other clues that the fault has slipped in the past. Their findings suggested activity on the South Lajas Valley fault (SLVF), at its western terminus near the Bay of Boquerón, within the last 12,000 years. However, the fault’s eastward extension was difficult to follow and identify, primarily due to the thick young sediment cover of the Lajas Valley. Shortly after, a renewed effort was put forward by professors of the Geology Department of the University of Puerto Rico to understand better the seismic potential of this region. A new fault was identified using a plethora of geophysical (Roig et al., 2013 ; Adames, 2017) and geological (Addarich-Martinez, 2009) analyses. The discovery of the North Boquerón Bay – Punta Montalva fault was important because it was not in the USGS fault database for Puerto Rico, and even then scientists knew it posed a serious threat to the nearby population. The current seismicity appears to represent activation of a further southeasterly seaward extension of this relatively newly recognized fault.


What next?
Local media has reported that there are approximately 100,000 housing structures built on stilts in Puerto Rico, and approximately 95% of public school buildings have been built prior to the existing building code currently in use. Both of these categories of buildings are especially vulnerable to shaking. Such a statement is particularly worrisome because a school has already collapsed after the 7 Jan M 6.4 event, and classes are due to resume in the coming days. Fear of what has just been lived and anxiety about what may happen is evidently worrisome for the population, who have preferred to sleep outdoors.

Unfortunately, we still don’t know whether the M 6.4 event was the mainshock event or if it will become another precursor in the sequence. The swarm-like character of the sequence also suggests that it could continue. One thing is certain, that after feeling aftershocks all day, we are on edge and uncertain about what will happen next.
References
Adames, A., 2017, Geomorphic and geophysical characterization of the north Boquerón Bay-Punta Montalva fault zone: A capable fault system in southwestern Puerto Rico. M.Sc. Thesis, Department of Geology, University of Puerto Rico, Mayagüez
Addarich-Martinez, L. 2009, The geologic mapping and history of the Guánica Quadrangle, southwestern Puerto Rico, M.Sc. Thesis, Department of Geology, University of Puerto Rico, Mayagüez.
Doser, D.I., Rodriguez, C. M., and Flores, C., 2005, Historical earthquakes of the Puerto Rico – Virgin Islands region, in Mann, P., ed., Active tectonics and seismic hazards of Puerto Rico, the Virgin Islands, and offshore areas: Geological Society of America Special Paper 385, p. 103-114.
Prentice, C., S., and Mann, P., 2005, Paleosismic study of the South Lajas fault: First documentation of an onshore Holocene fault in Puerto Rico, in Mann, P., ed., Active tectonics and seismic hazards of Puerto Rico, the Virgin Islands, and offshore areas: Geological Society of America Special Paper 385, p. 215-222.
Roig-Silva, C. M., Asencio, E., and Joyce, J., 2013, The Northwest Trending North Boquerón Bay-Punta Montalva Fault Zone; A Through Going Active Fault System in Southwestern Puerto Rico.
- Dual disaster planning, communication and reason for hope: a discussion with professor Sam Montano - April 14, 2020
- Significant Idaho earthquake unlikely to cause unrest in Yellowstone - March 31, 2020
- Earthquake strikes Utah amid COVID-19 pandemic - March 18, 2020