A preliminary analysis shows that the fault that slipped in December’s destructive magnitude-6.4 Petrinja earthquake slipped about 10 feet (three meters).
By Athanassios Ganas, National Observatory of Athens, Institute of Geodynamics
Panagiotis Elias, National Observatory of Athens, Institute of Astronomy, Astrophysics, Space Applications and Remote Sensing
Sotiris Valkaniotis, Koronidos Str., 42131, Trikala, Greece
Varvara Tsironi, National Observatory of Athens, Institute of Geodynamics; University of Patras, Department of Geology
Ilektra Karasante, National Observatory of Athens, Institute of Geodynamics
Pierre Briole, École Normale Supérieure de Paris, PSL Research University, Laboratoire de Géologie
Citation: Ganas, A., Elias, P., Valkaniotis, S., Tsironi, V., Karasante, I., Briole, P., 2021, Petrinja earthquake moved crust 10 feet, Temblor, http://doi.org/10.32858/temblor.156
*Editor’s note: The summary is written for a general audience. Those interested in a more detailed analysis should read the full article.
Summary
On December 29, 2020, at 11:19 UTC, a strong, shallow earthquake rocked the central region of Croatia. The epicenter was located near the town of Petrinja, about 25 miles (40 kilometers) to the south of the capital, Zagreb. The earthquake was a magnitude-6.4 on the moment magnitude scale according to U.S. Geological Survey (USGS). The effects of the earthquake were devastating in neighboring villages and towns. Seven people died and many others were injured.
Here we present a preliminary analysis of the geodetic data that were gathered and processed as of January 20, 2021, and present preliminary estimates of the slip that occurred on the fault during the earthquake and subsequent aftershocks.
InSAR, or Interferometric Synthetic Aperture Radar, is a method of using imagery collected by a radar satellite to measure small ground motions. During repeating passes of a satellite, Synthetic Aperture Radar (SAR) images are taken over an area. The technique is used to measure how much the ground has moved roughly vertically, or in the line-of-sight of the satellite, between each pass of the satellite. If images are taken before and after a major earthquake, InSAR can give a clue as to how much slip occurred on the fault. These images are freely distributed by the European Space Agency (ESA).
Global Navigation Satellite System (GNSS) data from five ground stations surrounding the epicenter were provided by the EUREF Permanent GNSS Network (EPN). GNSS data comprise 3D ground-to-satellite distance measurements (at least four are necessary to compute a position on a sphere) that are highly accurate, therefore any change in the antenna position due to seismic wave arrivals is easily detectable.
By comparing InSAR images taken 11 days before and the day after the magnitude-6.4 earthquake, we find that the ground across the fault moved about 18 inches (45 centimeters) in the line-of-sight direction. We assume that the majority of that motion occurred during the earthquake on December 29. In the seven days following the earthquake, the ground across the same fault moved about an inch (2 centimeters). We simulated faults with different parameters including length, depth, angle, amount of slip and others to find one that best fit these observed data.

Our preliminary analysis indicates that the rupture occurred on an approximately five-mile-long (eight-kilometer) west-dipping right-lateral strike-slip fault located beneath the NW-SE mountain ridge that runs west of Petrinja. In this case, the fault slipped about 10 feet (three meters), which seems large but is not uncharacteristic of faults with strong frictional resistance and long recurrence intervals. The best-fitting upper edge of the fault rupture is at a shallow depth of just over half of a mile (one kilometer), which indicates that the rupture did not reach the surface. These results give us a better idea of where active faults are located in central Croatia, allowing for better estimates of future seismic hazards.
Ground deformation and slip history due to 29 December 2020 Mw 6.4 Petrinja earthquake (Croatia) imaged by InSAR
Introduction
Croatia is located in the northeast edge of the Adria-Eurasia collision zone, a well-known compressional area (Anderson and Jackson, 1987; Grenerczy et al. 2005; Benetatos and Kiratzi, 2006; Bennett et al. 2008; Herak et al. 2009; Métois et al. 2015). The kinematics of the plate motions are determined by the on-going collision of the Adria continental block with Eurasia following the closure of several oceanic basins during Cretaceous through Eocene – Oligocene and the formation of south verging orogens such as the Eastern Alps and the Dinarides. Central and northern Slovenia and Croatia are deforming by seismic slip along strike‐slip and thrust faults (e.g., Grenerczy et al. 2005; Ganas et al. 2008; Herak et al. 2009), and a belt of intense NE–SW shortening continues south along the coast from Croatia into Montenegro and Albania (Benetatos and Kiratzi, 2006; Bennett et al. 2008; Métois et al. 2015). Crustal shortening is accommodated by a combination of reverse-slip and strike-slip motions along active faults, especially in external Dinarides (Bennett et al. 2008; Herak et al. 2009). In terms of strain, the amount of crustal shortening between Adria and Eurasia is ~ 4 mm/yr according to Battaglia et al. (2004) and Bennett et al. (2008), based on inversion modeling from GNSS velocities. Crustal strain rates range from 10-30 ns/yr, increasing landwards towards Zagreb (Métois et al. 2015).
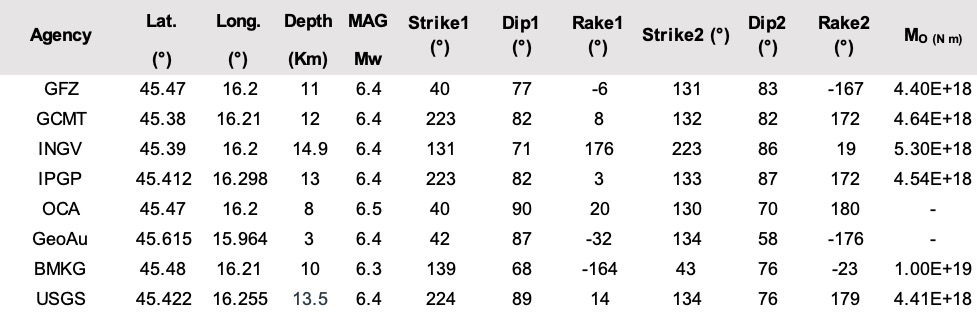
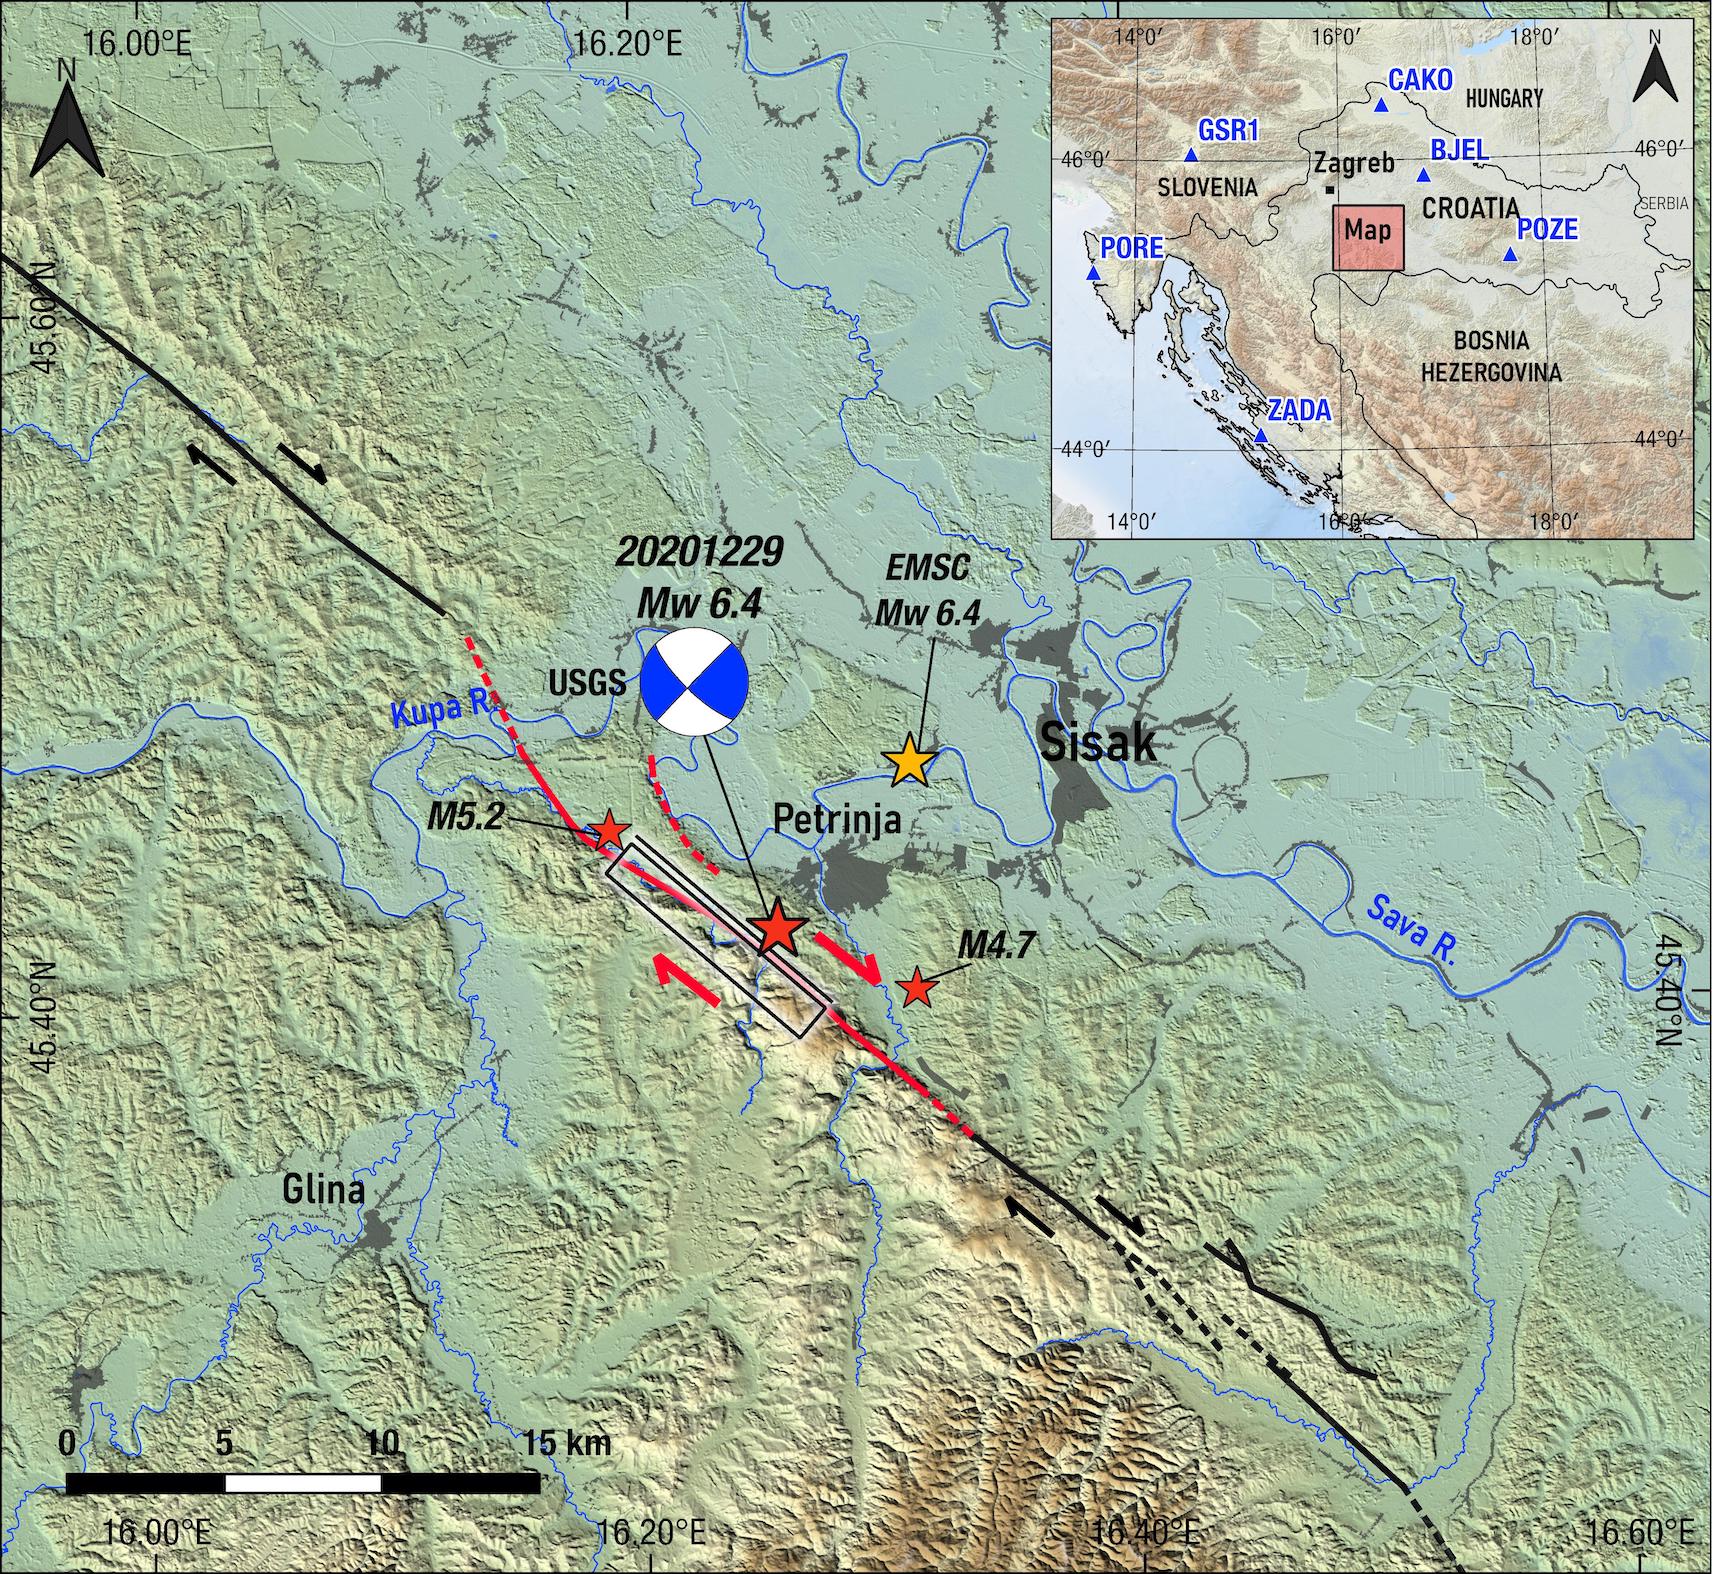
The Mw=6.4 earthquake of December 29, 2020, 11:19 UTC occurred west of the town of Petrinja (Figure 1), along a NW-SE striking transcurrent fault, as indicated by the distribution of aftershocks (compiled by EMSC) and moment tensor solutions of seismological data. As of January 18, 2021, more than 486 aftershocks with 1.0≤ML<6.4 were recorded by EMSC (Figure 2). One day before the mainshock, two moderate-size foreshocks occurred. The first struck on December 28, 2020, at 05:28 UTC (Mw=4.8 GFZ), and was followed by a Mw=4.4 at 06:49 UTC. The moment tensor solutions of the mainshock (Table 1) indicate NW-SE strike-slip faulting in agreement with the regional tectonics. The aftershock sequence extends over a distance of 30 km oriented SE-NW, with most of the events occurring to the northwest of the mainshock (Figure 2a). The EMSC aftershock data (the cumulative rate plot; in days from main shock) show the rate of the sequence decreasing after January 3, 2021 (Figure 2c). The earthquake raised the probabilities for a strong event closer to Zagreb by a factor of three (Stein and Toda, 2021) because of Coulomb stress transfer to neighboring faults.

Sentinel-1 Interferograms
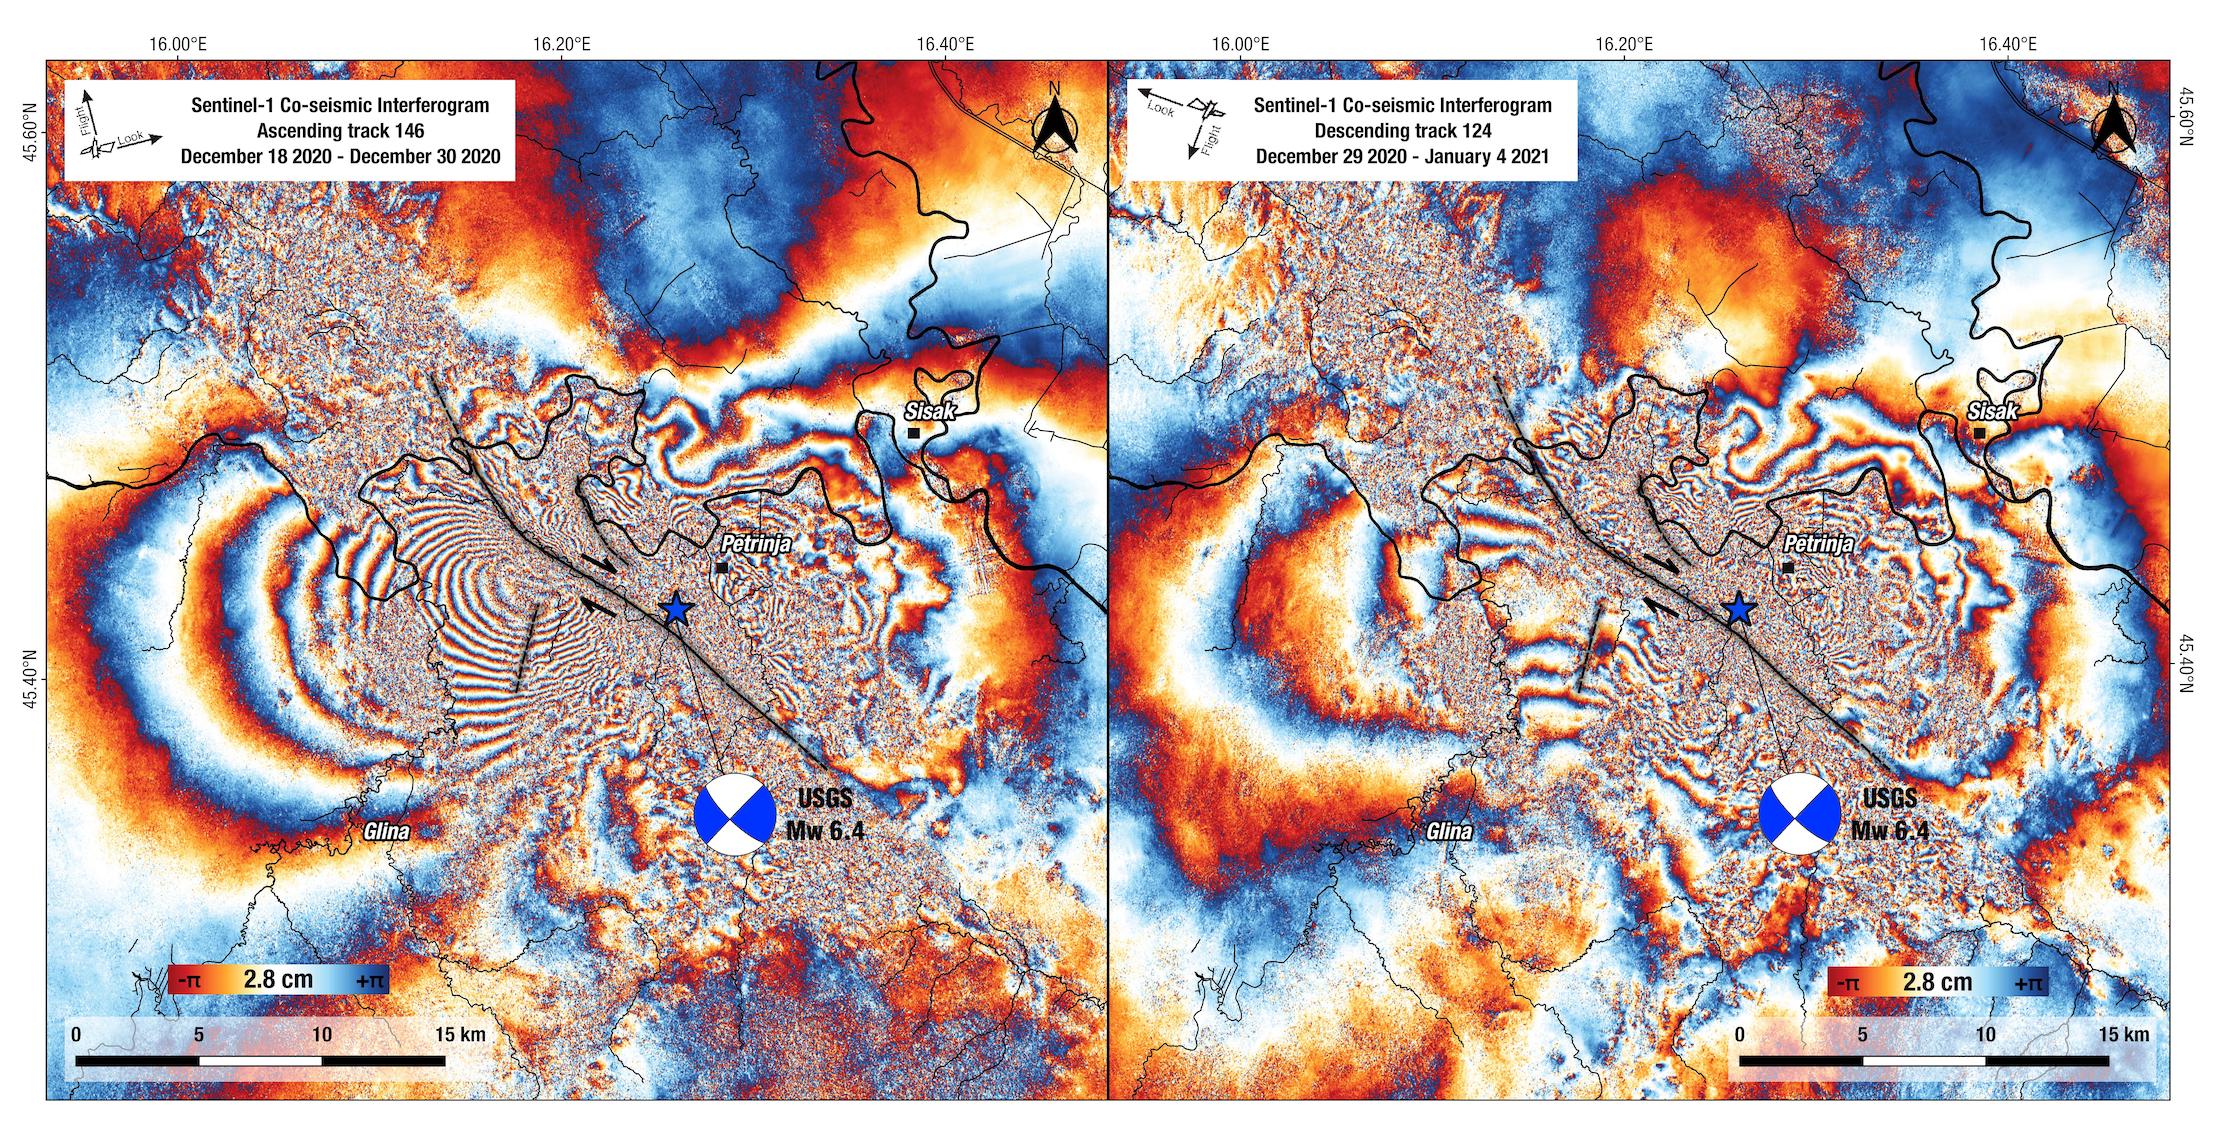
We used both the ascending and descending images acquired by the European Sentinel-1 satellites on Dec. 18 and Dec. 30 on track 146, and on Dec. 29 05:02 UTC and Jan. 4, 2021 on track 124. The interferograms (Figure 3) were made using the Automatic Interferometric Processing Station (AIPS) at NOA and ESA’s SNAP software version 8.0. The digital elevation model (DEM) used for the processing is the Shuttle Radar Topography Mission (SRTM) 1 Arc-Second Global (Digital Object Identifier number: /10.5066/F7PR7TFT). We enhanced the signal-to-noise ratio by applying the adaptive power spectrum filter of Goldstein and Werner (1998) with a coherence threshold of 0.3. The quality of the interferograms varies, both in terms of coherence and tropospheric noise. The interferograms show more than 15 fringes corresponding to ground deformation both west and east of Petrinja resembling the “butterfly” pattern, characteristic of strike-slip ruptures (e.g., Massonet et al. 1993). The interferograms (Figure 3) show an asymmetric, four‐lobed pattern, centered on a NW‐SE oriented discontinuity that is nearly coincident with an incoherent band in the interferograms. On the ascending interferogram (Figure 3, left panel; track 146), the western lobes are larger in size than those in the east, with the north‐west quadrant moving towards the satellite (along the so-called line-of-sight; l.o.s.) by ∼45 cm. The sense of ground motion across the discontinuity (the fault) indicates right-lateral rupture, in agreement with published moment tensor solutions (Table 1). East of the discontinuity, the phase changes are smaller, but spread out over a wide area. These range changes are due to the co-seismic displacement on either side of the fault – although we cannot rule out the possibility of rapid postseismic deformation, we expect such an effect to be small. We also note that while far-field interferometric fringes east of the main rupture (footwall) are consistent with the modeled dextral slip, fringes closer to the rupture are less consistent (or missing) – a hint of possible large scale gravitational displacements due to strong ground shaking such as lateral spreading.
The absolute value of the interferometric fringes is estimated by a) the zero of the observations as it appears in the far field (although disturbed by the troposphere) b) the compatibility of this zero with the prediction of the forward model at the first order and c) the joint compatibility of the observations from ascending and descending tracks. After modelling, the seismological moment and the geodetic moment are very consistent. This is an additional indication that the zero was estimated correctly. We suggest that with this method, the zero-motion estimated is correct within ±5 mm (~1/5 of a fringe). We extracted the l.o.s. displacements by picking the fringes on Figure 3 at 511 (329 ascending and 182 descending) locations in total. The fringe pattern is interpreted as a result of co-seismic motion along a dextral strike-slip fault, running NW-SE and dipping to the west.
Finally, one of the exceptionally unique observations from this earthquake is the large number of fringes. Inversion modelling allows us to estimate parameters that usually cannot be estimated, in particular the azimuth and dip angles, the fault width and the rake. So, InSAR adds value and this is very marginally depending on the location uncertainties on the zero of the fringes.
Co-seismic motion of the GNSS stations
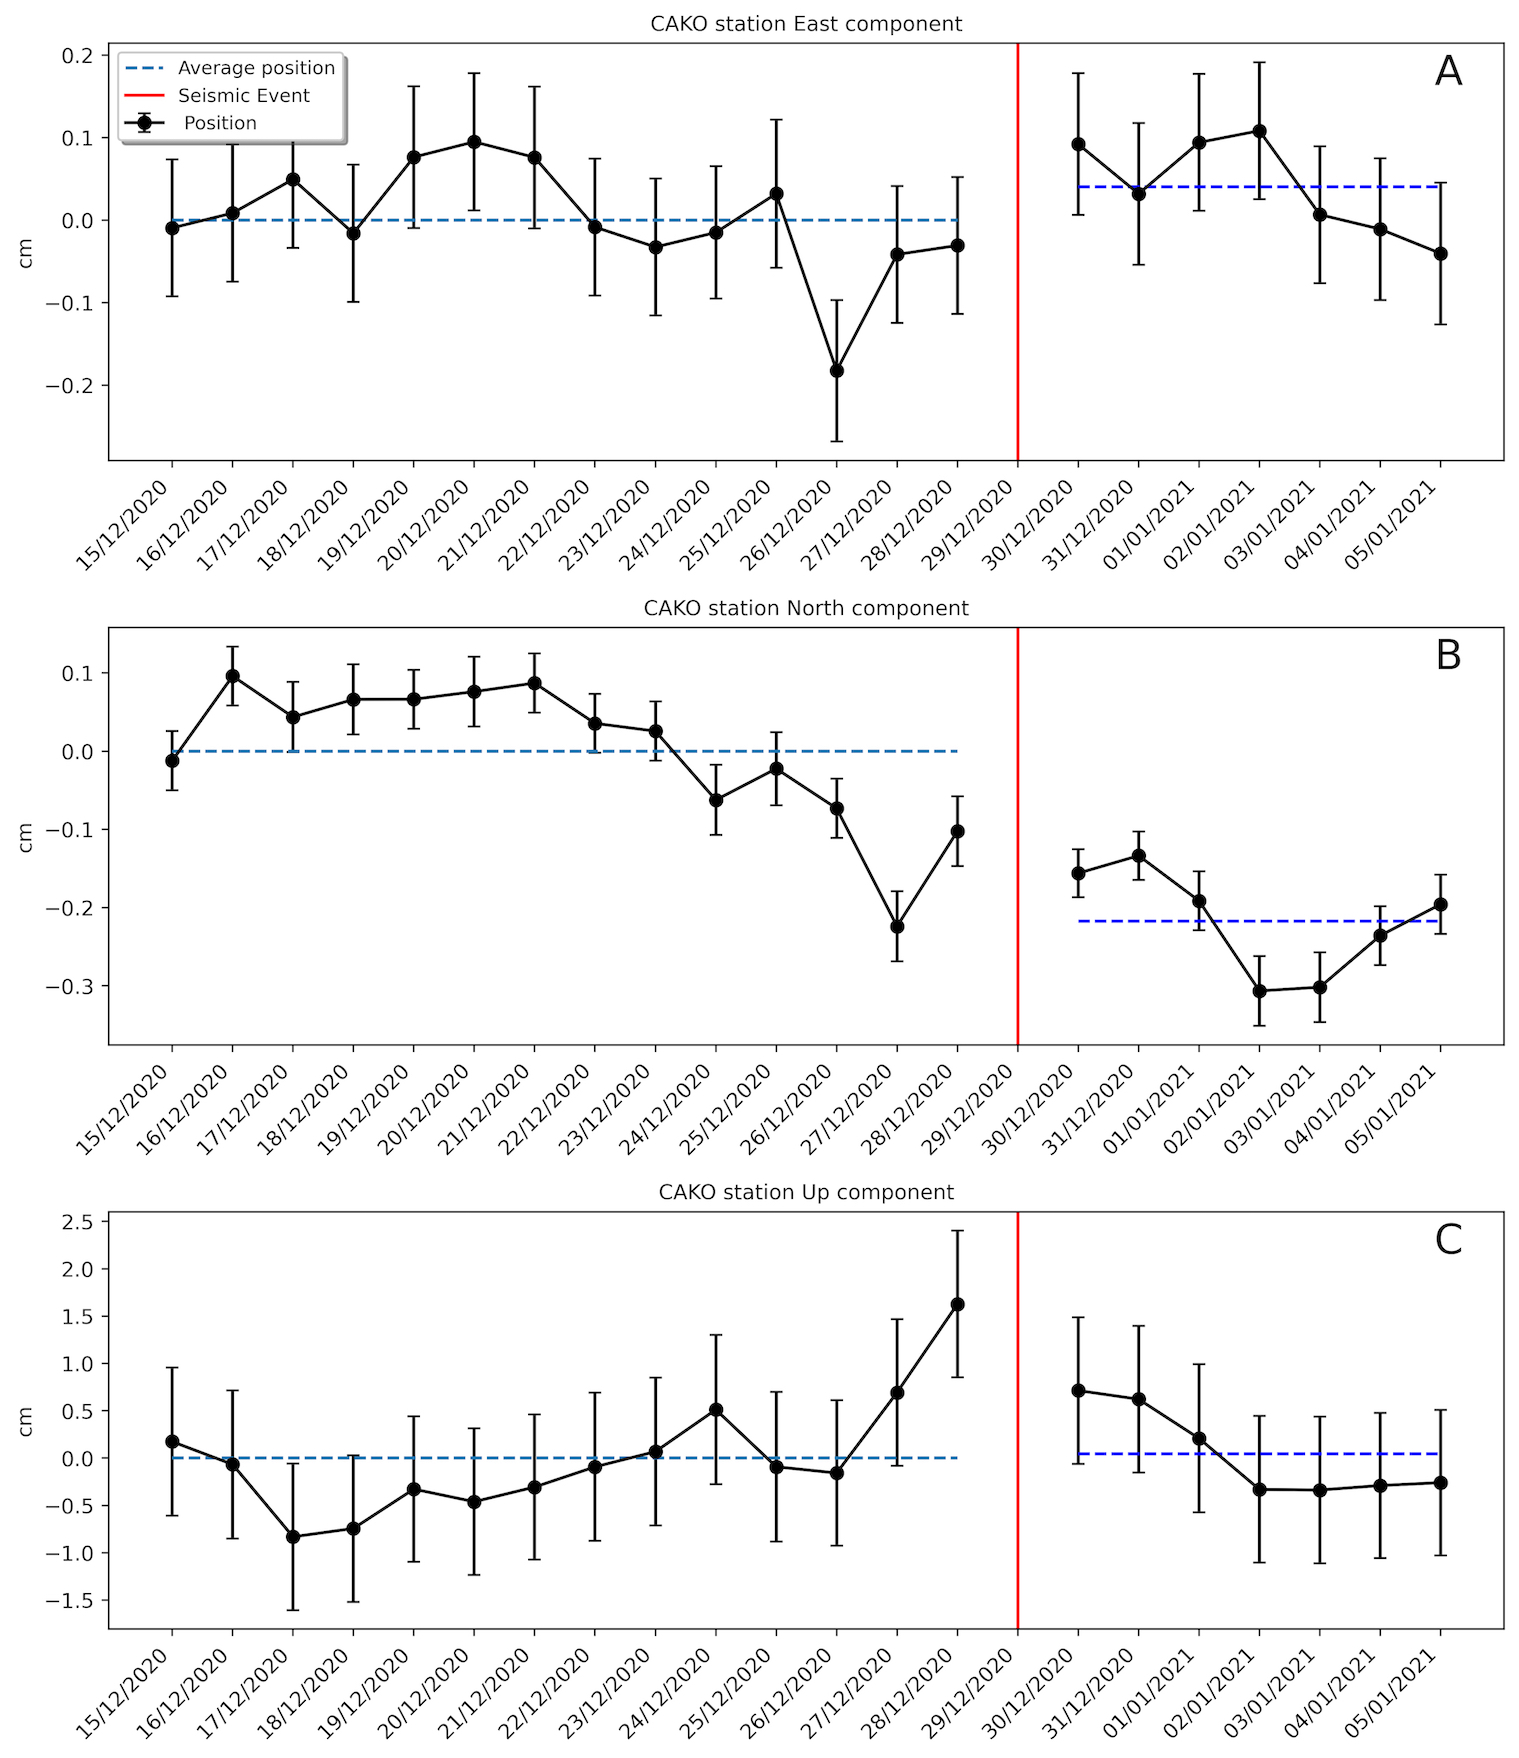
We analyzed the data of five GNSS stations belonging to the EUREF/EPN public network (Figure 1). The stations are located between 108 km and 209 km from the epicenter (Figure 1) and could have detected co-seismic motions, although marginally, as documented by scaling relationships between earthquake magnitude and ground displacements (Melgar et al. 2015; Ganas et al. 2018). The data comprise dual-frequency observations (pseudorange and phase; 30-s interval) supplied as daily files (format rinex v2.11 & v3.04). The processing was performed using the CSRS (Canadian) online processing PPP service. The coseismic displacements are listed in Table 2 (using data for the period Dec. 15, 2020 – Jan. 5, 2021), and Figure 4 shows the time series at CAKO (Cakovec, Croatia). The GNSS displacements are very small (less than 1 mm) at the horizontal components except for station CAKO where a motion of ~2.1 mm towards the south was detected. CAKO is located to the NE of the epicenter (Figure 1), so this motion is in agreement with rupture kinematics. The offsets at the vertical component are up to an order of magnitude less than the error (Table 2), as expected given the distance of the stations to the epicenter and the kinematics of the rupture. We could not see in the GNSS data evidence for any pre- and/or post-seismic deformation, and in particular there is no offset at the time of the large foreshock on December 28, 2020, 05:28 UTC (Mw=4.8 GFZ). In consequence, we assume that the interferograms (Figure 2) contain coseismic signal only with insignificant post-seismic fault slip.

Fault model
We use the InSAR l.o.s. displacements to estimate the fault parameters assuming that a rectangular source buried in a homogeneous elastic half-space and homogeneous slip. Our inversion approach finds the geometry and kinematics (strike and dip-angle) of best-fitting fault model. We invert the l.o.s. InSAR ground displacements using the code inverse6 (Briole, 2017). The modelling allows us to constrain seven parameters: the 3D location of the fault-top center, the fault azimuth, length and width and the amount of slip. Because of the quality and density of fringes we could invert for almost all the parameters including the angles, which is rare. The fault dip-angle of 76° was constrained by the seismological moment tensors (Table 1). The fault width is also constrained despite the lack of GNSS points in the near field because the quality of the fringes is very high and their azimuthal coverage is perfect. Our best-fitting model is with a right-lateral rupture of 8 km length and 5.1 km width, striking N129°E, (Figure 5).
The best- fitting model produced a scenario where a) the center of the top of the fault is located at 16.233°E, 45.426°N, b) the depth of the upper edge of the fault is 1.3 km below the surface, c) the fault is 5.1 km wide, d) the fault is 8 km long, e) the fault azimuth is N129°E (which is consistent with the focal mechanisms and with the geomorphology of the area) and f) the fault dips 76° to the southwest. The fit to the fringes is better with this steep dip angle than with a purely vertical fault. This is consistent with the focal mechanisms. The rupture does not appear to reach the surface and if it does somewhere undetected along strike, the amount of slip drops close to zero within the first 1 km beneath the surface.
The rupture area is small for an event of this magnitude, and therefore the finite slip is large; it is comparable to the case of the 2003 Bam earthquake (Mw=6.6; Peyret et al. 2007) or the 2011 Christchurch event (Mw=6.2; Elliott et al. 2012). However, as our model assumes a uniform slip, the model suggests that most of the slip (and therefore the energy) was released in a main patch (asperity). The right-lateral slip equals 3.2 m, which is larger than average for this magnitude. There was also a small 0.2 m component of reverse slip, which is consistent with the seismological rake of the focal mechanisms (around 172°-176°) and also with the topography (the NW-SE ridge). We obtained a geodetic moment tensor (4.45 × 10^18 N m) that is very consistent with the seismological moment tensors (Table 1). We note that in analyzing the solution space of nearly 3500 inversions, we found that all rupture lengths between 8 and 9 km, all widths between 5 and 6 km and all strike-slip amounts between 2.7 and 3.5 m are possible, with the product of the three being constant (to comply with the derived geodetic moment).

Post-seismic deformation and Fault afterslip
After large earthquakes, post-seismic deformation is often observed. This can be from a relaxation in the volume due to the viscous rheology of the crust and/or from afterslip either on the fault plane or in the immediate vicinity, as the two blocks on either side of the fault do not stop moving (for example a ~3 cm motion was detected by GNSS following the Zakynthos earthquake over a 21-day period; Ganas et al. 2020). Constraining with geodetic or other data the nature of the physical processes producing post-seismic displacements is usually a difficult task and is often unsuccessful. The Petrinja earthquake was followed by hundreds of aftershocks (Figure 2) and it is highly probable that many of them occurred on the seismic fault or its extension into the lower crust or along neighbouring segments along strike. The slip associated with these aftershocks is termed afterslip and it was also imaged by InSAR (Figure 6). In the case of this earthquake, the sharp phase transition across the NW-edge of the fault, in correspondence with the co-planar rupture plane, strongly supports a model of localized afterslip rather than distributed deformation in the volume. The afterslip has occurred by aftershocks (Figure 2) and some possible slow aseismic slip in the shallow crust, where the main rupture did not reach because of the lack of frictional resistance at shallow depths (Marone and Scholz, 1988). The InSAR sharp imaging of the afterslip on the NW edge of the rupture is in the same direction (right-lateral) as the main rupture and reached 2 cm (relative motion along l.o.s.) within one week. Moreover, the location of afterslip is in agreement with the location of most aftershocks (Figure 2). As postseismic deformation is often localized around the rupture zone, rapid post-slip imaging could help visualize the fault rupture trace and its geometry (Figure 6). In the Petrinja case, we mapped a curved shape of the post-seismic deformation at the NW-end of the main rupture, which highlights the non-planarity of faults in nature.
Therefore, results from InSAR track 073 suggest an extension of the deformation (afterslip) about 7 km towards the north and 5 km to the south of the main fault rupture (Figure 6). We note that other InSAR pairs either lacked in quality or had inconvenient time frames (for example, track 124 acquisition in the opposite orbit of 73 shown in Figure 6 was not acquired on January 5, 2021), therefore missed a direct comparison with track 73 afterslip results (2nd image obtained on January 6, 2021). Indeed, the first post-seismic descending orbit acquisition was acquired in January 10, 2021.

High rate GNSS and dynamic displacements
We processed high-rate (1-s) GNSS data records from station BJEL about 70-km east of the epicenter (Fig. 1). This station is part of the CROPOS network of Croatia. The station is located at an appropriate distance so that we can clearly detect the body wave arrivals and identify the initiation of ground motion. This is because when the antenna moves during an earthquake, the position changes can be calculated to obtain displacement seismograms (e.g. Bock et al. 2011; Ruhl et al. 2018). The GNSS data comprise phase and range observables of GPS, GLONASS and GALILEO constellations. We processed the data in kinematic mode at the CSRS-PPP platform using an elevation cut-off of 7.5°. We obtained three-component displacement waveforms that demonstrate cm-size ground motions immediately following the arrival of S-waves (Fig. 7). The dynamic displacement reached 7 cm peak-to-peak on the East-west component. The shaking lasted about 150 s.

Conclusive statements
• The 2020 Petrinja earthquake ruptured a segment of a fault that is shorter than average and with larger slip. This may at first glance be seen at odds with expected rupture sizes given the moment magnitude of the earthquake (Mw=6.4). However, the scaling relations published in the literature are only averages and the departure from those relations can easily reach 50% if not more. This event is a good example of the wide range of estimates of rupture length and slip. Indeed, in this case all parameters of the fault are well constrained by InSAR modeling. This happened thanks to the full azimuthal coverage with both ascending and descending data of good quality, which is uncommon.
• The European database of seismogenic sources (EDSF) fault database needs to be modified, as the seismic fault dips towards the west and not towards east as was modelled. Additionally, the EDSF composite seismogenic fault surface trace deviates significantly from the 2020 rupture and mapped trace from InSAR.
• Analysis of GNSS waveforms revealed that horizontal ground motion reached 7 cm (peak-to-peak).
• The InSAR imaging of the 7 km afterslip on the NW-edge of the rupture, and in particular the curved shape of the post-seismic deformation, highlights the non-planarity of faults in nature.
Acknowledgements: We thank Ross Stein, Jen Schmidt, Vanja Kastelic and Ina Cecic for comments and discussions. We are indebted to ESA, Geohazards Lab and Terradue for providing access to Geohazards Exploitation Platform (GEP) for InSAR cloud processing. Figure 2 was done with software ZMAP (Wiemer, 2001). GNSS data were provided by the EPN-EUREF network. HR-GNSS data were made available by Marijan Marjanovic (CROPOS).
References
Anderson, H. and Jackson, J. 1987. Active tectonics of the Adriatic Region. Geophysical Journal of the Royal Astronomical Society, 91: 937-983. https://doi.org/10.1111/j.1365-246X.1987.tb01675.x
Basili R., Kastelic V., Demircioglu M. B., Garcia Moreno D., Nemser E. S., Petricca P., Sboras S. P., Besana-Ostman G. M., Cabral J., Camelbeeck T., Caputo R., Danciu L., Domac H., Fonseca J., García-Mayordomo J., Giardini D., Glavatovic B., Gulen L., Ince Y., Pavlides S., Sesetyan K., Tarabusi G., Tiberti M. M., Utkucu M., Valensise G., Vanneste K., Vilanova S., Wössner J. 2013. The European Database of Seismogenic Faults (EDSF) compiled in the framework of the Project SHARE. http://diss.rm.ingv.it/share-edsf/, doi: 10.6092/INGV.IT-SHARE-EDSF
Battaglia, M., Murray, M. H., Serpelloni, E., and Burgmann, R. 2004. The Adriatic region: An independent microplate within the Africa-Eurasia collision zone, Geophys. Res. Lett., 31, L09605, doi:10.1029/2004GL019723.
Benetatos, C., and Kiratzi, A., 2006. Finite-fault slip models for the 15 April 1979 (Mw7.1) Montenegro earthquake and its strongest aftershock of 24 May 1979 (Mw6.2): Tectonophysics, v. 421, p. 129–143, doi: 10.1016/j.tecto.2006.04.009.
Bennett, RA. S. Hreinsdóttir, G. Buble, T. Bašić, Ž. Bačić, M. Marjanović, G. Casale, A. Gendaszek, D. Cowan, 2008. Eocene to present subduction of southern Adria mantle lithosphere beneath the Dinarides. Geology, 36 (1): 3–6. https://doi.org/10.1130/G24136A.1
Bock, Y., Melgar, D. and Crowell, B.W., 2011. Real-time strong-motion broadband displacements from collocated GPS and accelerometers. Bulletin of the Seismological Society of America, 101(6), pp.2904-2925
Briole, P. 2017. Modelling of earthquake slip by inversion of GNSS and InSAR data assuming homogenous elastic medium. Zenodo, http://doi.org/10.5281/zenodo.1098399
Elliott, J. R., Nissen, E. K., England, P. C., Jackson, J. A., Lamb, S., Li, Z., et al. 2012. Slip in the 2010–2011 Canterbury earthquakes, New Zealand. Journal of Geophysical Research, 117, B03401. https://doi.org/10.1029/2011JB008868
Ganas, A., Gosar, A., and Drakatos, G. 2008. Static stress changes due to the 1998 and 2004 Krn Mountain (Slovenia) earthquakes and implications for future seismicity, Nat. Hazards Earth System Science, 8, 59-66. https://www.nat-hazards-earth-syst-sci.net/8/59/2008/
Ganas, A., Andritsou, N., Kosma, C., Argyrakis, P., Tsironi, V., Drakatos, G., 2018. A 20-yr database (1997–2017) of co-seismic displacements from GPS recordings in the Aegean area and their scaling with Mw and hypocentral distance. Bull. Geol. Soc. Greece, 52, 98–130, doi:10.12681/bgsg.18070.
Ganas, A., Briole, P., Bozionelos, G., Barberopoulou, A., Elias, P., Tsironi, V., Valkaniotis, S., Moshou, A., Mintourakis, I., 2020. The 25 October 2018 Mw= 6.7 Zakynthos earthquake (Ionian Sea, Greece): a low-angle fault model based on GNSS data, relocated seismicity, small tsunami and implications for the seismic hazard in the west Hellenic Arc. Journal of Geodynamics, 137, 101731. doi: https://doi.org/10.1016/j.jog.2020.101731
Goldstein, R. M.; Werner, C. L. 1998. Radar interferogram filtering for geophysical applications. Geophys. Res. Lett. 25(21), 4035-4038.
Grenerczy, G., Sella, G., Stein, S., and Kenyeres, A., 2005. Tectonic implications of the GPS velocity field in the northern Adriatic region: Geophysical Research Letters, v. 32, doi: 10.1029/2005GL022947
Herak, D.; Herak, M.; Tomljenovi´c, B., 2009. Seismicity and earthquake focal mechanisms in North-Western Croatia. Tectonophysics, 485, 212–220.
Marone, C., and Scholz, C.H., 1988. The depth of seismic faulting and the upper transition from stable to unstable slip regimes. Geophysical Research Letters, v. 15, p. 621–624.
Massonnet, D., M. Rossi, C. Carmona, F. Adragna, G. Peltzer, K. Feigl, and T. Rabaute, 1993. The displacement field of the Landers earthquake mapped by radar interferometry, Nature, 364, 138–142.
Melgar, D.; Crowell, B.W.; Geng, J.; Allen, R.M.; Bock, Y.; Riquelme, S.; Hill, E.M.; Protti, M.; Ganas, A. 2015. Earthquake magnitude calculation without saturation from the scaling of peak ground displacement. Geophys. Res. Lett., 42, 5197–5205, doi:10.1002/2015gl064278.
Métois, M., D’Agostino, N., Avallone, A., Chamot‐Rooke, N., Rabaute, A., Duni, L., Kuka, N., Koci, R., and Georgiev, I. 2015. Insights on continental collisional processes from GPS data: Dynamics of the peri‐Adriatic belts, J. Geophys. Res. Solid Earth, 120, 8701– 8719, doi:10.1002/2015JB012023.
Peyret, M., J. Chéry, Y. Djamour, A. Avallone, F. Sarti, P. Briole, M. Sarpoulaki, 2007. The source motion of 2003 Bam (Iran) earthquake constrained by satellite and ground-based geodetic data, Geophysical Journal International, 169, 3, 849–865, https://doi.org/10.1111/j.1365-246X.2007.03358.x
Ruhl, C.J., Melgar, D., Geng, J., Goldberg, D.E., Crowell, B.W., et al., 2018. A global database of strong-motion displacement GNSS recordings and an example application to PGD scaling. Seismological Research Letters, 90(1), pp.271-279
Stein, R. S., Toda, S., 2021. Stress analysis shows slight increase in seismic hazard near Zagreb, Temblor, http://doi.org/10.32858/temblor.149
Wiemer, S., 2001. A software package to analyze seismicity: ZMAP. Seismological Research Letters, 72(3), pp.373-382 https://doi.org/10.1785/gssrl.72.3.373
- Venezuela’s doublet leaned toward Caracas - June 30, 2026
- Is Southern California’s Cajon Pass an ‘earthquake gate’ ready to open? - June 29, 2026
- Philippines magnitude 7.8 shock may have loaded the central Cotabato subduction zone - June 11, 2026